
Houses for sale in Bury, Petworth
House Prices in Bury
Properties in Bury have an average house price of £865k and had 34 Property Transactions within the last 3 years¹.
Bury is an area in Petworth, Surrey with 398 households², where the most expensive property was sold for £2.4M.
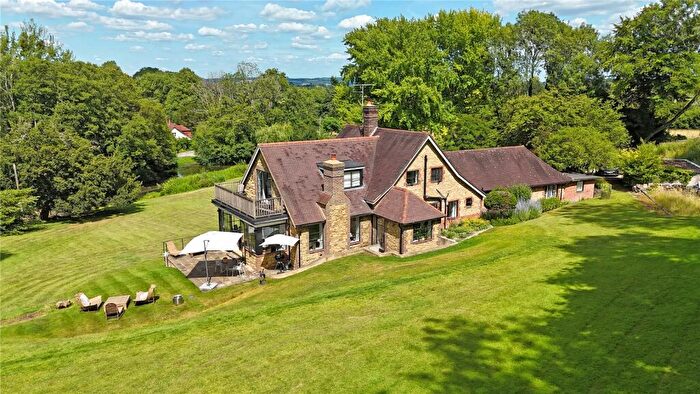
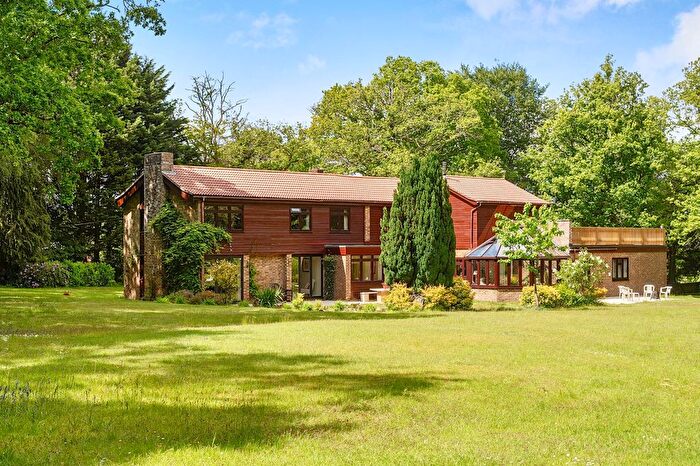
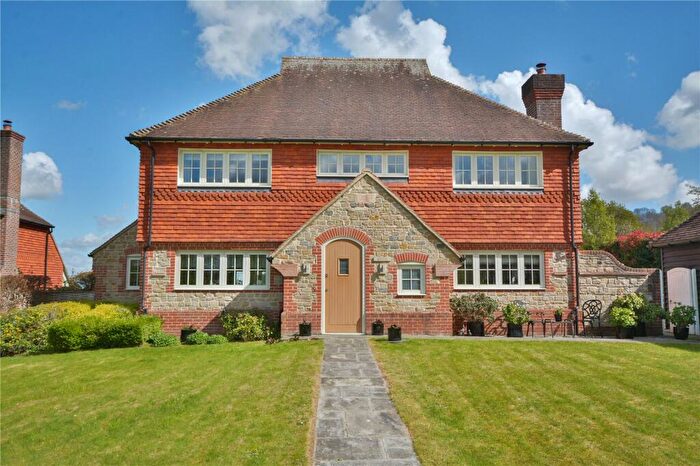
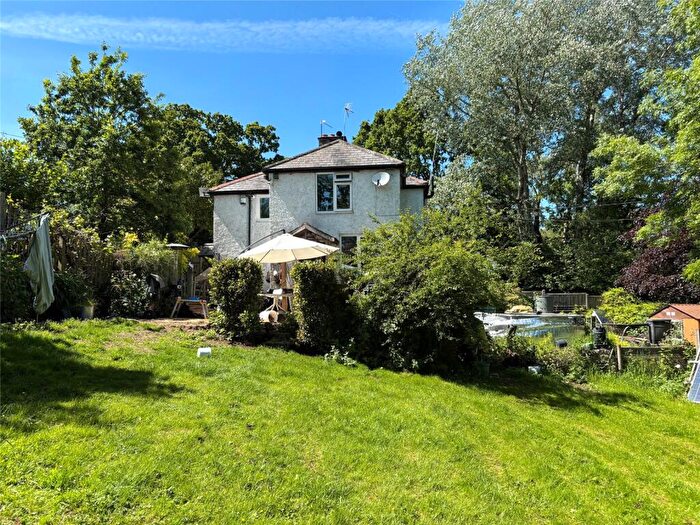
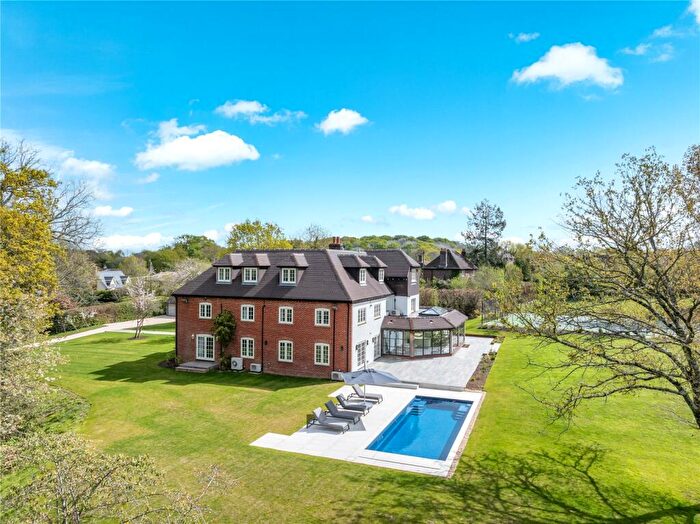
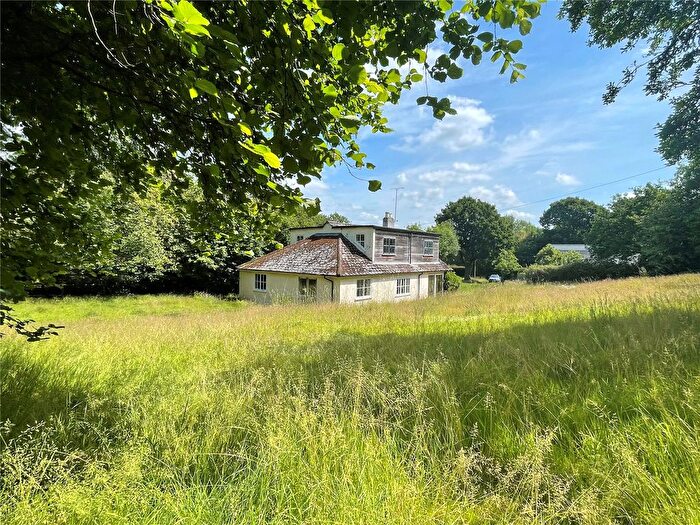
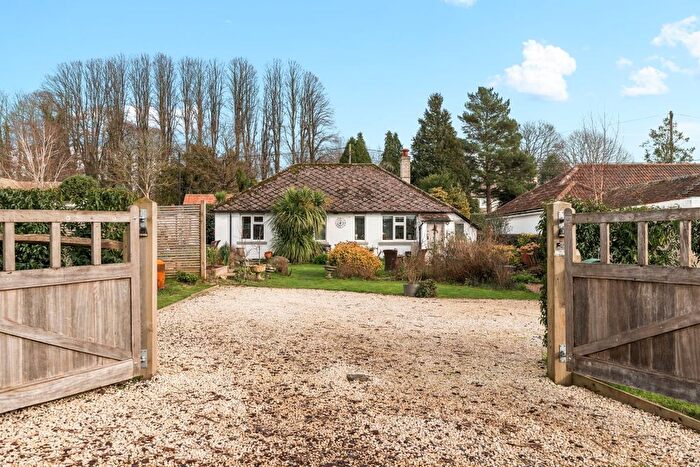
Properties for sale in Bury
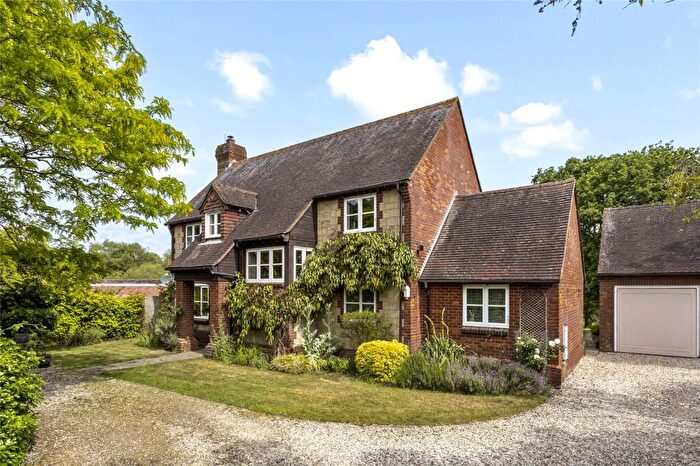
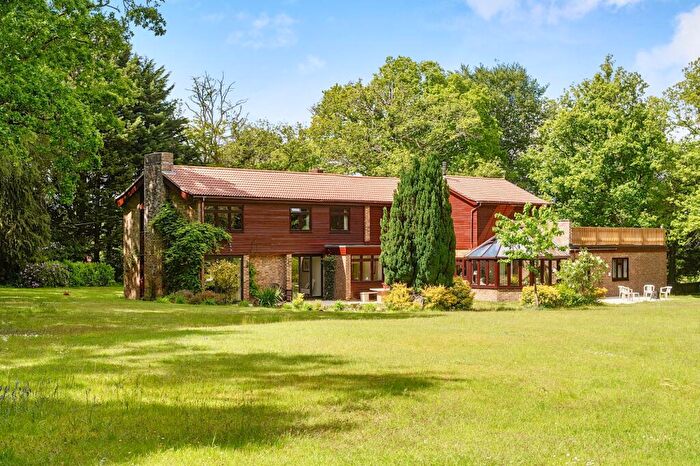
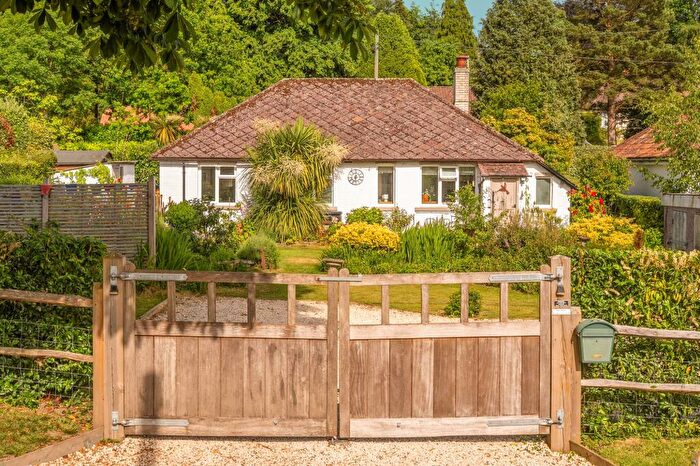
![]()
If you are looking to sell your house, let it out, or receive a property valuation, an expert can help you.
Click the button below to get started.
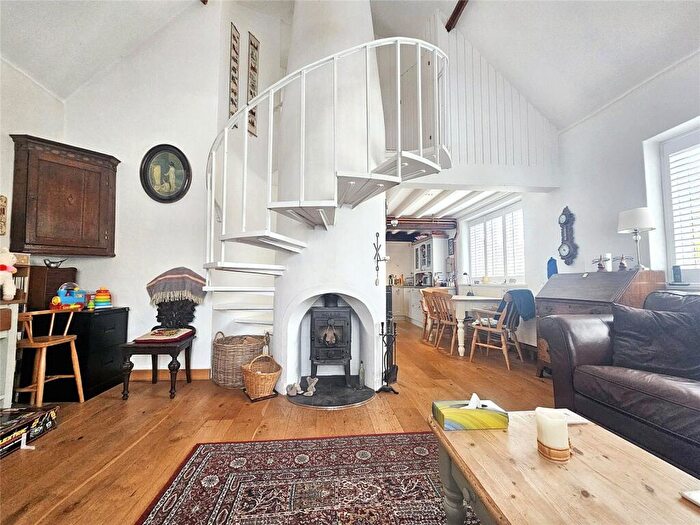
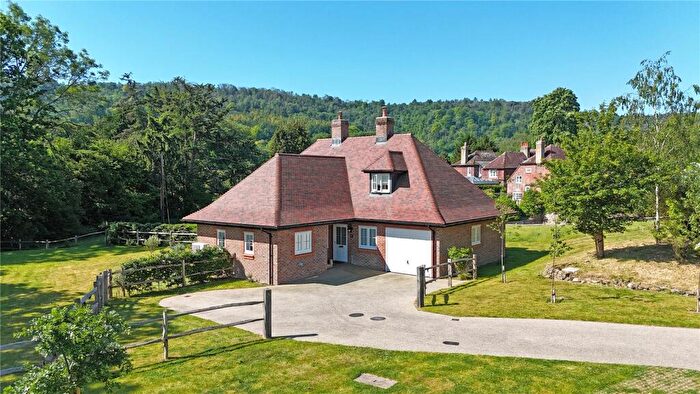
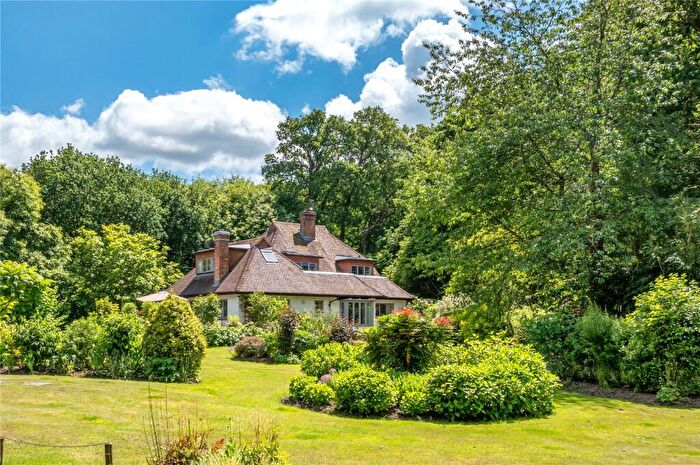
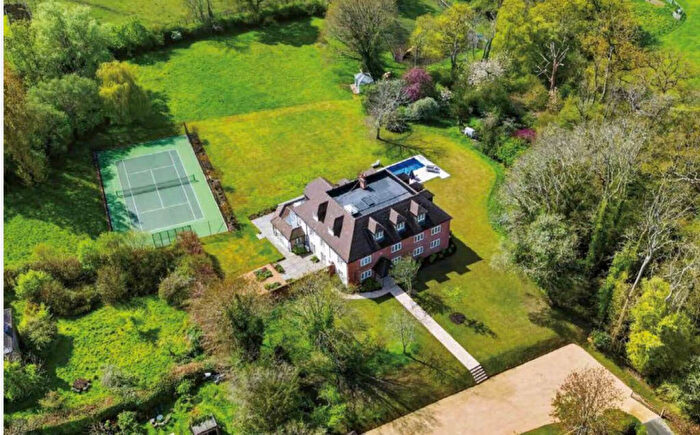
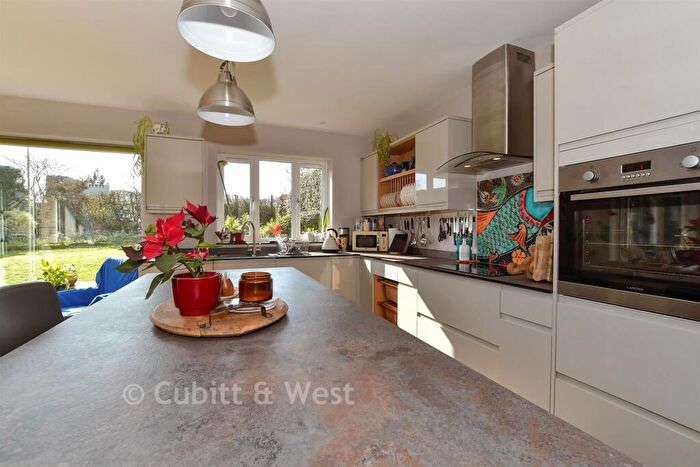
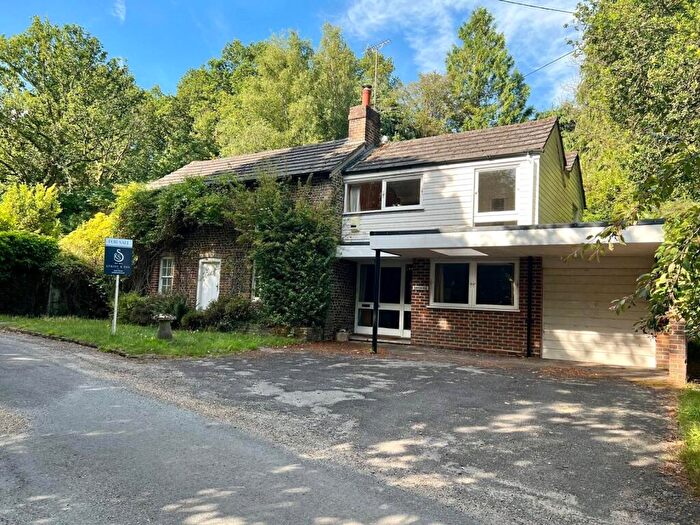
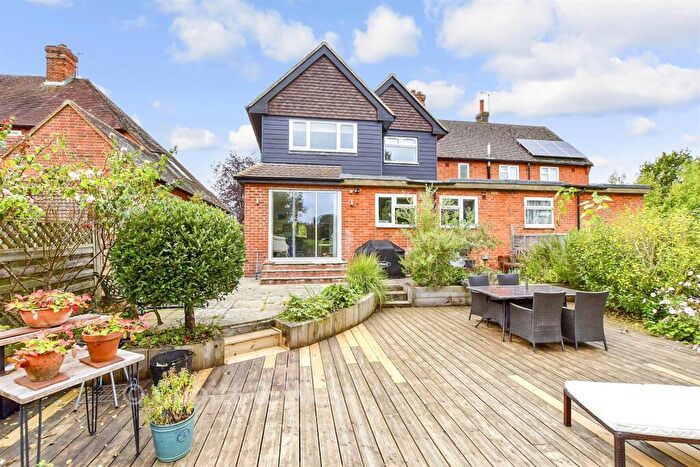
Previously listed properties in Bury
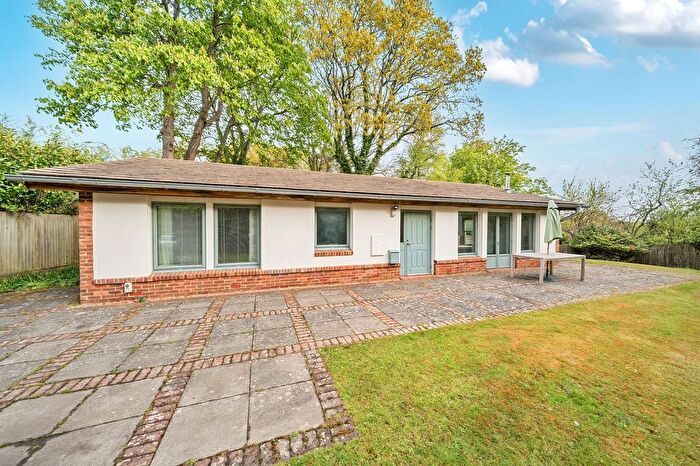
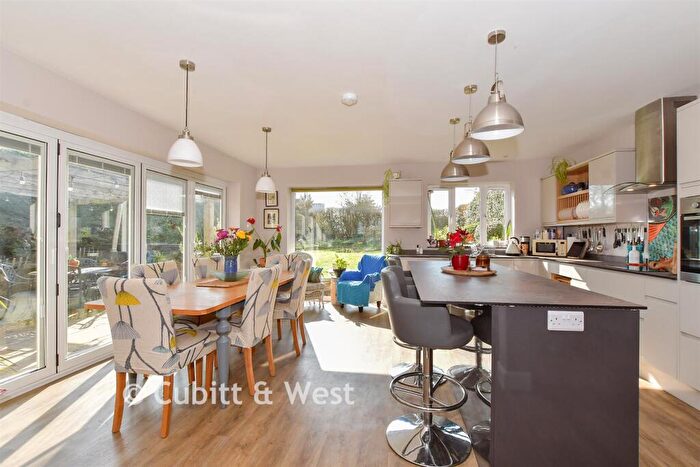

![]()
If you are looking to sell your house, let it out, or receive a property valuation, an expert can help you.
Click the button below to get started.


Roads and Postcodes in Bury
Navigate through our locations to find the location of your next house in Bury, Petworth for sale or to rent.
| Streets | Postcodes |
|---|---|
| Beechwood Lane | GU28 0NA |
| Biddulph Mews | GU28 0PD |
| Boderton Mews | GU28 0LS |
| Burton Park | GU28 0QU |
| Burton Park Road | GU28 0JR GU28 0JS GU28 0JU |
| Council Cottages | GU28 0LD |
| Duncton Common | GU28 0JX |
| Dye House Lane | GU28 0LF |
| Garden Mews | GU28 0QS |
| Guillods Cottages | GU28 0NR |
| Lavington Common | GU28 0QL |
| Lodge Green | GU28 0LH |
| Nonnington Lane | GU28 0PX |
| Norwood Lane | GU28 0QG |
| The Street | GU28 0QA GU28 0QB |
| Willett Close | GU28 0LA |
| Woodcote Cottages | GU28 0NY |
| GU28 0JY GU28 0JZ GU28 0LB GU28 0LG GU28 0LT GU28 0NJ GU28 0NL GU28 0NP GU28 0NS GU28 0NT GU28 0NZ GU28 0PT GU28 0PU GU28 0PW GU28 0PY GU28 0QD GU28 0QE GU28 0QF GU28 0QH |
Property price trends in Bury
According to the latest Land Registry data, the average home in Bury sold for £693,357 in 2025. That figure comes from 501 sales logged over the past 30 years.
Prices have fallen back over the last three years. Compared with 2022, when the typical sale came in around £1,243,407, that's a fall of roughly 44.2%.
Looking back five years, average prices are down about 27.1% since 2020, a drop of around £258,004 in cash terms.
Zoom out to the past decade for the fuller picture. Back in 2015, homes here averaged £565,455, so the typical sold price has climbed about 22.6% since then, roughly 2.1% a year. Stretch the view to fifteen years and that annual pace eases back to about -1.3%.
Frequently asked questions about Bury
What is the average price for a property for sale in Bury?
The average price for a property for sale in Bury is £865,021. This amount is 17% higher than the average price in Petworth. There are 122 property listings for sale in Bury.
What streets have the most expensive properties for sale in Bury?
The streets with the most expensive properties for sale in Bury are Duncton Common at an average of £1,200,000, The Street at an average of £1,137,500 and Burton Park Road at an average of £842,500.
What streets have the most affordable properties for sale in Bury?
The streets with the most affordable properties for sale in Bury are Willett Close at an average of £290,000, Guillods Cottages at an average of £515,000 and Garden Mews at an average of £627,500.
Which train stations are available in or near Bury?
Some of the train stations available in or near Bury are Pulborough, Amberley and Barnham.
Property Price Paid in Bury by Year
The average sold property price by year was:
| Year | Average Sold Price | Price Change |
Sold Properties
|
|---|---|---|---|
| 2025 | £693,357 | -32% |
14 Properties |
| 2024 | £916,363 | -17% |
11 Properties |
| 2023 | £1,069,303 | -16% |
9 Properties |
| 2022 | £1,243,407 | 15% |
12 Properties |
| 2021 | £1,056,227 | 10% |
22 Properties |
| 2020 | £951,361 | 19% |
18 Properties |
| 2019 | £766,491 | -13% |
12 Properties |
| 2018 | £864,136 | 9% |
11 Properties |
| 2017 | £786,461 | 18% |
13 Properties |
| 2016 | £643,800 | 12% |
20 Properties |
Property Price per Property Type in Bury
Here you can find historic sold price data in order to help with your property search.
The average Property Paid Price for specific property types in the last three years are:
| Property Type | Average Sold Price | Sold Properties |
|---|---|---|
| Semi Detached House | £545,000.00 | 4 Semi Detached Houses |
| Detached House | £942,529.00 | 25 Detached Houses |
| Terraced House | £704,375.00 | 4 Terraced Houses |
| Flat | £850,000.00 | 1 Flat |
