
Houses for sale in Bury, Pulborough
House Prices in Bury
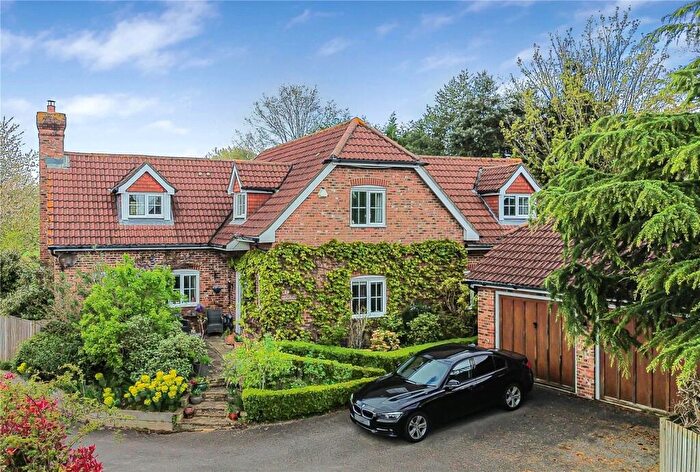
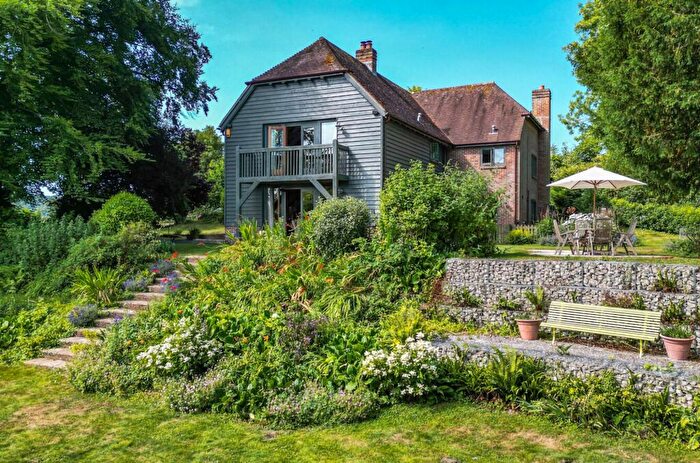
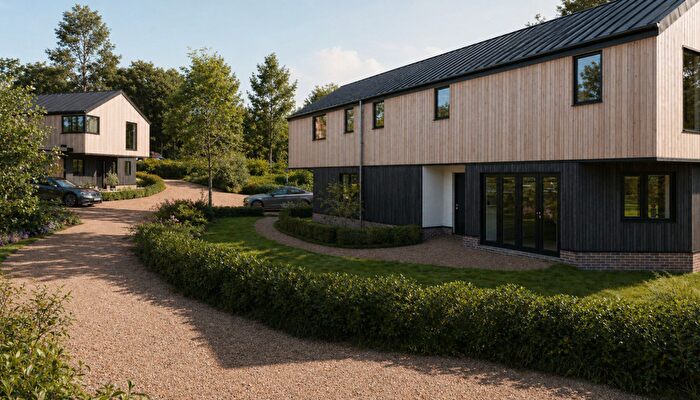
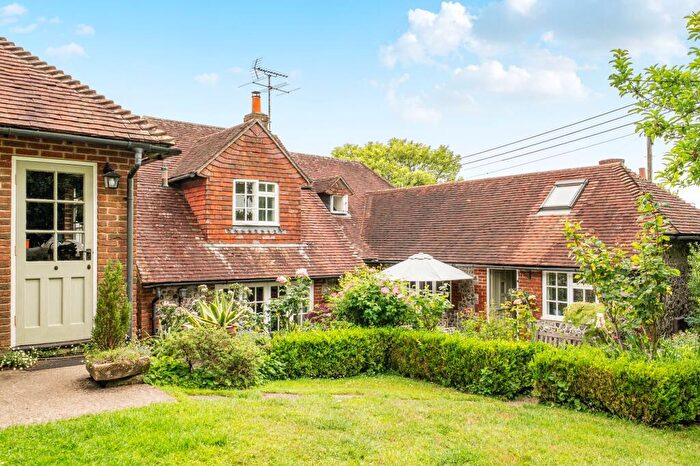
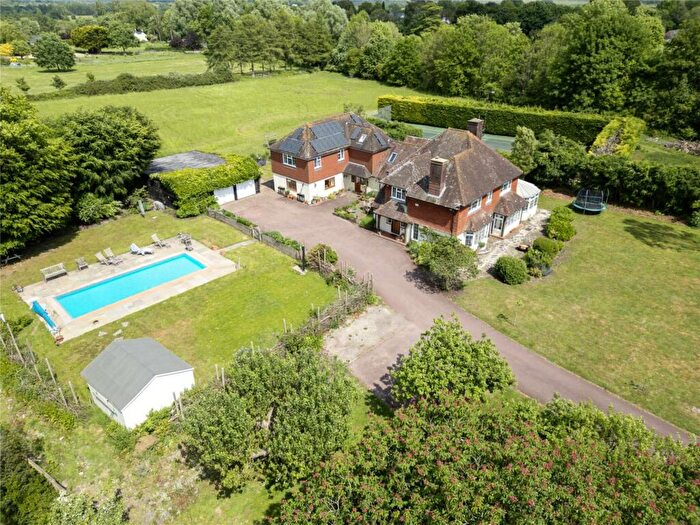
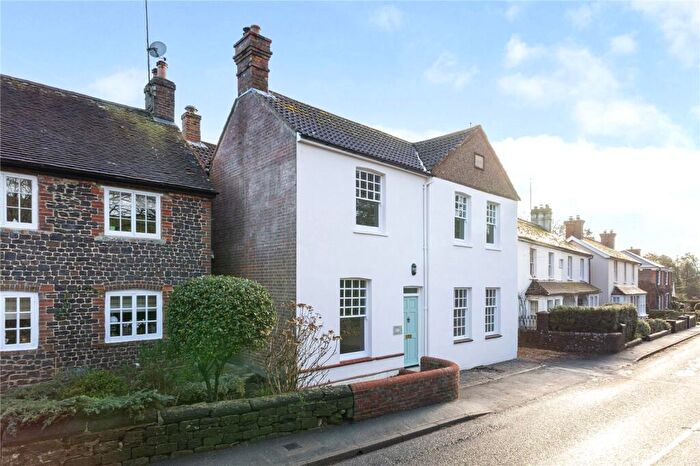
Properties in Bury have an average house price of £900k and had 29 Property Transactions within the last 3 years¹.
Bury is an area in Pulborough, Surrey with 384 households², where the most expensive property was sold for £1.8M.
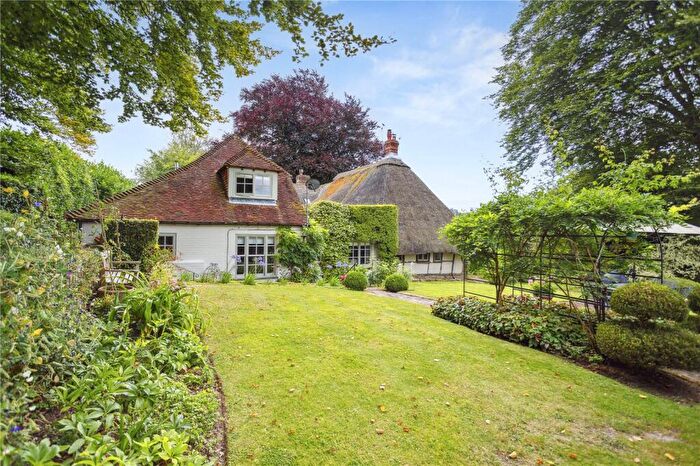
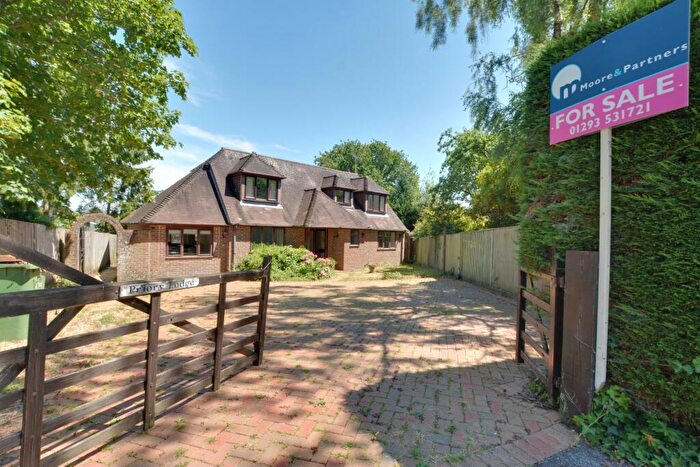
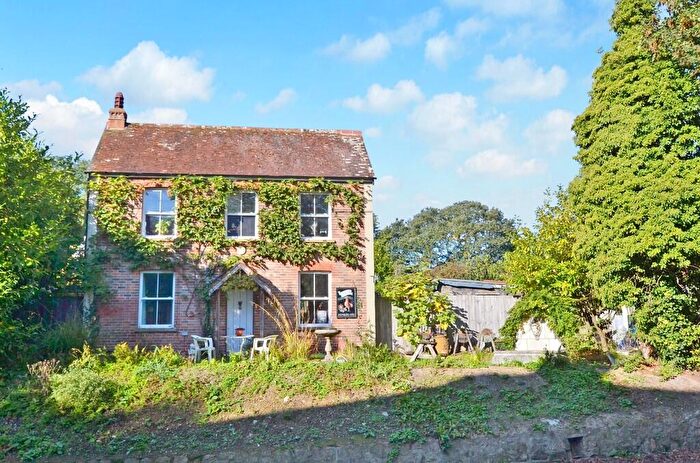
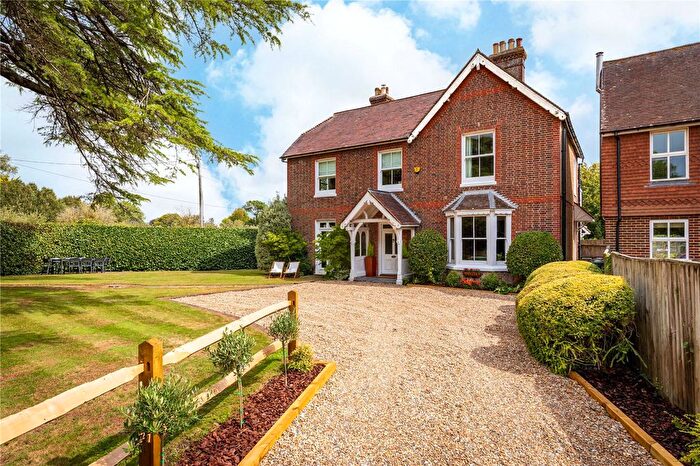
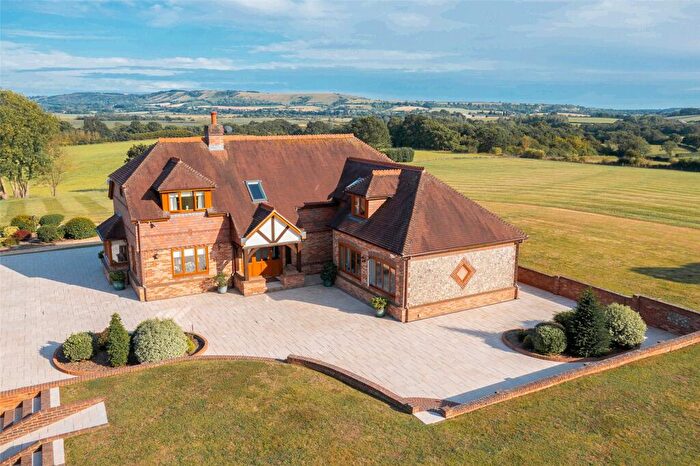
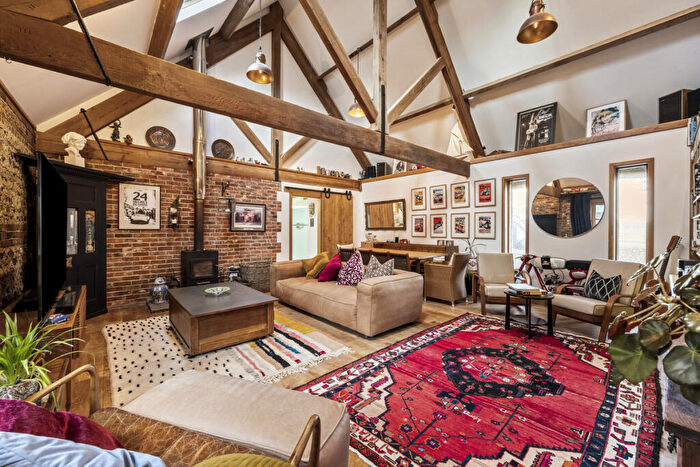
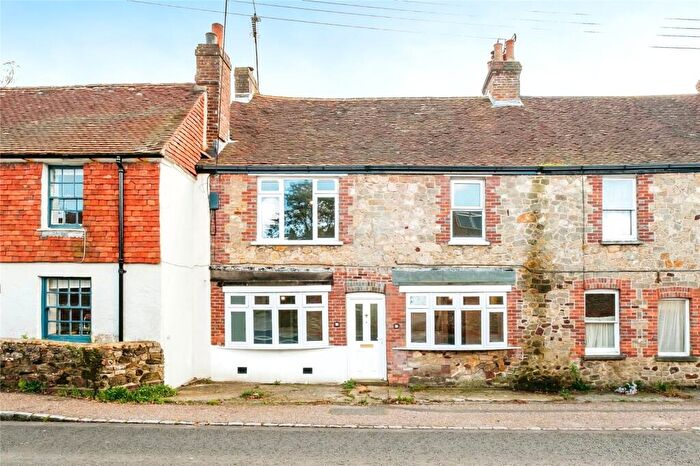
Properties for sale in Bury
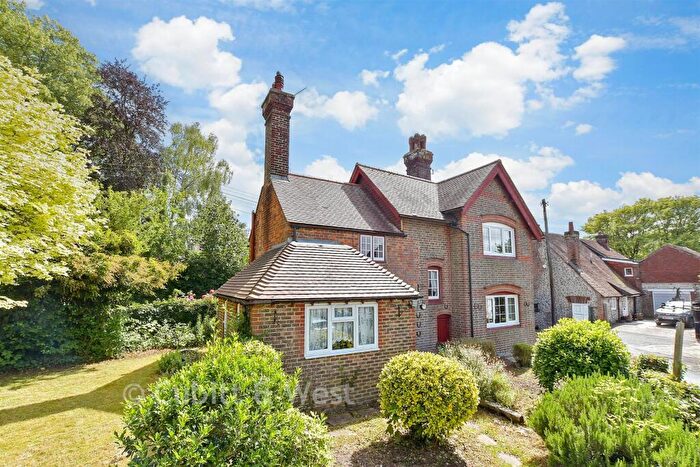
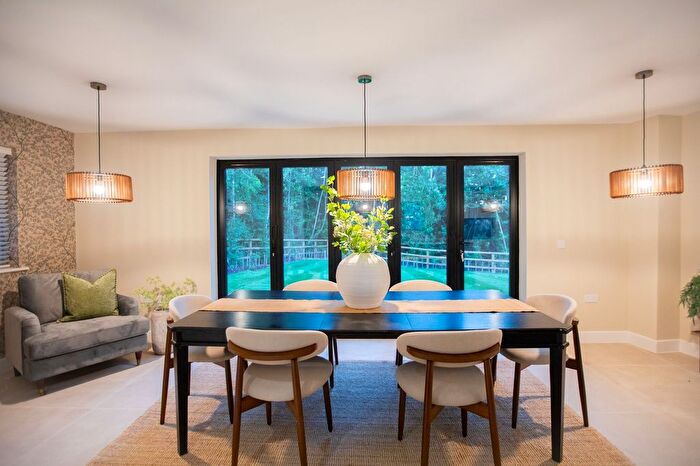
![]()
If you are looking to sell your house, let it out, or receive a property valuation, an expert can help you.
Click the button below to get started.
Roads and Postcodes in Bury
Navigate through our locations to find the location of your next house in Bury, Pulborough for sale or to rent.
| Streets | Postcodes |
|---|---|
| Barlavington Lane | RH20 1PN |
| Bignor Park Road | RH20 1HQ |
| Bury Common | RH20 1NP RH20 1NR RH20 1NS RH20 1NT |
| Burygate | RH20 1EY RH20 1EZ RH20 1HA RH20 1NL RH20 1NN |
| Church Lane | RH20 1PB |
| Coombe Crescent | RH20 1PE |
| Greenfield | RH20 1PP |
| Hadworth Lane | RH20 1PG |
| Hale Hill | RH20 1HE |
| Houghton Lane | RH20 1PD |
| Salters Cottages | RH20 1PR |
| School Lane | RH20 1PU |
| The Street | RH20 1PA RH20 1PF RH20 1PS RH20 1PX RH20 1PY |
| Tripp Hill | RH20 1EX |
| Westburton Lane | RH20 1HB |
| RH20 1HD RH20 1PJ RH20 1PL RH20 1PQ |
Property price trends in Bury
According to the latest Land Registry data, the average home in Bury sold for £757,475 in 2026. That figure comes from 401 sales logged over the past 31 years.
Prices have fallen back over the last three years. Compared with 2023, when the typical sale came in around £807,423, that's a fall of roughly 6.2%.
Looking back five years, average prices are down about 3% since 2021, a drop of around £23,142 in cash terms.
Zoom out to the past decade for the fuller picture. Back in 2016, homes here averaged £946,300, so the typical sold price has fallen about 20% since then, around 2.2% a year lower. Stretch the view to fifteen years and that annual pace edges up closer to 2.3%.
Frequently asked questions about Bury
What is the average price for a property for sale in Bury?
The average price for a property for sale in Bury is £900,100. This amount is 14% higher than the average price in Pulborough. There are 302 property listings for sale in Bury.
What streets have the most expensive properties for sale in Bury?
The streets with the most expensive properties for sale in Bury are The Street at an average of £1,052,265, Burygate at an average of £854,000 and Houghton Lane at an average of £794,833.
What streets have the most affordable properties for sale in Bury?
The streets with the most affordable properties for sale in Bury are Coombe Crescent at an average of £299,950 and Bury Common at an average of £711,000.
Which train stations are available in or near Bury?
Some of the train stations available in or near Bury are Amberley, Pulborough and Arundel.
Property Price Paid in Bury by Year
The average sold property price by year was:
| Year | Average Sold Price | Price Change |
Sold Properties
|
|---|---|---|---|
| 2026 | £757,475 | -12% |
2 Properties |
| 2025 | £848,071 | -37% |
7 Properties |
| 2024 | £1,164,992 | 31% |
7 Properties |
| 2023 | £807,423 | 6% |
13 Properties |
| 2022 | £761,642 | -2% |
14 Properties |
| 2021 | £780,617 | -10% |
17 Properties |
| 2020 | £859,850 | -16% |
17 Properties |
| 2019 | £998,266 | 23% |
3 Properties |
| 2018 | £769,375 | -13% |
8 Properties |
| 2017 | £867,707 | -9% |
9 Properties |
Property Price per Property Type in Bury
Here you can find historic sold price data in order to help with your property search.
The average Property Paid Price for specific property types in the last three years are:
| Property Type | Average Sold Price | Sold Properties |
|---|---|---|
| Semi Detached House | £604,166.00 | 3 Semi Detached Houses |
| Terraced House | £463,316.00 | 3 Terraced Houses |
| Detached House | £995,671.00 | 23 Detached Houses |
