
Houses for sale in Reigate, Surrey
House Prices in Reigate
Properties in Reigate have an average house price of £651k and had 1,247 Property Transactions within the last 3 years.¹
Reigate is an area in Surrey with 10,874 households², where the most expensive property was sold for £3.55M.
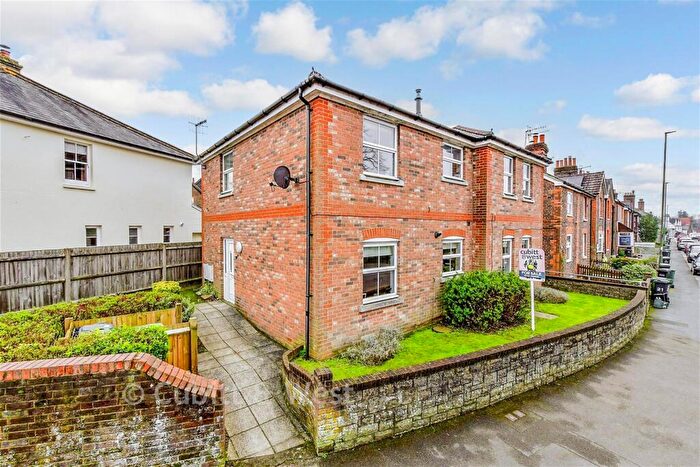
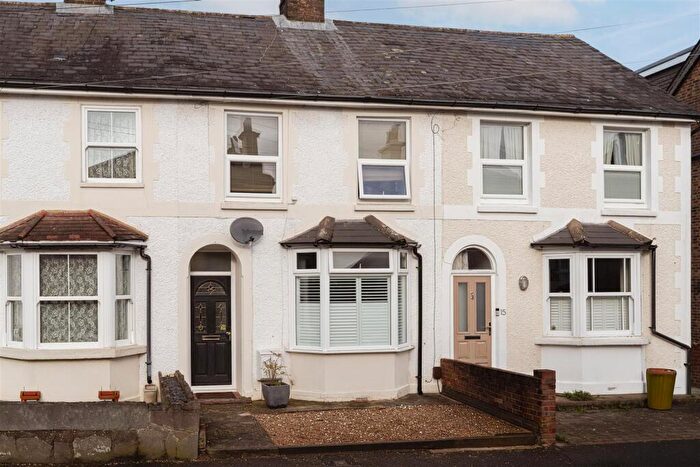
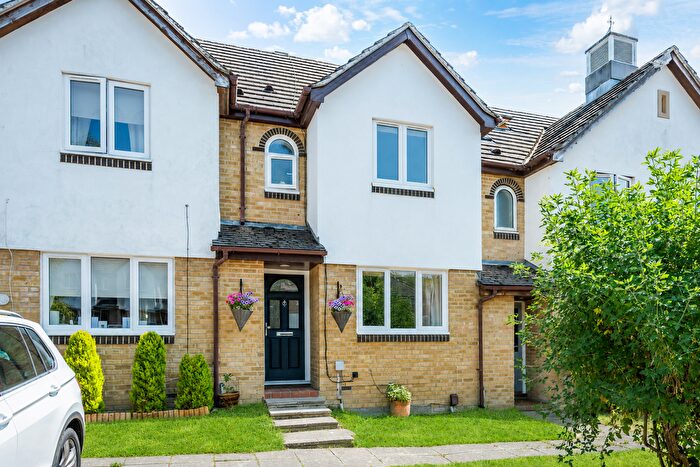
Properties for sale in Reigate
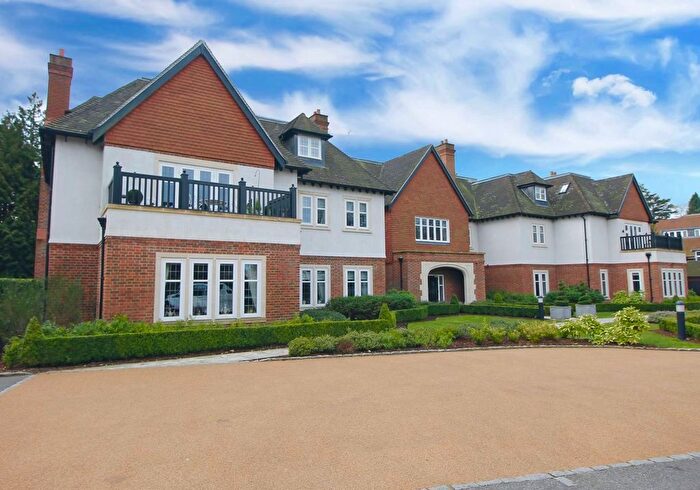

![]()
If you are looking to sell your house, let it out, or receive a property valuation, an expert can help you.
Click the button below to get started.


Neighbourhoods in Reigate
Navigate through our locations to find the location of your next house in Reigate, Surrey for sale or to rent.
- Brockham, Betchworth And Buckland
- Capel, Leigh And Newdigate
- Chipstead, Hooley And Woodmansterne
- Kingswood With Burgh Heath
- Meadvale And St Johns
- Merstham
- Redhill West
- Reigate Central
- Reigate Hill
- Salfords And Sidlow
- South Park And Woodhatch
- Reigate
- Redhill West & Wray Common
- Chipstead, Kingswood & Woodmansterne
- Meadvale & St John's
- South Park & Woodhatch
- Horley West & Sidlow
Property price trends in Reigate
According to the latest Land Registry data, the average home in Reigate sold for £559,868 in 2026. That figure comes from a substantial record of 15,806 sales logged over the past 31 years.
Prices have fallen back over the last three years. Compared with 2023, when the typical sale came in around £643,811, that's a fall of roughly 13%.
Looking back five years, average prices are down about 8% since 2021, a drop of around £48,652 in cash terms.
Zoom out to the past decade for the fuller picture. Back in 2016, homes here averaged £517,078, so the typical sold price has climbed about 8.3% since then, roughly 0.8% a year. Stretch the view to fifteen years and that annual pace edges up closer to 2.2%.
Frequently asked questions about Reigate
What is the average price for a property for sale in Reigate?
The average price for a property for sale in Reigate is £651,439. This amount is 7% higher than the average price in Surrey. There are more than 10,000 property listings for sale in Reigate.
What locations have the most expensive properties for sale in Reigate?
The locations with the most expensive properties for sale in Reigate are Capel, Leigh And Newdigate at an average of £849,866, Meadvale And St Johns at an average of £793,923 and South Park & Woodhatch at an average of £727,500.
What locations have the most affordable properties for sale in Reigate?
The locations with the most affordable properties for sale in Reigate are Merstham at an average of £376,666, Reigate at an average of £417,127 and Redhill West & Wray Common at an average of £461,666.
Which train stations are available in or near Reigate?
Some of the train stations available in or near Reigate are Reigate, Earlswood (Surrey) and Redhill.
Property Price Paid in Reigate by Year
The average sold property price by year was:
| Year | Average Sold Price | Price Change |
Sold Properties
|
|---|---|---|---|
| 2026 | £559,868 | -19% |
22 Properties |
| 2025 | £663,671 | 2% |
413 Properties |
| 2024 | £650,889 | 1% |
446 Properties |
| 2023 | £643,811 | -7% |
366 Properties |
| 2022 | £688,560 | 12% |
535 Properties |
| 2021 | £608,520 | - |
600 Properties |
| 2020 | £608,363 | 1% |
392 Properties |
| 2019 | £601,493 | 5% |
371 Properties |
| 2018 | £572,587 | 2% |
399 Properties |
| 2017 | £560,006 | 8% |
475 Properties |
Property Price per Property Type in Reigate
Here you can find historic sold price data in order to help with your property search.
The average Property Paid Price for specific property types in the last three years are:
| Property Type | Average Sold Price | Sold Properties |
|---|---|---|
| Semi Detached House | £663,697.00 | 307 Semi Detached Houses |
| Detached House | £1,194,506.00 | 295 Detached Houses |
| Terraced House | £560,619.00 | 205 Terraced Houses |
| Flat | £321,099.00 | 440 Flats |
Transport in Reigate
Please see below transportation links in this area:
