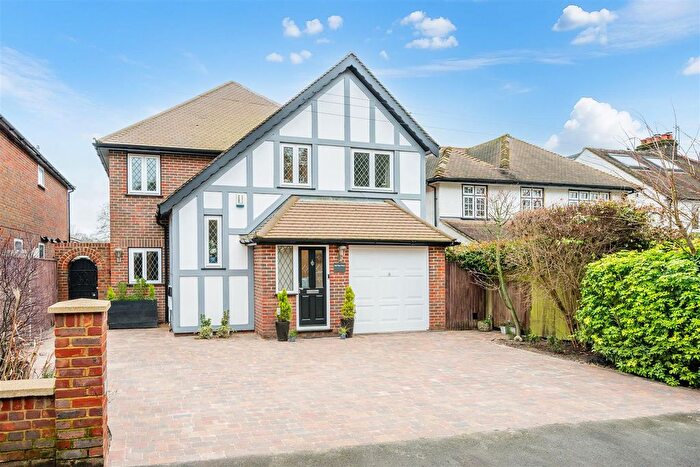
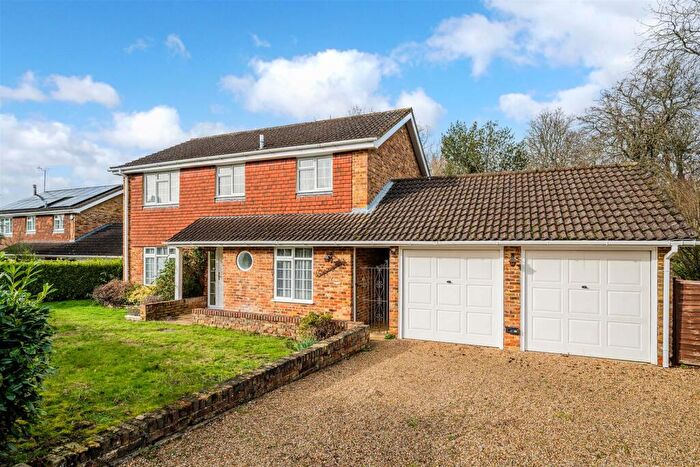
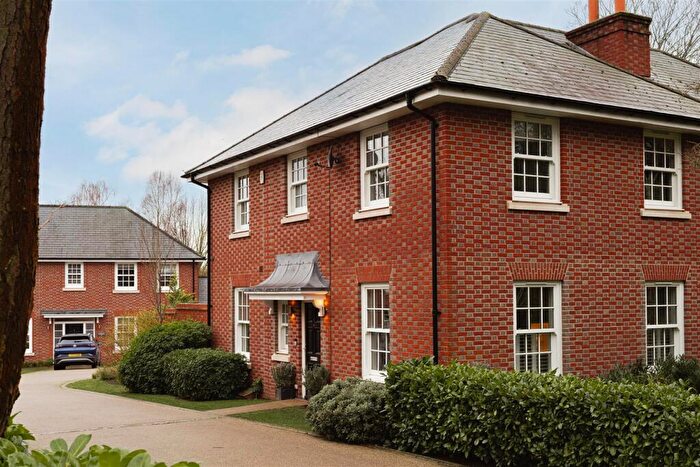
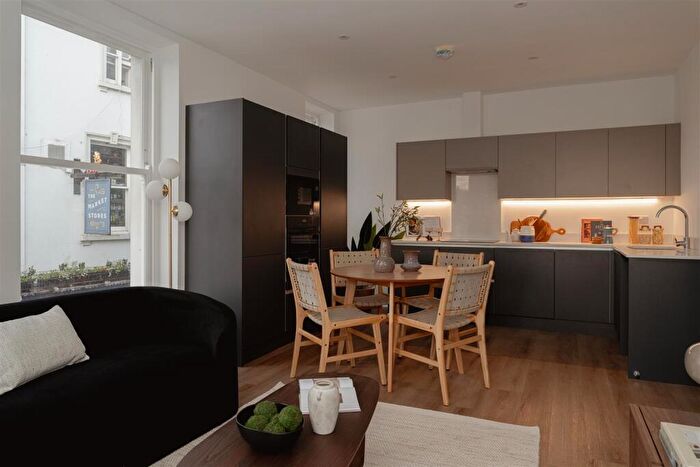
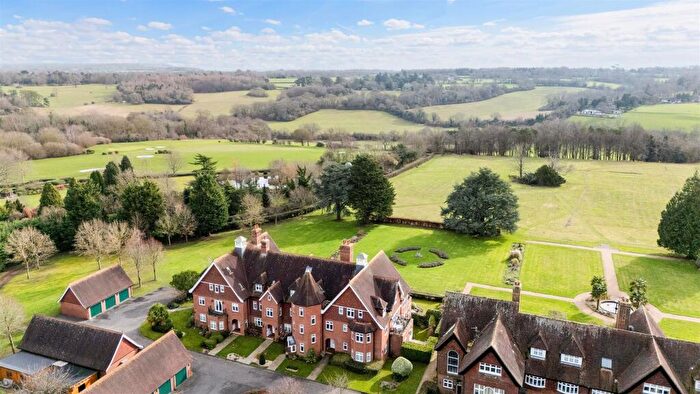
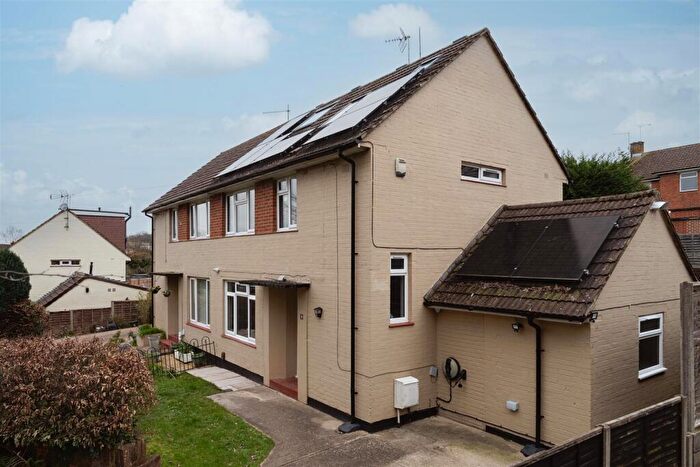
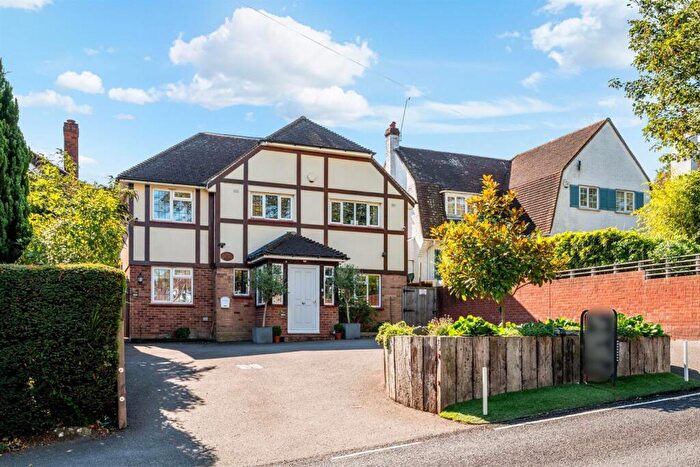
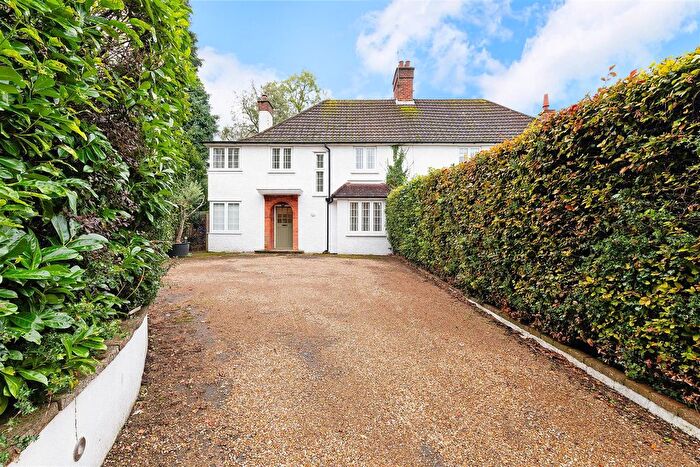
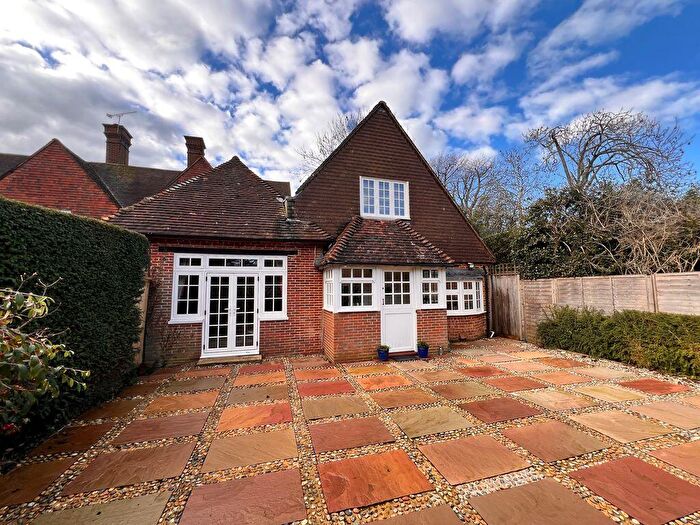
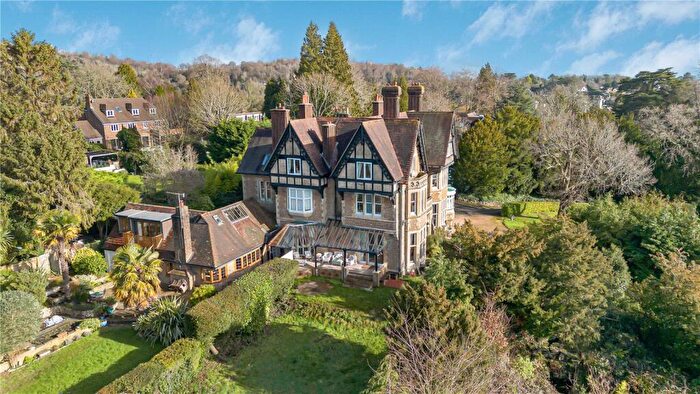
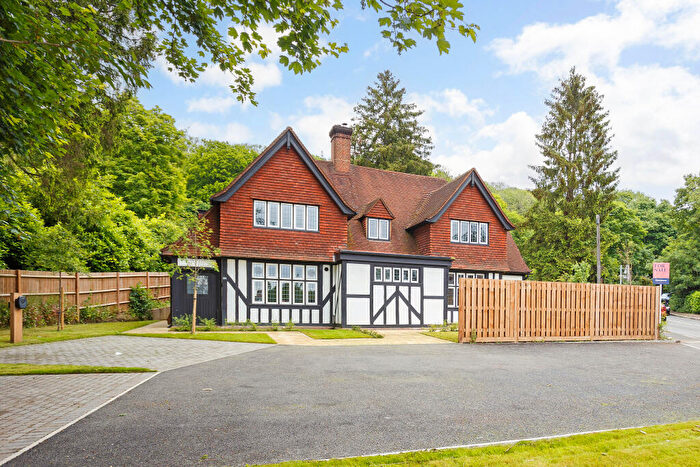
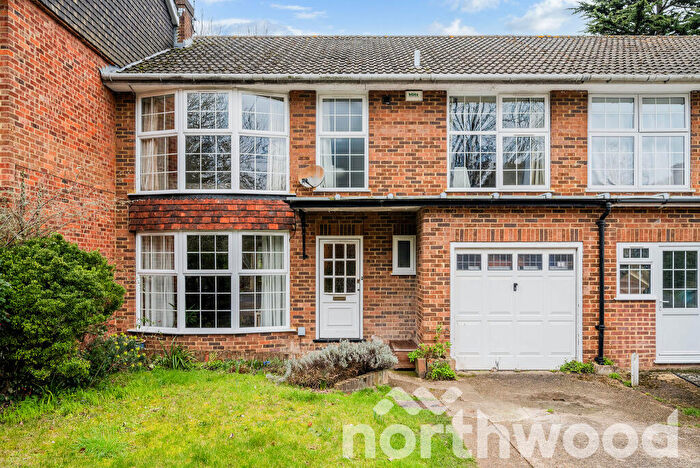
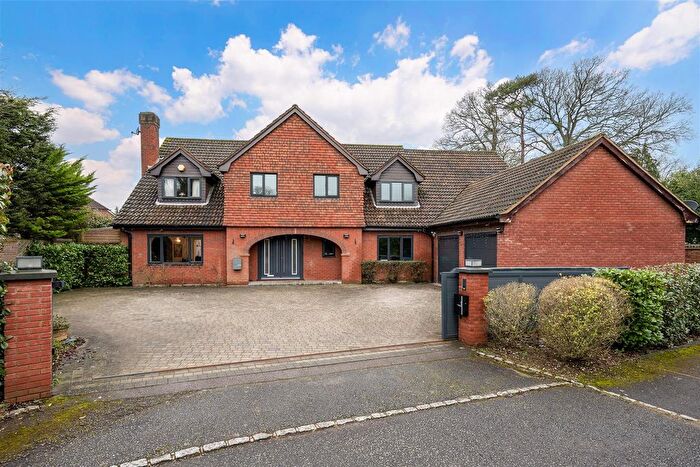
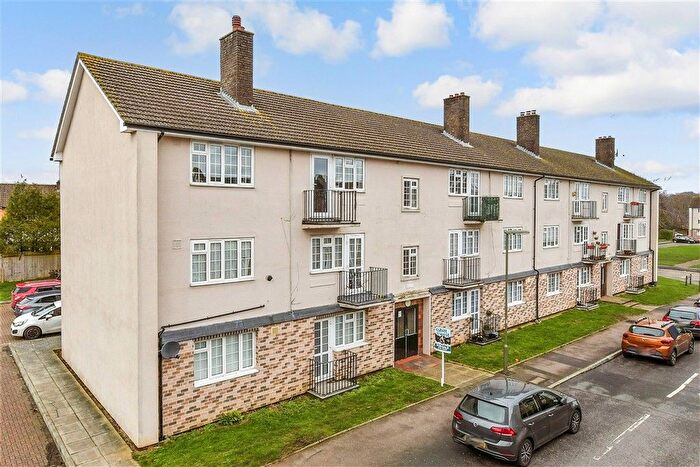
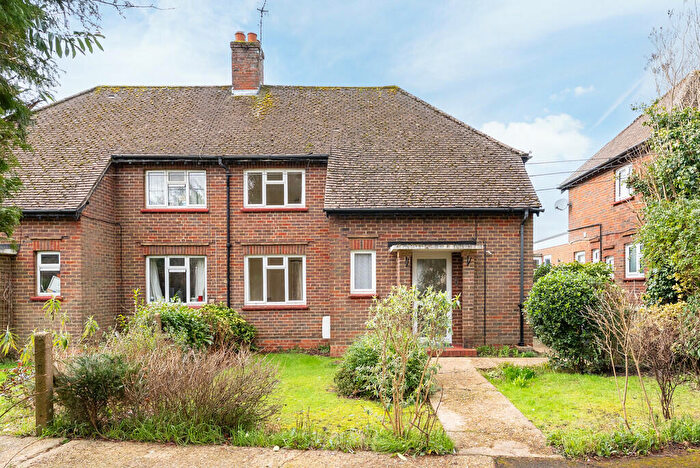
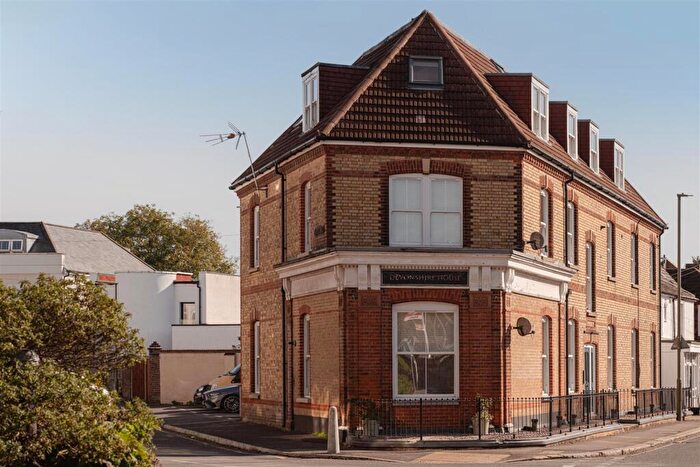
Houses for sale & to rent in Tadworth, Surrey
House Prices in Tadworth
Properties in Tadworth have an average house price of £760,942.00 and had 771 Property Transactions within the last 3 years.¹
Tadworth is an area in Surrey with 8,347 households², where the most expensive property was sold for £7,000,000.00.
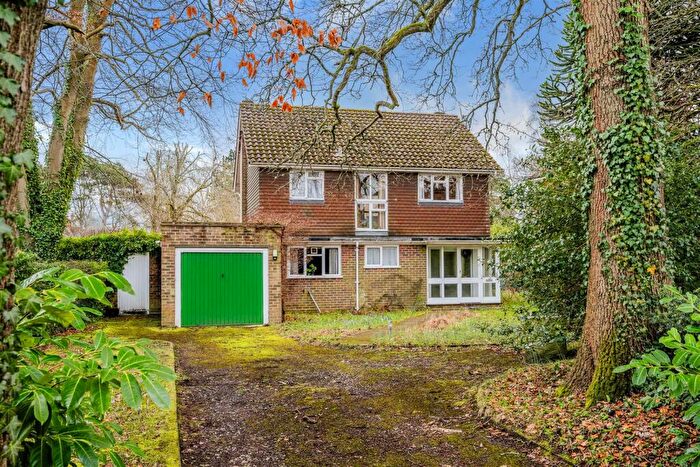
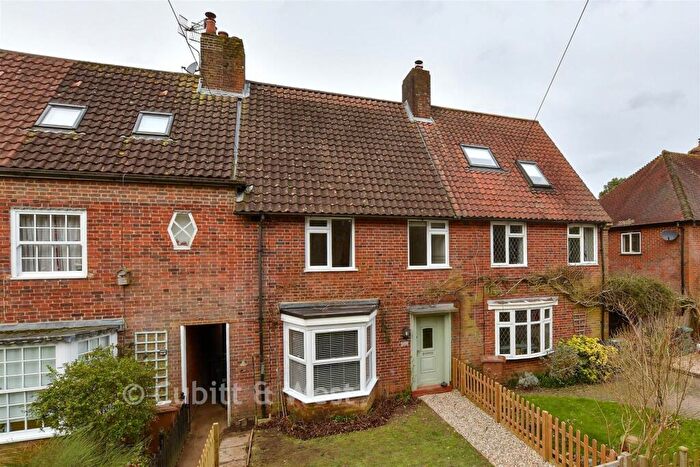
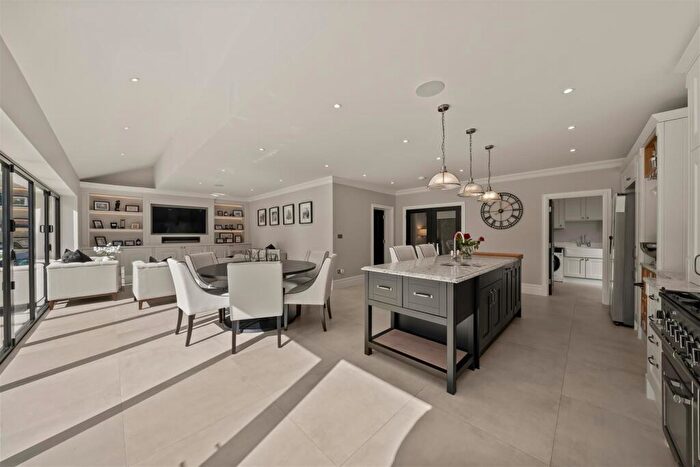
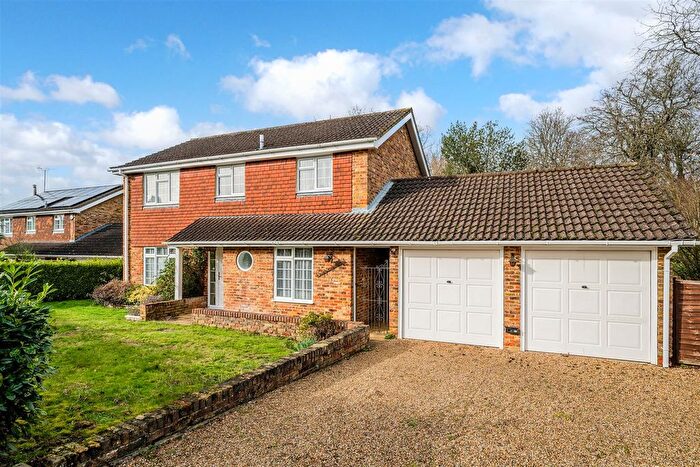
Properties for sale in Tadworth
Neighbourhoods in Tadworth
Navigate through our locations to find the location of your next house in Tadworth, Surrey for sale or to rent.
Transport in Tadworth
Please see below transportation links in this area:
- FAQ
- Price Paid By Year
- Property Type Price
Frequently asked questions about Tadworth
What is the average price for a property for sale in Tadworth?
The average price for a property for sale in Tadworth is £760,942. This amount is 25% higher than the average price in Surrey. There are more than 10,000 property listings for sale in Tadworth.
What locations have the most expensive properties for sale in Tadworth?
The locations with the most expensive properties for sale in Tadworth are Brockham, Betchworth And Buckland at an average of £1,110,000, Box Hill And Headley at an average of £1,076,666 and Kingswood With Burgh Heath at an average of £1,019,473.
What locations have the most affordable properties for sale in Tadworth?
The locations with the most affordable properties for sale in Tadworth are Preston at an average of £400,571, Tattenham Corner & Preston at an average of £430,534 and Tattenhams at an average of £433,796.
Which train stations are available in or near Tadworth?
Some of the train stations available in or near Tadworth are Tadworth, Kingswood and Tattenham Corner.
Property Price Paid in Tadworth by Year
The average sold property price by year was:
| Year | Average Sold Price | Price Change |
Sold Properties
|
|---|---|---|---|
| 2025 | £737,587 | -3% |
212 Properties |
| 2024 | £756,167 | -4% |
306 Properties |
| 2023 | £786,288 | 7% |
253 Properties |
| 2022 | £730,182 | 2% |
396 Properties |
| 2021 | £715,254 | 3% |
502 Properties |
| 2020 | £695,261 | 6% |
375 Properties |
| 2019 | £652,288 | -1% |
330 Properties |
| 2018 | £655,658 | 15% |
306 Properties |
| 2017 | £554,739 | -19% |
353 Properties |
| 2016 | £659,628 | 10% |
419 Properties |
| 2015 | £593,523 | 0,4% |
397 Properties |
| 2014 | £591,264 | -2% |
436 Properties |
| 2013 | £602,776 | 21% |
395 Properties |
| 2012 | £476,662 | -19% |
290 Properties |
| 2011 | £565,927 | 6% |
276 Properties |
| 2010 | £534,539 | 23% |
341 Properties |
| 2009 | £411,168 | -6% |
229 Properties |
| 2008 | £435,893 | -0,3% |
221 Properties |
| 2007 | £437,040 | 9% |
485 Properties |
| 2006 | £396,063 | -5% |
490 Properties |
| 2005 | £416,520 | 11% |
404 Properties |
| 2004 | £371,857 | 9% |
441 Properties |
| 2003 | £340,210 | 6% |
427 Properties |
| 2002 | £320,596 | 13% |
549 Properties |
| 2001 | £277,444 | 10% |
447 Properties |
| 2000 | £250,299 | 17% |
442 Properties |
| 1999 | £207,566 | 13% |
500 Properties |
| 1998 | £180,226 | 7% |
416 Properties |
| 1997 | £167,628 | 7% |
471 Properties |
| 1996 | £156,655 | -4% |
435 Properties |
| 1995 | £162,618 | - |
304 Properties |
Property Price per Property Type in Tadworth
Here you can find historic sold price data in order to help with your property search.
The average Property Paid Price for specific property types in the last three years are:
| Property Type | Average Sold Price | Sold Properties |
|---|---|---|
| Semi Detached House | £581,005.00 | 168 Semi Detached Houses |
| Detached House | £1,322,275.00 | 264 Detached Houses |
| Terraced House | £491,354.00 | 150 Terraced Houses |
| Flat | £350,762.00 | 189 Flats |

