
Houses for sale in Funtington, Rowlands Castle
House Prices in Funtington
Properties in Funtington have an average house price of £838k and had 7 Property Transactions within the last 3 years¹.
Funtington is an area in Rowlands Castle, Surrey with 90 households², where the most expensive property was sold for £1.25M.
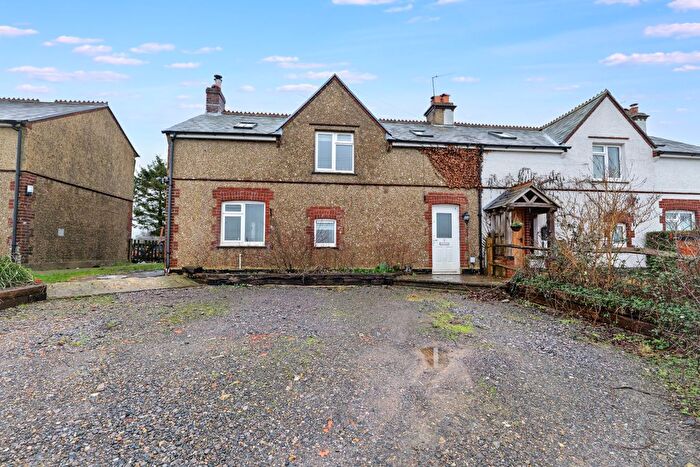
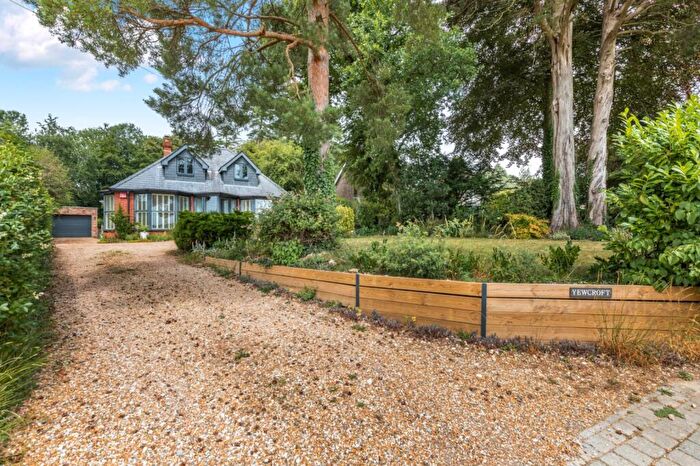
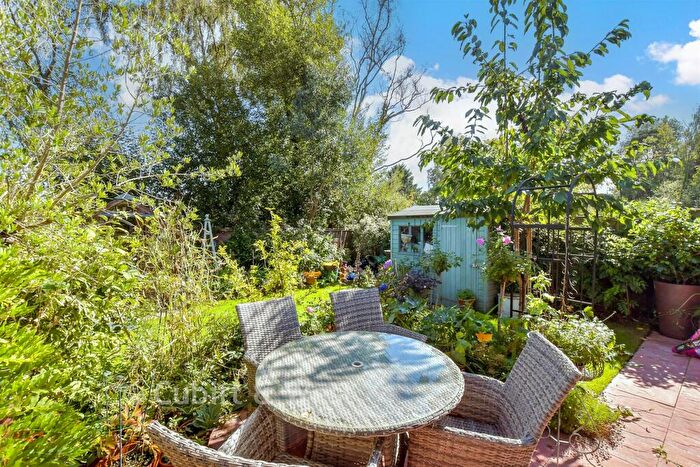
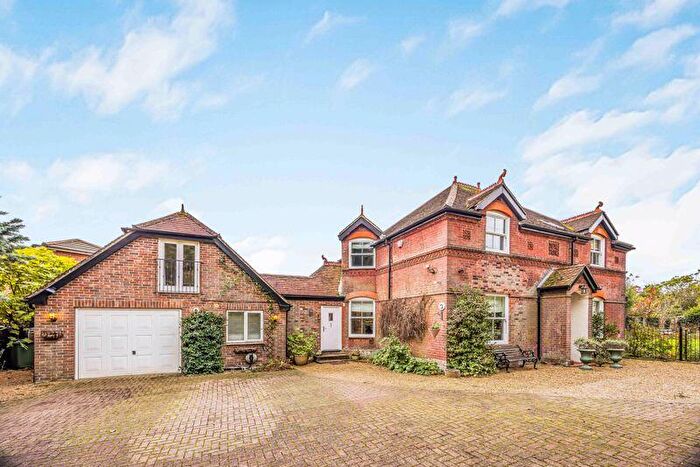
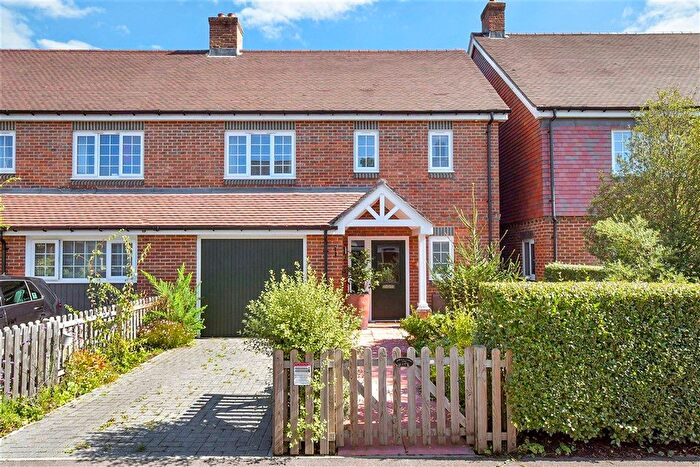
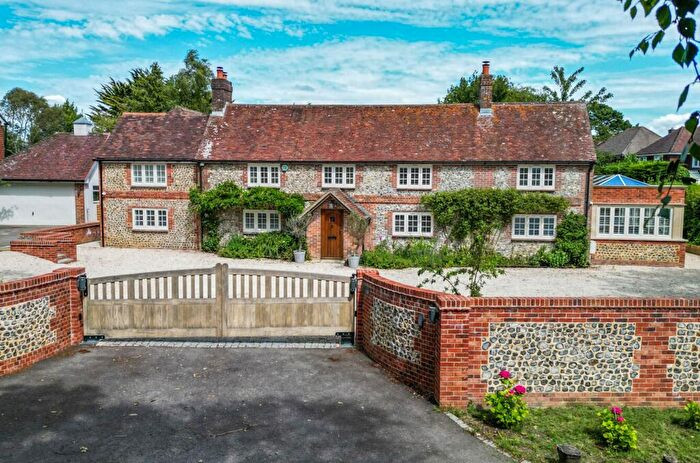
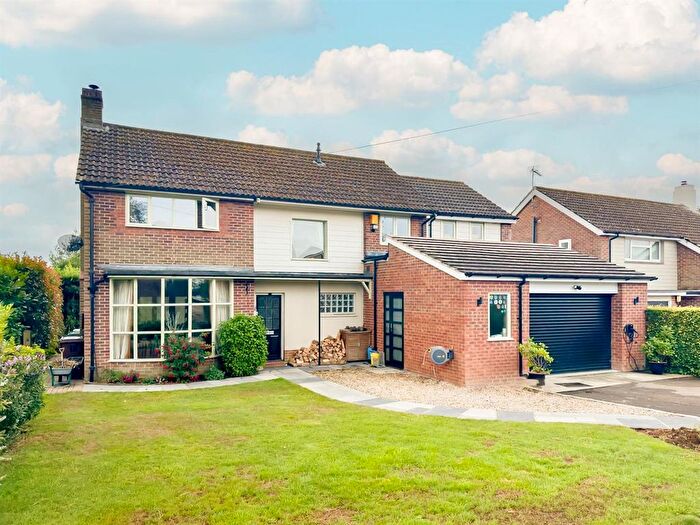
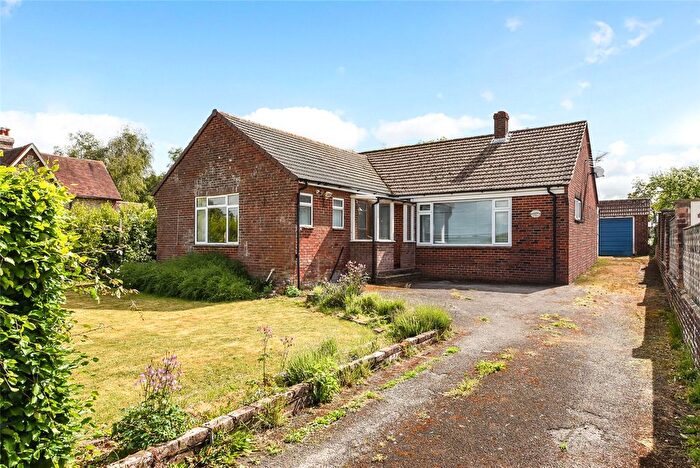
Properties for sale in Funtington
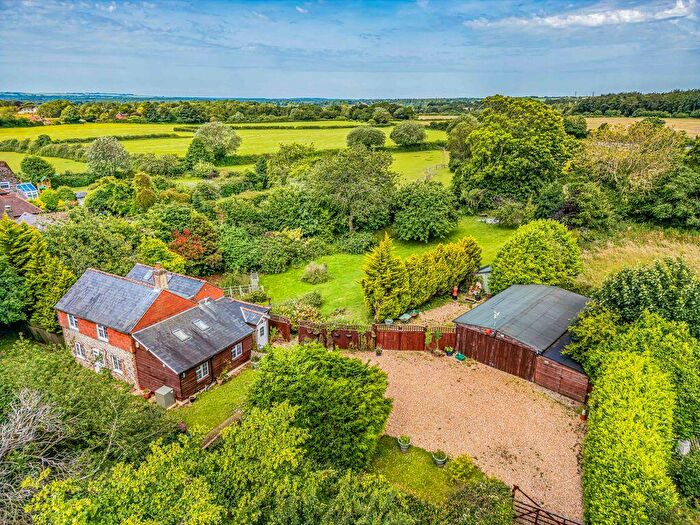
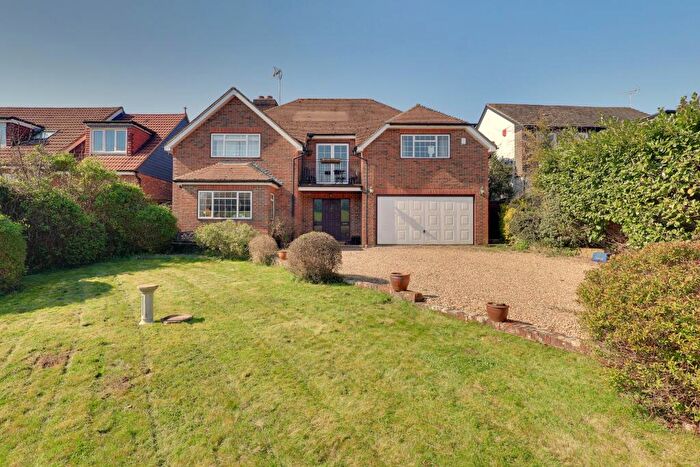
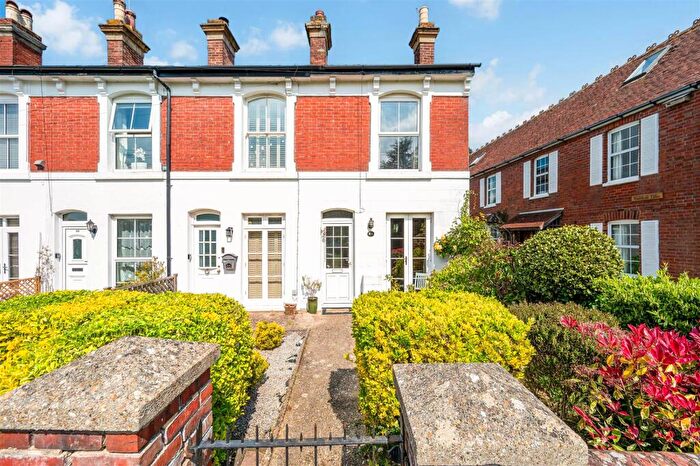
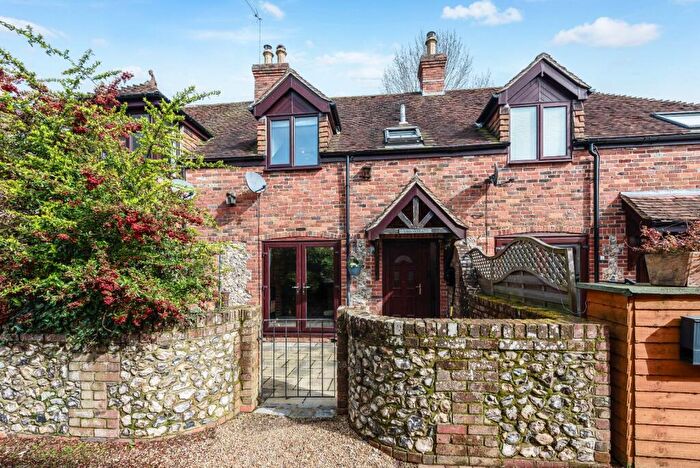
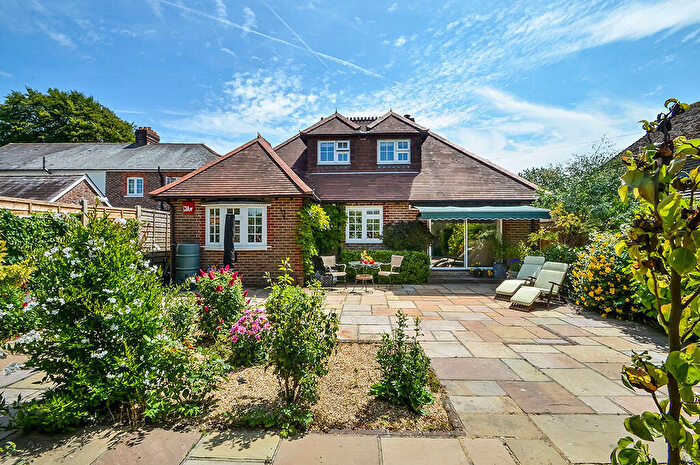
Previously listed properties in Funtington
![]()
If you are looking to sell your house, let it out, or receive a property valuation, an expert can help you.
Click the button below to get started.

Roads and Postcodes in Funtington
Navigate through our locations to find the location of your next house in Funtington, Rowlands Castle for sale or to rent.
| Streets | Postcodes |
|---|---|
| Dean Lane End | PO9 6EJ |
| Forestside | PO9 6EB PO9 6ED PO9 6EE PO9 6EH PO9 6EQ |
| Holme Farm Cottages | PO9 6DT |
| Woodberry Lane | PO9 6DP |
Property price trends in Funtington
According to the latest Land Registry data, the average home in Funtington sold for £794,166 in 2025. That figure comes from 114 sales logged over the past 30 years.
Prices have continued to climb over the last three years. Compared with 2022, when the typical sale came in around £580,000, that's a rise of roughly 36.9%.
Looking back five years, average prices are up about 0.2% since 2020, a gain of around £1,666 in cash terms.
Zoom out to the past decade for the fuller picture. Back in 2014, homes here averaged £420,833, so the typical sold price has climbed about 88.7% since then, roughly 5.9% a year. Stretch the view to fifteen years and that annual pace eases back to about 3.4%.
Frequently asked questions about Funtington
What is the average price for a property for sale in Funtington?
The average price for a property for sale in Funtington is £837,500. There are 201 property listings for sale in Funtington.
What streets have the most expensive properties for sale in Funtington?
The street with the most expensive properties for sale in Funtington is Forestside at an average of £1,026,000.
What streets have the most affordable properties for sale in Funtington?
The street with the most affordable properties for sale in Funtington is Dean Lane End at an average of £366,250.
Which train stations are available in or near Funtington?
Some of the train stations available in or near Funtington are Rowland's Castle, Emsworth and Warblington.
Property Price Paid in Funtington by Year
The average sold property price by year was:
| Year | Average Sold Price | Price Change |
Sold Properties
|
|---|---|---|---|
| 2025 | £794,166 | -31% |
3 Properties |
| 2024 | £1,040,833 | 66% |
3 Properties |
| 2023 | £357,500 | -62% |
1 Property |
| 2022 | £580,000 | -33% |
1 Property |
| 2021 | £773,124 | -3% |
7 Properties |
| 2020 | £792,500 | 41% |
4 Properties |
| 2019 | £470,600 | -40% |
4 Properties |
| 2018 | £660,200 | 14% |
5 Properties |
| 2017 | £566,666 | 3% |
3 Properties |
| 2016 | £548,750 | 23% |
2 Properties |
Property Price per Property Type in Funtington
Here you can find historic sold price data in order to help with your property search.
The average Property Paid Price for specific property types in the last three years are:
| Property Type | Average Sold Price | Sold Properties |
|---|---|---|
| Semi Detached House | £705,000.00 | 1 Semi Detached House |
| Terraced House | £366,250.00 | 2 Terraced Houses |
| Detached House | £1,106,250.00 | 4 Detached Houses |
