
Houses for sale & to rent in Sunbury Common, Sunbury-on-thames
House Prices in Sunbury Common
Properties in Sunbury Common have an average house price of £395k and had 297 Property Transactions within the last 3 years¹.
Sunbury Common is an area in Sunbury-on-thames, Surrey with 3,162 households², where the most expensive property was sold for £728k.
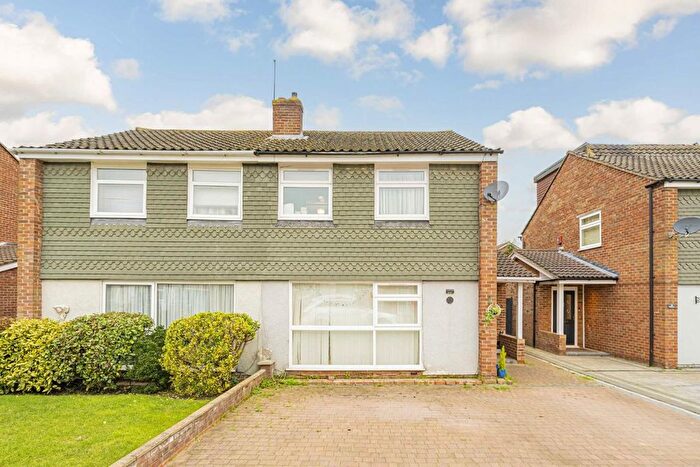
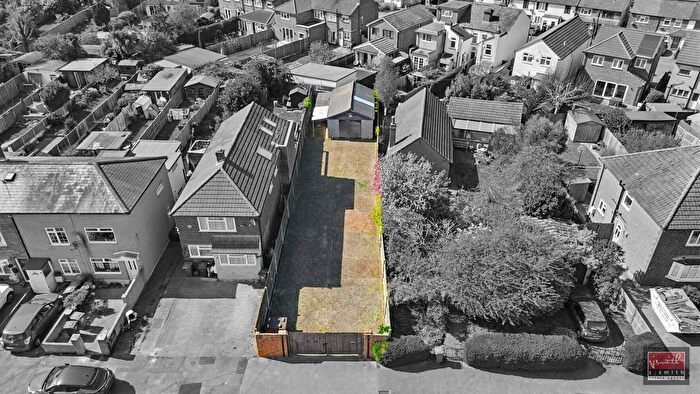
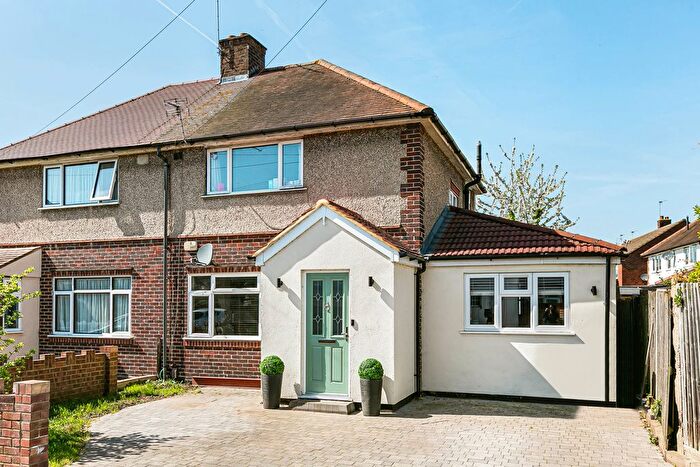
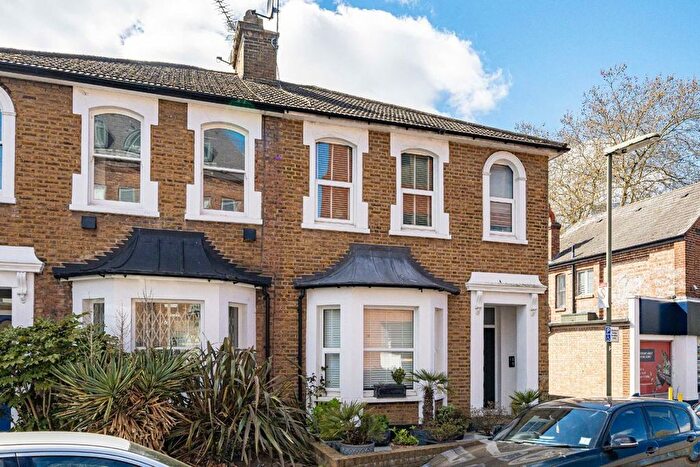
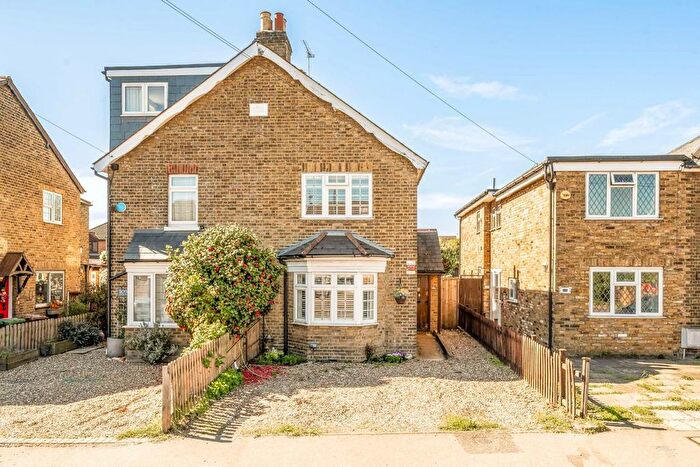
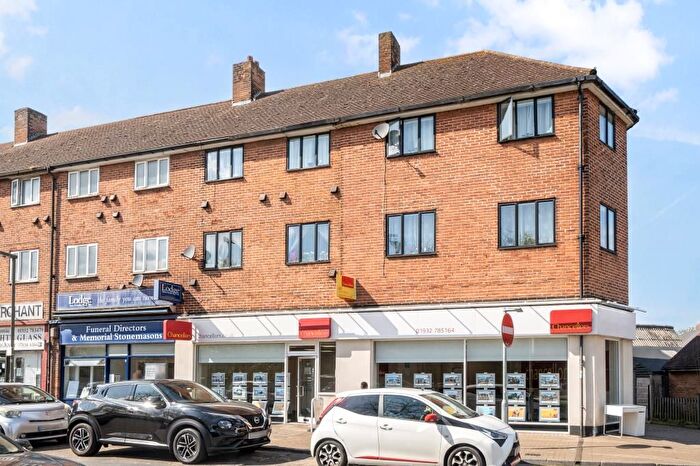
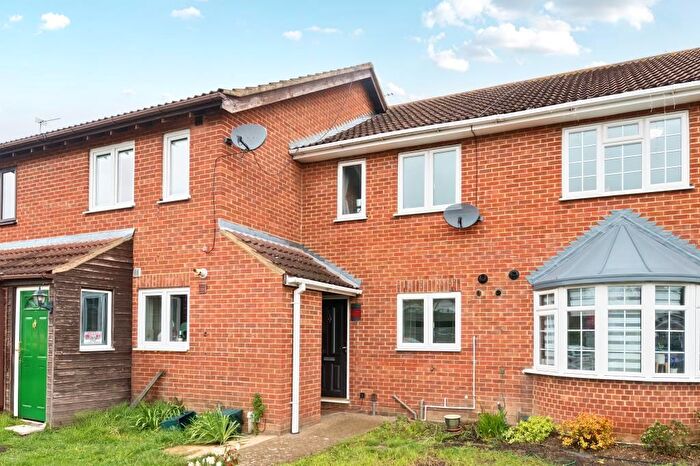
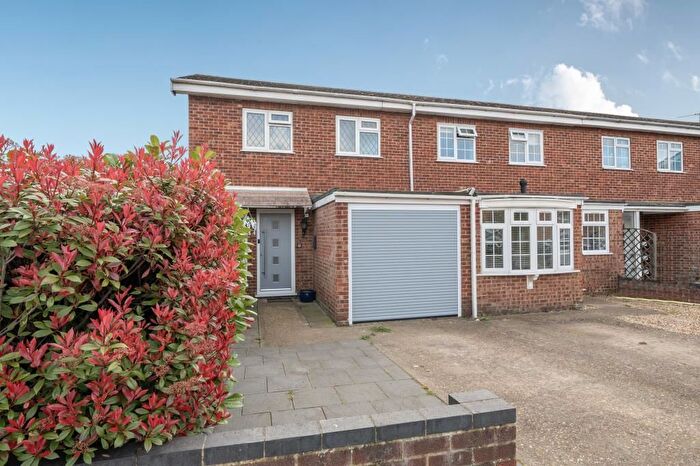
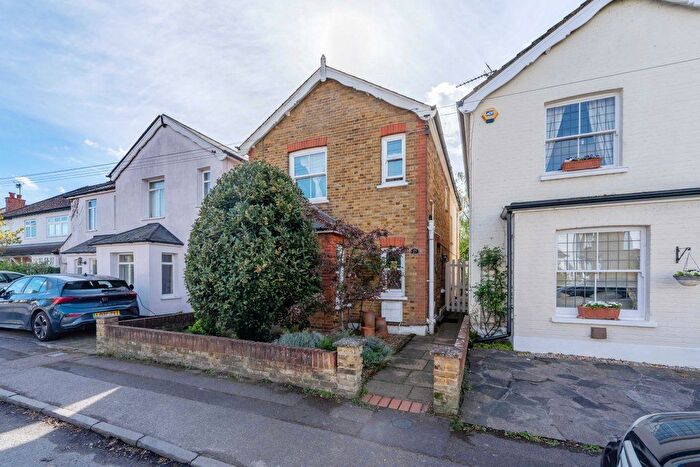
Properties for sale in Sunbury Common
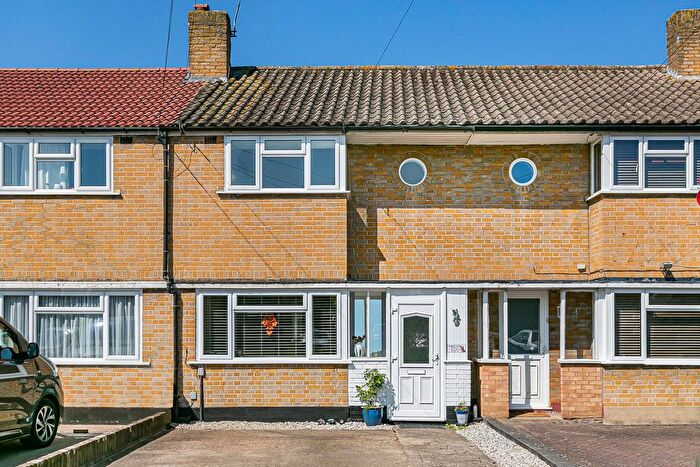
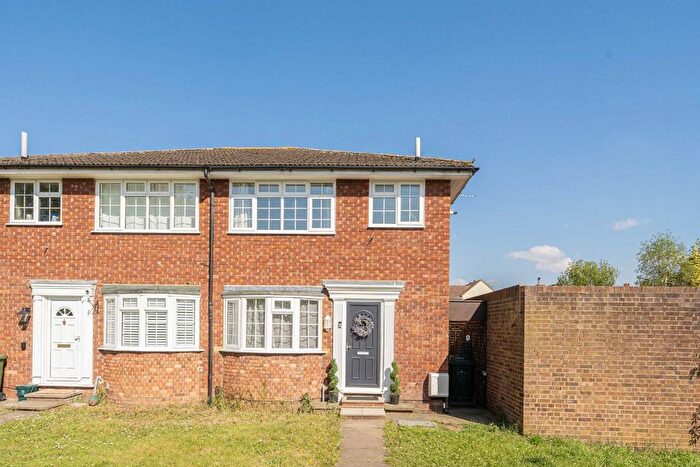

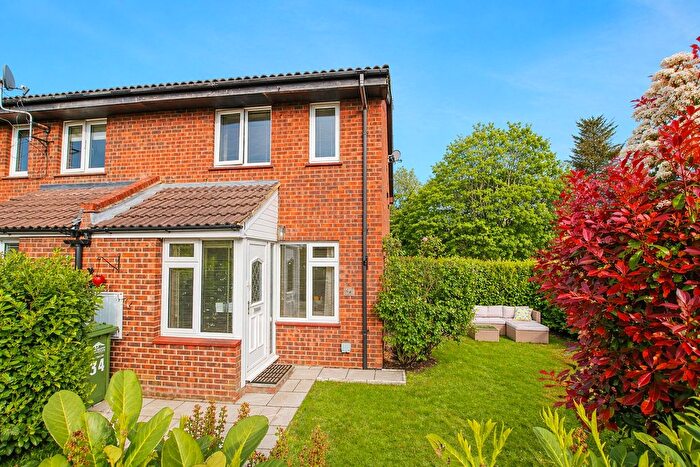
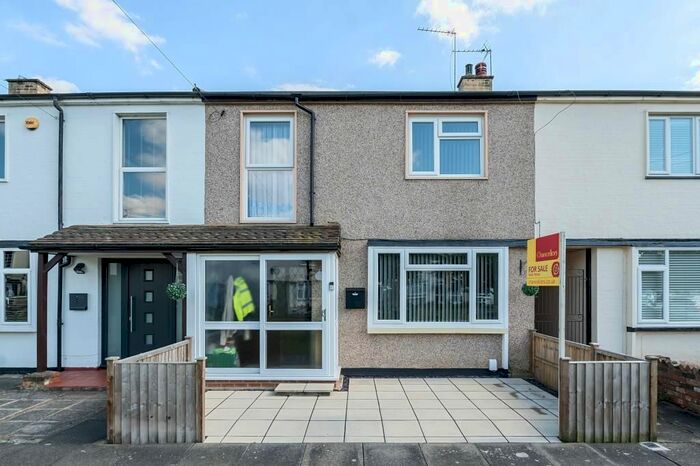
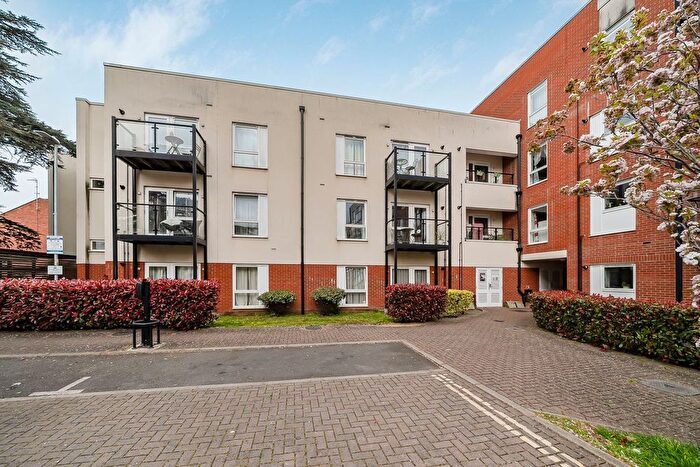
![]()
If you are looking to sell your house, let it out, or receive a property valuation, an expert can help you.
Click the button below to get started.
Roads and Postcodes in Sunbury Common
Navigate through our locations to find the location of your next house in Sunbury Common, Sunbury-on-thames for sale or to rent.
Transport near Sunbury Common
-
 Sunbury Station
 -
Kempton Park Station
-
Upper Halliford Station
-
Feltham Station
-
Shepperton Station
-
Ashford (Middlesex) Station
-
Hampton Station
-

 Heathrow Terminal 4 Station
- FAQ
- Price Paid By Year
- Property Type Price
Frequently asked questions about Sunbury Common
What is the average price for a property for sale in Sunbury Common?
The average price for a property for sale in Sunbury Common is £395,110. This amount is 24% lower than the average price in Sunbury-on-thames. There are 1,537 property listings for sale in Sunbury Common.
What streets have the most expensive properties for sale in Sunbury Common?
The streets with the most expensive properties for sale in Sunbury Common are Kings Avenue at an average of £627,500, Wychwood Close at an average of £590,000 and Cumbernauld Gardens at an average of £553,666.
What streets have the most affordable properties for sale in Sunbury Common?
The streets with the most affordable properties for sale in Sunbury Common are Shears Court at an average of £200,000, Staines Road West at an average of £243,718 and Fisk Close at an average of £264,000.
Which train stations are available in or near Sunbury Common?
Some of the train stations available in or near Sunbury Common are Sunbury, Kempton Park and Upper Halliford.
Which tube stations are available in or near Sunbury Common?
The tube station available in or near Sunbury Common is Heathrow Terminal 4.
Property Price Paid in Sunbury Common by Year
The average sold property price by year was:
| Year | Average Sold Price | Price Change |
Sold Properties
|
|---|---|---|---|
| 2026 | £351,333 | -15% |
6 Properties |
| 2025 | £402,528 | 5% |
97 Properties |
| 2024 | £383,343 | -5% |
106 Properties |
| 2023 | £404,092 | 7% |
88 Properties |
| 2022 | £375,250 | -5% |
103 Properties |
| 2021 | £394,944 | 7% |
138 Properties |
| 2020 | £367,079 | 10% |
87 Properties |
| 2019 | £329,831 | -4% |
117 Properties |
| 2018 | £344,533 | -3% |
108 Properties |
| 2017 | £354,307 | 7% |
133 Properties |
| 2016 | £329,773 | 10% |
149 Properties |
| 2015 | £298,120 | 8% |
153 Properties |
| 2014 | £273,523 | 12% |
149 Properties |
| 2013 | £241,715 | 1% |
117 Properties |
| 2012 | £240,268 | 2% |
79 Properties |
| 2011 | £236,609 | 2% |
94 Properties |
| 2010 | £232,720 | 4% |
75 Properties |
| 2009 | £224,280 | -4% |
70 Properties |
| 2008 | £232,417 | 0,1% |
75 Properties |
| 2007 | £232,137 | 13% |
215 Properties |
| 2006 | £201,424 | -1% |
183 Properties |
| 2005 | £203,167 | 6% |
120 Properties |
| 2004 | £191,564 | 4% |
178 Properties |
| 2003 | £184,071 | 8% |
186 Properties |
| 2002 | £169,986 | 14% |
206 Properties |
| 2001 | £146,751 | 15% |
207 Properties |
| 2000 | £124,218 | 15% |
162 Properties |
| 1999 | £105,624 | 9% |
175 Properties |
| 1998 | £96,573 | 18% |
171 Properties |
| 1997 | £79,305 | 5% |
160 Properties |
| 1996 | £75,271 | -6% |
143 Properties |
| 1995 | £79,849 | - |
115 Properties |
Property Price per Property Type in Sunbury Common
Here you can find historic sold price data in order to help with your property search.
The average Property Paid Price for specific property types in the last three years are:
| Property Type | Average Sold Price | Sold Properties |
|---|---|---|
| Flat | £234,748.00 | 87 Flats |
| Semi Detached House | £493,477.00 | 98 Semi Detached Houses |
| Detached House | £543,906.00 | 16 Detached Houses |
| Terraced House | £415,223.00 | 96 Terraced Houses |