
Houses for sale & to rent in Sunbury East, Sunbury-on-thames
House Prices in Sunbury East
Properties in Sunbury East have an average house price of £652k and had 349 Property Transactions within the last 3 years¹.
Sunbury East is an area in Sunbury-on-thames, Surrey with 2,821 households², where the most expensive property was sold for £2.9M.
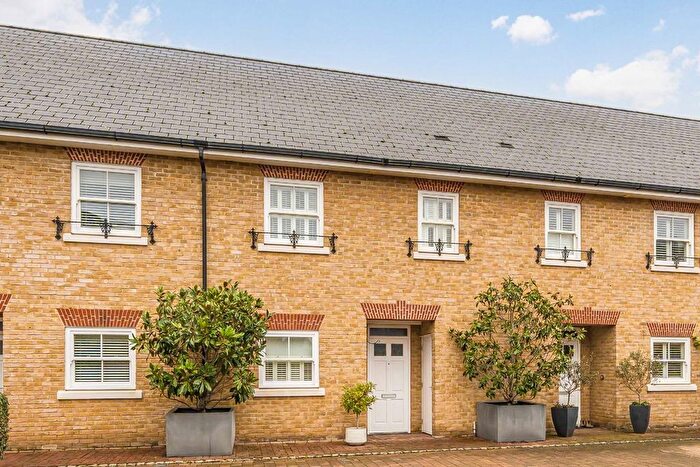
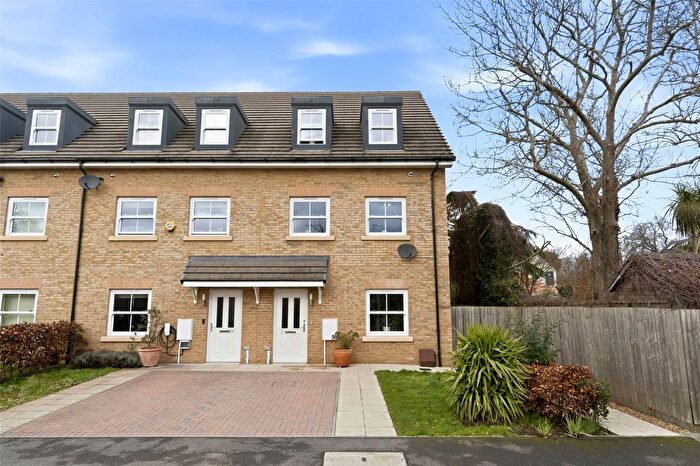
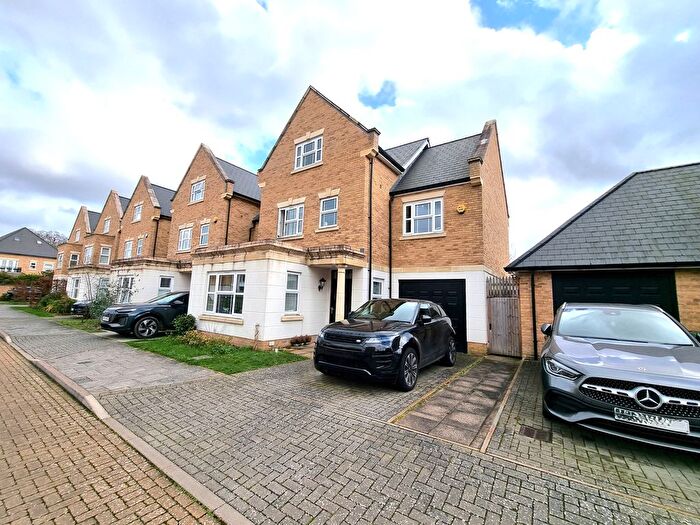
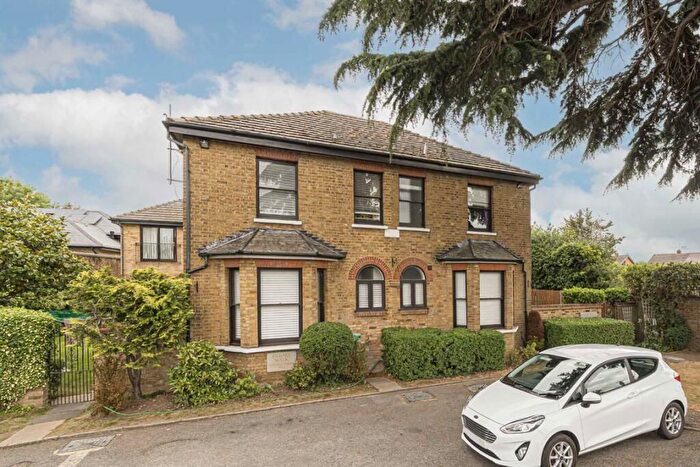
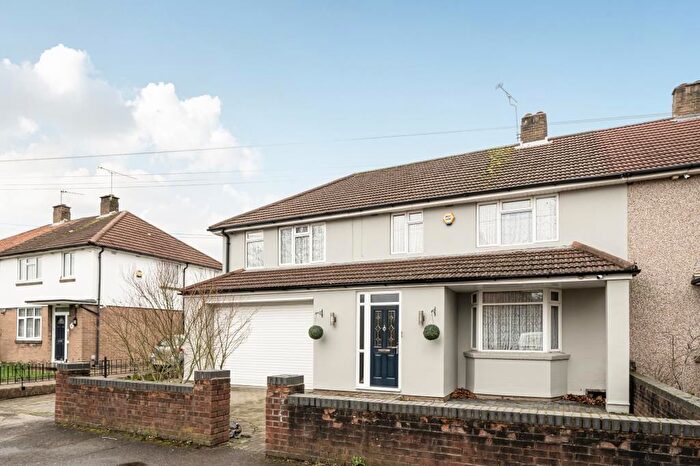
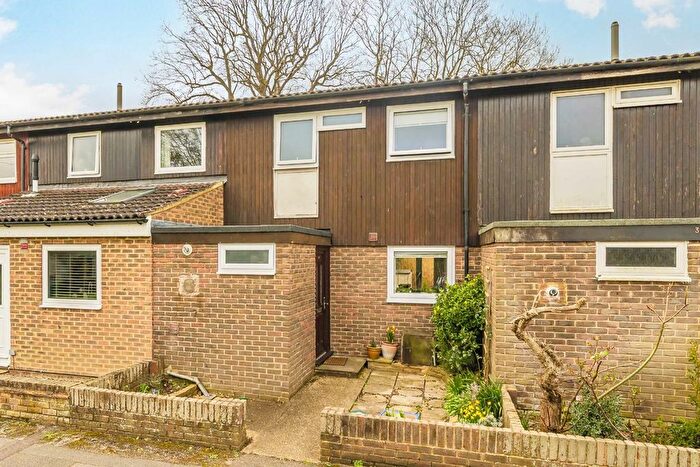
Properties for sale in Sunbury East
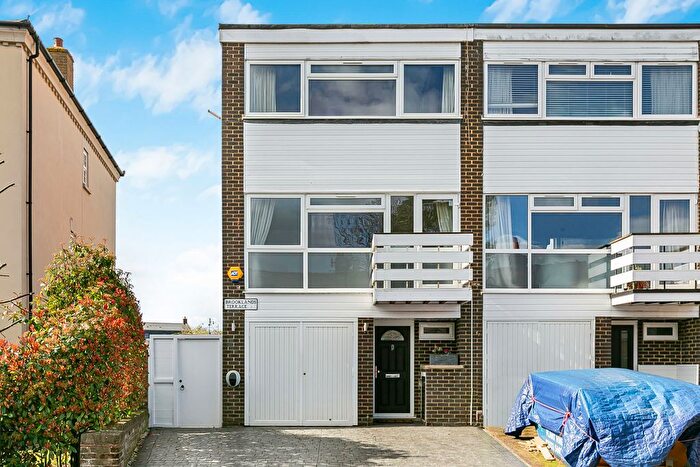

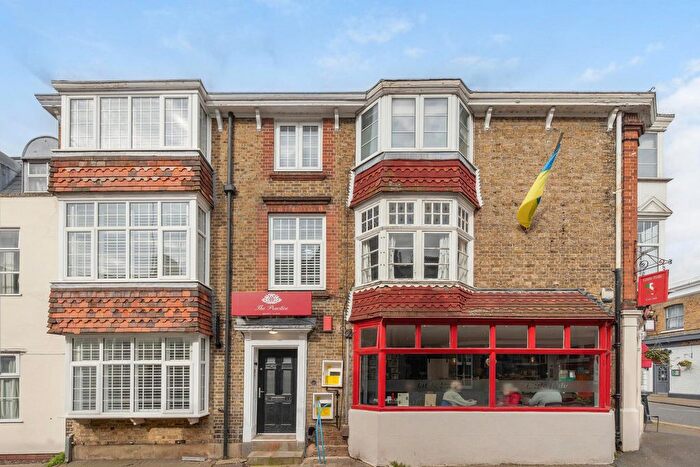
![]()
If you are looking to sell your house, let it out, or receive a property valuation, an expert can help you.
Click the button below to get started.
Roads and Postcodes in Sunbury East
Navigate through our locations to find the location of your next house in Sunbury East, Sunbury-on-thames for sale or to rent.
Transport near Sunbury East
-
 Sunbury Station
 -
Kempton Park Station
-
Upper Halliford Station
-
Hampton Station
-
Shepperton Station
-
Feltham Station
-
Hersham Station
-
Walton-On-Thames Station
-
Hampton Court Station
-
Fulwell Station
- FAQ
- Price Paid By Year
- Property Type Price
Frequently asked questions about Sunbury East
What is the average price for a property for sale in Sunbury East?
The average price for a property for sale in Sunbury East is £652,375. This amount is 24% higher than the average price in Sunbury-on-thames. There are 1,051 property listings for sale in Sunbury East.
What streets have the most expensive properties for sale in Sunbury East?
The streets with the most expensive properties for sale in Sunbury East are Darby Gardens at an average of £1,450,000, Lower Hampton Road at an average of £1,365,000 and Harfield Road at an average of £1,076,250.
What streets have the most affordable properties for sale in Sunbury East?
The streets with the most affordable properties for sale in Sunbury East are Heathlands Close at an average of £258,500, Sunbury Court Mews at an average of £260,000 and Benwell Court at an average of £264,000.
Which train stations are available in or near Sunbury East?
Some of the train stations available in or near Sunbury East are Sunbury, Kempton Park and Upper Halliford.
Property Price Paid in Sunbury East by Year
The average sold property price by year was:
| Year | Average Sold Price | Price Change |
Sold Properties
|
|---|---|---|---|
| 2025 | £670,546 | 5% |
106 Properties |
| 2024 | £638,068 | -2% |
129 Properties |
| 2023 | £651,669 | -2% |
114 Properties |
| 2022 | £662,334 | 8% |
139 Properties |
| 2021 | £610,958 | -2% |
170 Properties |
| 2020 | £620,680 | 9% |
99 Properties |
| 2019 | £563,766 | -5% |
115 Properties |
| 2018 | £594,044 | -5% |
139 Properties |
| 2017 | £620,860 | 8% |
140 Properties |
| 2016 | £571,729 | 16% |
206 Properties |
| 2015 | £478,375 | 3% |
112 Properties |
| 2014 | £462,401 | -0,5% |
119 Properties |
| 2013 | £464,657 | 16% |
127 Properties |
| 2012 | £388,662 | -5% |
102 Properties |
| 2011 | £408,777 | -6% |
94 Properties |
| 2010 | £432,361 | 18% |
109 Properties |
| 2009 | £353,623 | 1% |
107 Properties |
| 2008 | £348,627 | -6% |
75 Properties |
| 2007 | £369,966 | 6% |
214 Properties |
| 2006 | £347,762 | 12% |
204 Properties |
| 2005 | £305,949 | 7% |
122 Properties |
| 2004 | £285,184 | -7% |
138 Properties |
| 2003 | £306,527 | 16% |
117 Properties |
| 2002 | £256,696 | 4% |
202 Properties |
| 2001 | £247,571 | 12% |
162 Properties |
| 2000 | £218,329 | 25% |
137 Properties |
| 1999 | £164,535 | -3% |
142 Properties |
| 1998 | £170,252 | 15% |
118 Properties |
| 1997 | £144,302 | 17% |
119 Properties |
| 1996 | £120,288 | -7% |
156 Properties |
| 1995 | £128,815 | - |
107 Properties |
Property Price per Property Type in Sunbury East
Here you can find historic sold price data in order to help with your property search.
The average Property Paid Price for specific property types in the last three years are:
| Property Type | Average Sold Price | Sold Properties |
|---|---|---|
| Flat | £316,081.00 | 88 Flats |
| Semi Detached House | £664,192.00 | 73 Semi Detached Houses |
| Detached House | £928,340.00 | 126 Detached Houses |
| Terraced House | £554,950.00 | 62 Terraced Houses |