
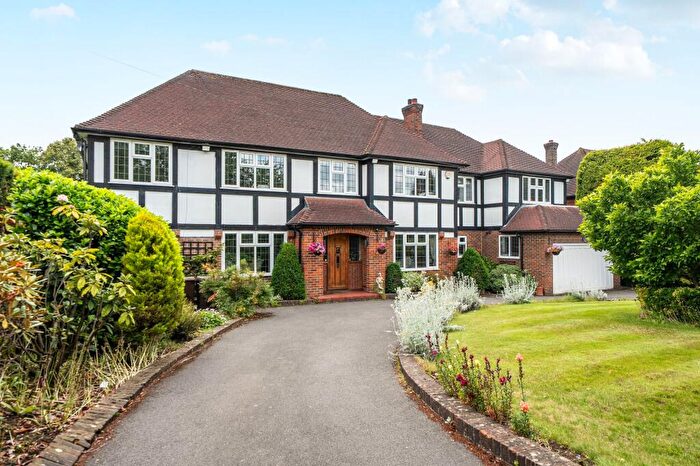
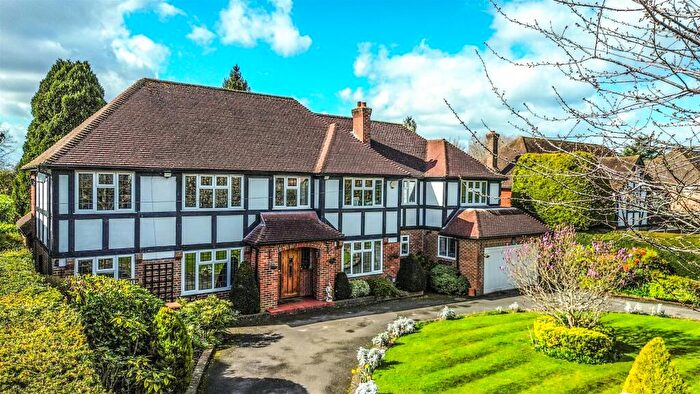
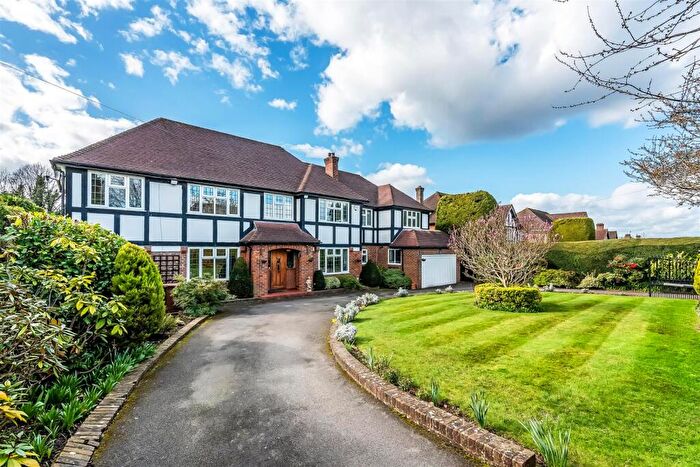
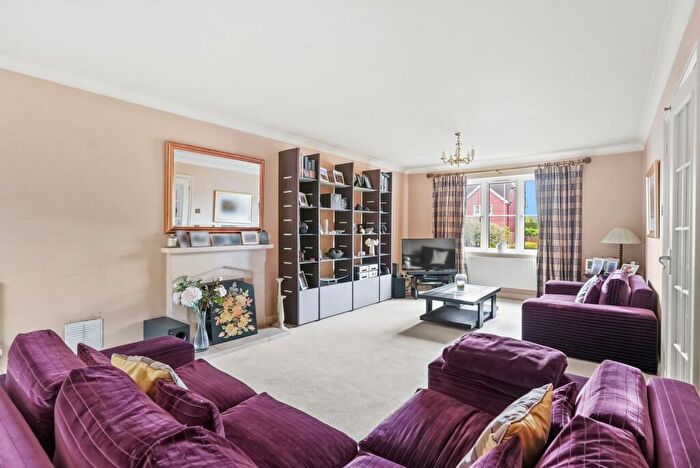
Houses for sale in Nonsuch, Sutton
House Prices in Nonsuch
Properties in Nonsuch have an average house price of £895k and had 48 Property Transactions within the last 3 years¹.
Nonsuch is an area in Sutton, Surrey with 729 households², where the most expensive property was sold for £1.25M.
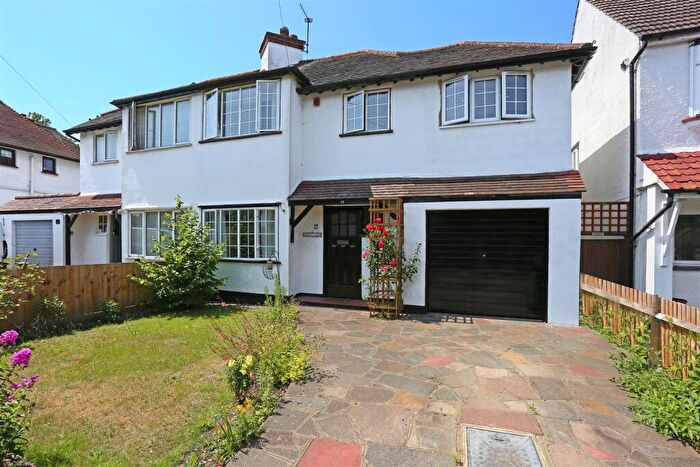
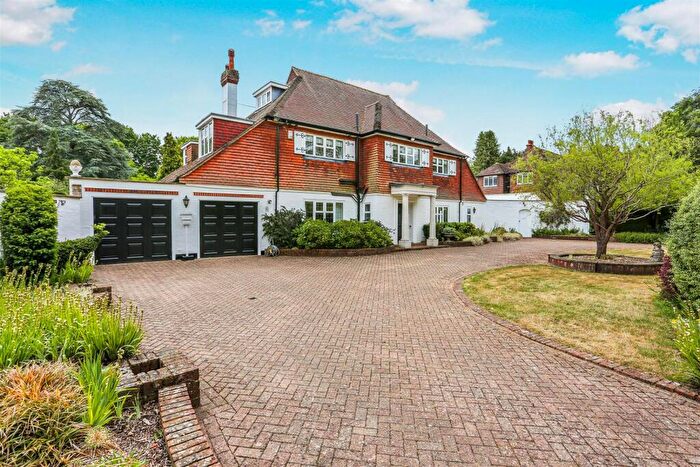
Properties for sale in Nonsuch
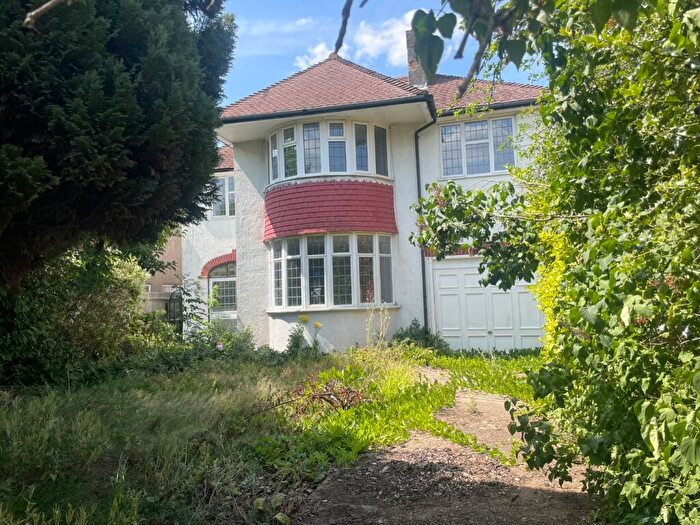
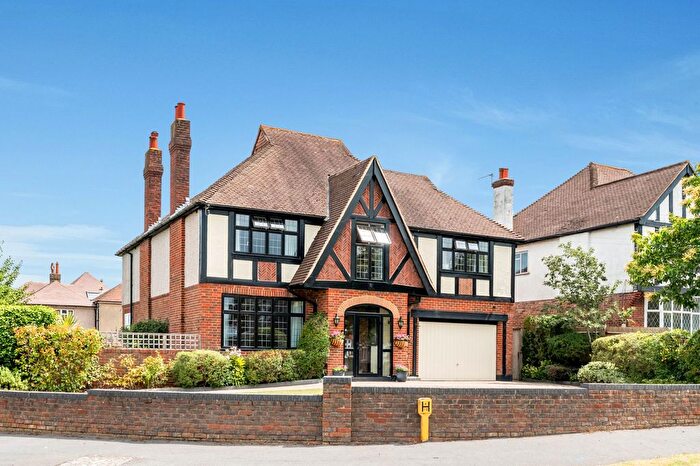
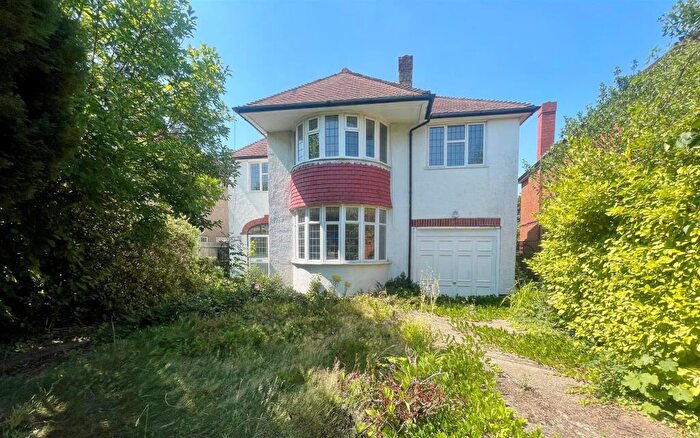

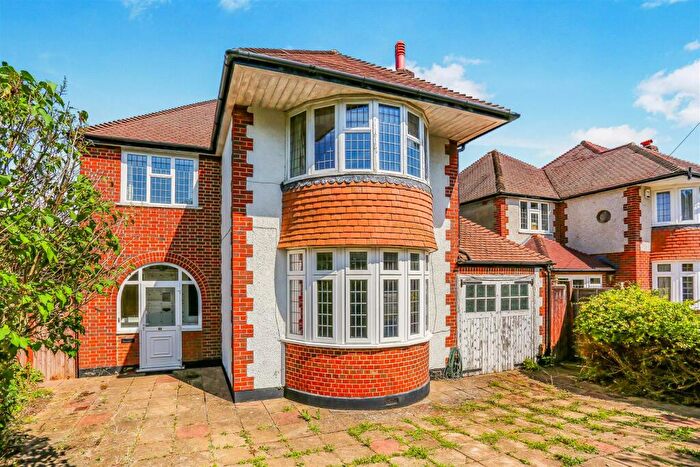
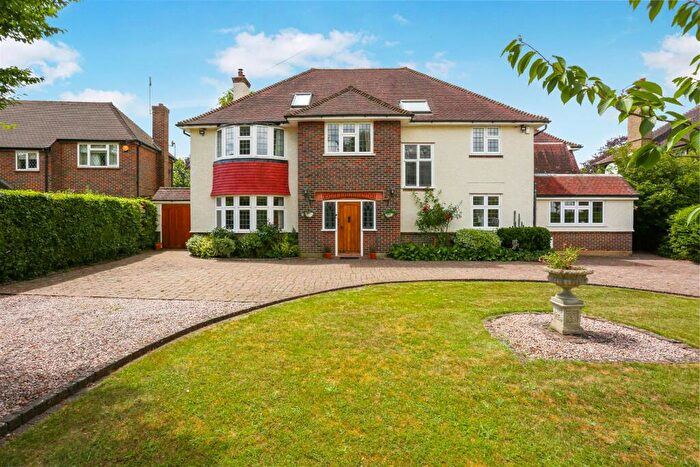
![]()
If you are looking to sell your house, let it out, or receive a property valuation, an expert can help you.
Click the button below to get started.
Roads and Postcodes in Nonsuch
Navigate through our locations to find the location of your next house in Nonsuch, Sutton for sale or to rent.
| Streets | Postcodes |
|---|---|
| Abinger Avenue | SM2 7LJ SM2 7LW |
| Albury Avenue | SM2 7JT SM2 7LB |
| Bramley Road | SM2 7LR SM2 7LS |
| Buckland Road | SM2 7LL SM2 7LP |
| Chanton Drive | SM2 7LH |
| Cheyham Gardens | SM2 7NH |
| Ewhurst Close | SM2 7LN |
| Gomshall Road | SM2 7JZ |
| Harefield Avenue | SM2 7ND SM2 7NE |
| Hays Walk | SM2 7NQ |
| Holmwood Close | SM2 7JL |
| Holmwood Road | SM2 7JP SM2 7JR SM2 7JS |
| Howell Hill | SM2 7LQ |
| Merrow Road | SM2 7LU |
| Nonsuch Walk | SM2 7LF SM2 7LG SM2 7NG |
| Northey Avenue | SM2 7HJ SM2 7HR SM2 7HS SM2 7HU |
| Ranmore Road | SM2 7LT |
| Rugby Lane | SM2 7NF |
| Shere Avenue | SM2 7JU SM2 7JX |
| Westcott Way | SM2 7JY |
| Wonersh Way | SM2 7LX |
| Wotton Way | SM2 7LA |
Property price trends in Nonsuch
According to the latest Land Registry data, the average home in Nonsuch sold for £924,470 in 2025. That figure comes from 762 sales logged over the past 30 years.
Prices have softened over the last three years. Compared with 2022, when the typical sale came in around £940,677, that's a fall of roughly 1.7%.
Looking back five years, average prices are up about 24.4% since 2020, a gain of around £181,097 in cash terms.
Zoom out to the past decade for the fuller picture. Back in 2015, homes here averaged £731,250, so the typical sold price has climbed about 26.4% since then, roughly 2.4% a year. Stretch the view to fifteen years and that annual pace edges up closer to 3.5%.
Frequently asked questions about Nonsuch
What is the average price for a property for sale in Nonsuch?
The average price for a property for sale in Nonsuch is £894,995. There are 734 property listings for sale in Nonsuch.
What streets have the most expensive properties for sale in Nonsuch?
The streets with the most expensive properties for sale in Nonsuch are Wotton Way at an average of £1,250,000, Gomshall Road at an average of £1,155,000 and Harefield Avenue at an average of £1,155,000.
What streets have the most affordable properties for sale in Nonsuch?
The streets with the most affordable properties for sale in Nonsuch are Howell Hill at an average of £466,400, Holmwood Close at an average of £590,000 and Cheyham Gardens at an average of £725,000.
Which train stations are available in or near Nonsuch?
Some of the train stations available in or near Nonsuch are Ewell East, Cheam and Belmont.
Property Price Paid in Nonsuch by Year
The average sold property price by year was:
| Year | Average Sold Price | Price Change |
Sold Properties
|
|---|---|---|---|
| 2025 | £924,470 | -2% |
17 Properties |
| 2024 | £943,919 | 13% |
15 Properties |
| 2023 | £817,812 | -15% |
16 Properties |
| 2022 | £940,677 | 2% |
31 Properties |
| 2021 | £919,830 | 19% |
28 Properties |
| 2020 | £743,373 | -8% |
15 Properties |
| 2019 | £804,080 | 2% |
31 Properties |
| 2018 | £785,611 | 6% |
18 Properties |
| 2017 | £739,670 | -6% |
25 Properties |
| 2016 | £783,542 | 7% |
21 Properties |
Property Price per Property Type in Nonsuch
Here you can find historic sold price data in order to help with your property search.
The average Property Paid Price for specific property types in the last three years are:
| Property Type | Average Sold Price | Sold Properties |
|---|---|---|
| Terraced House | £590,000.00 | 1 Terraced House |
| Flat | £466,400.00 | 5 Flats |
| Detached House | £953,280.00 | 42 Detached Houses |
