
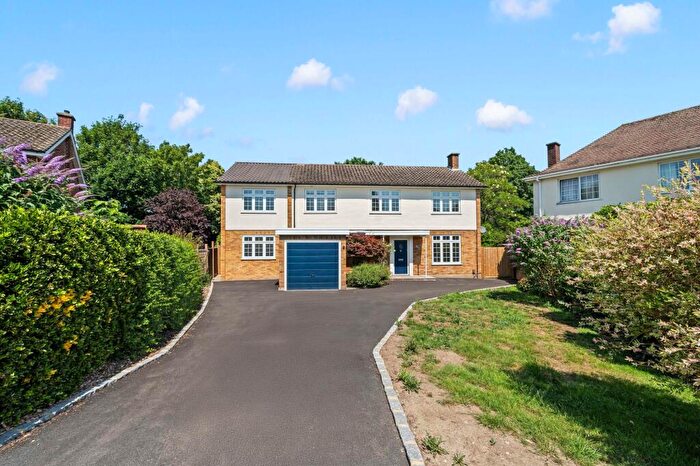
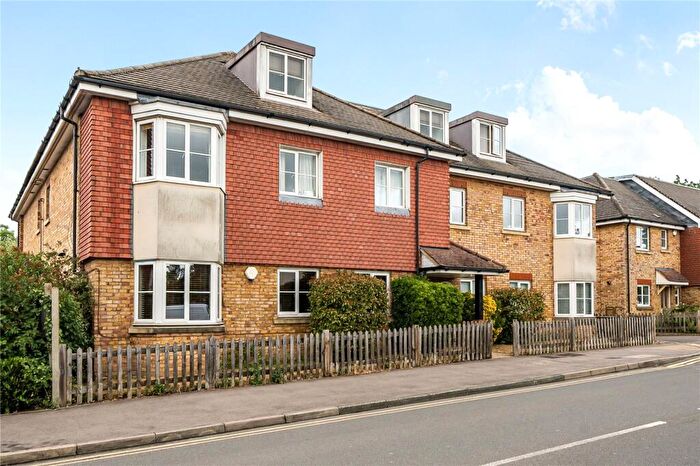
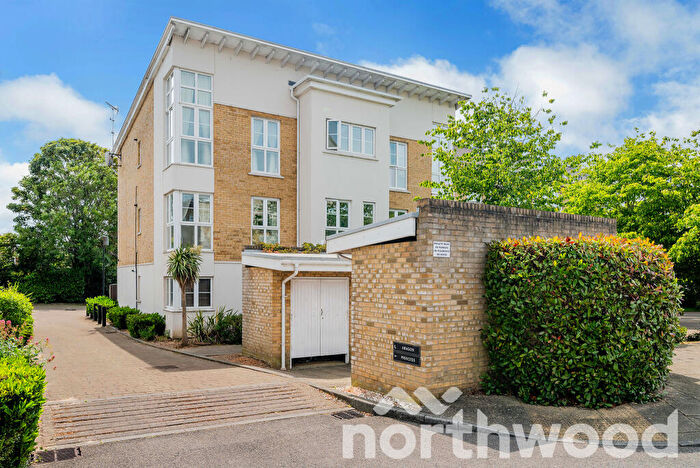
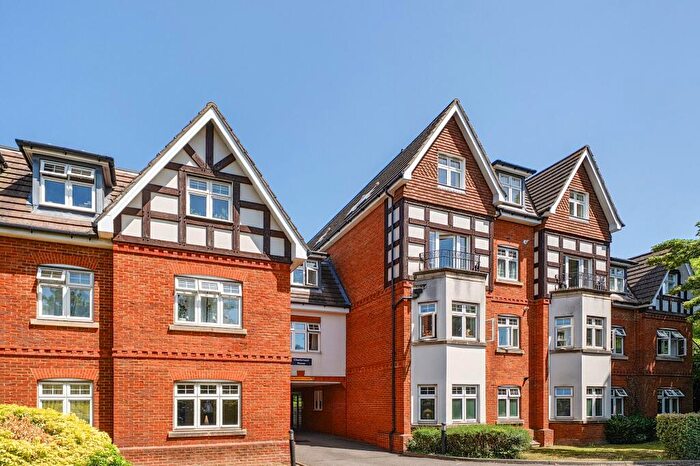
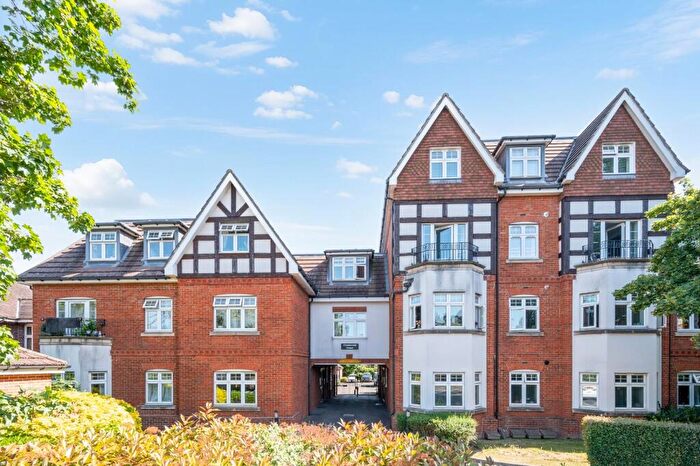
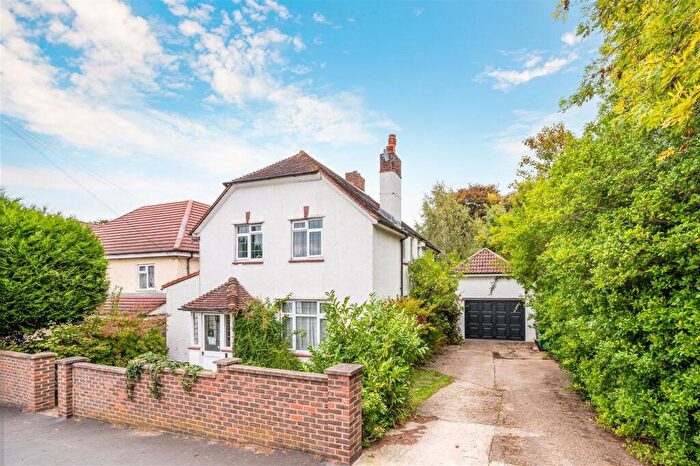
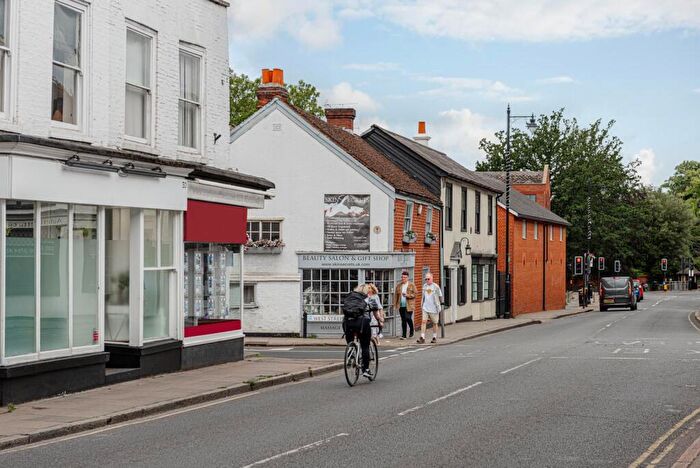
Houses for sale in Ewell, Epsom
House Prices in Ewell
Properties in Ewell have an average house price of £509k and had 306 Property Transactions within the last 3 years¹.
Ewell is an area in Epsom, Surrey with 2,536 households², where the most expensive property was sold for £1.96M.
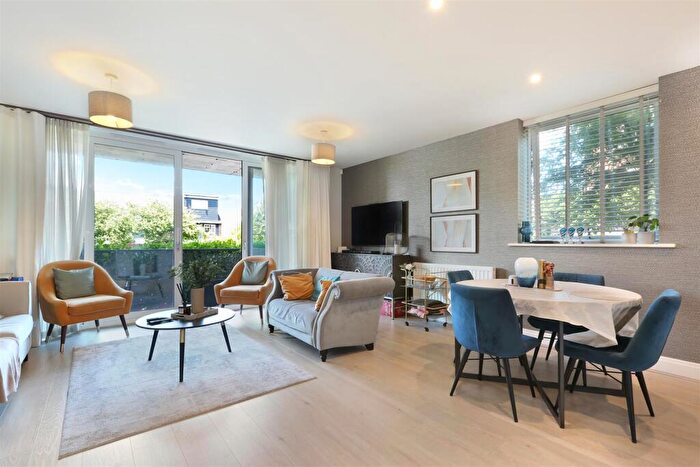
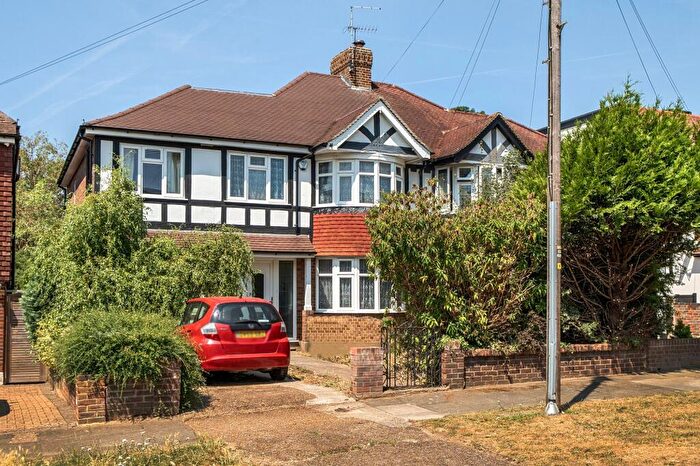
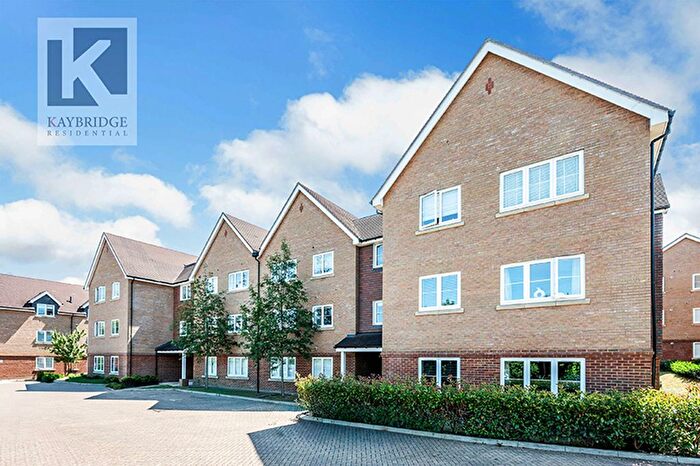
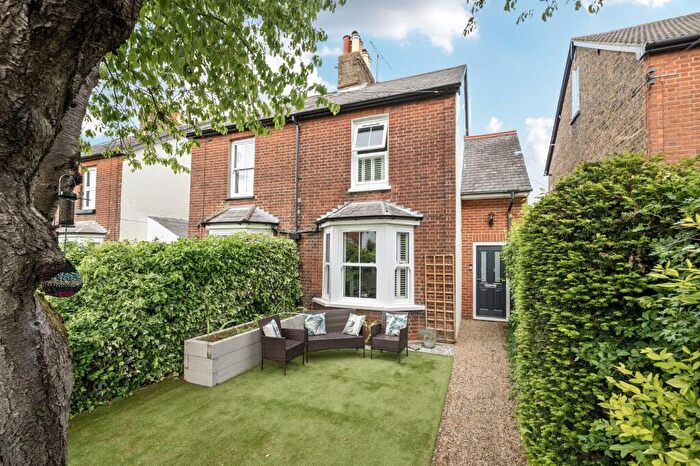
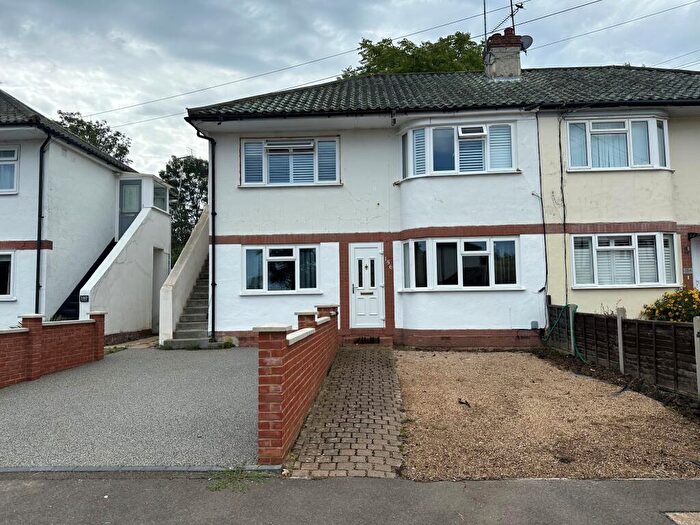
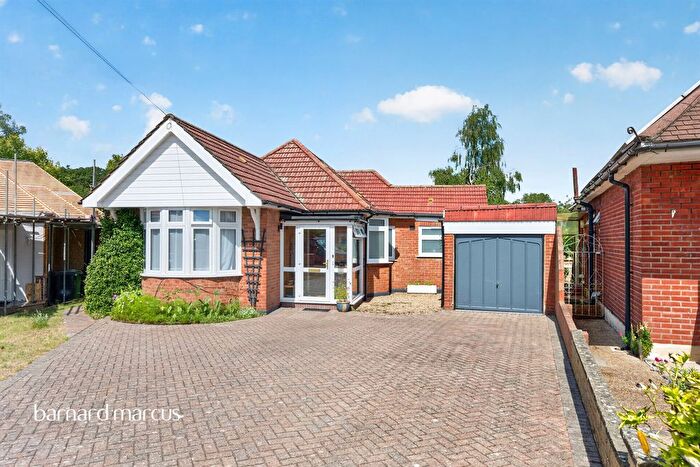
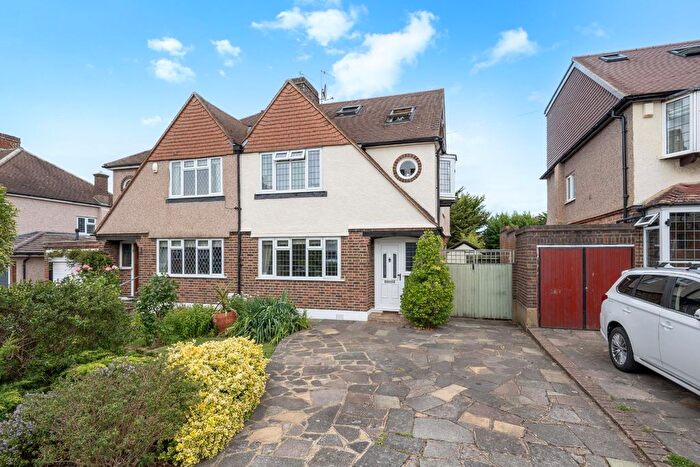
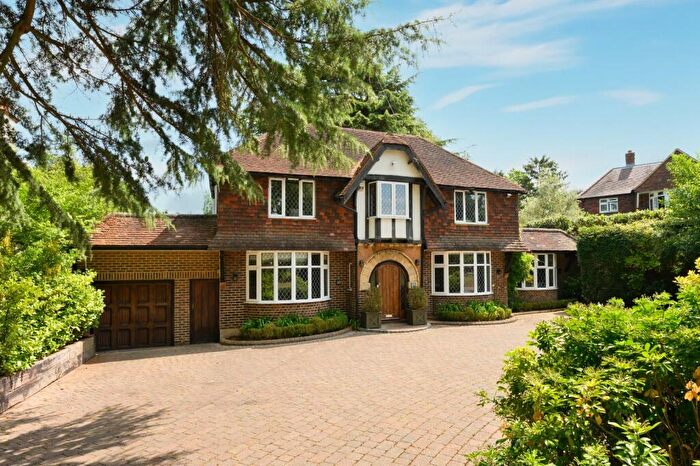
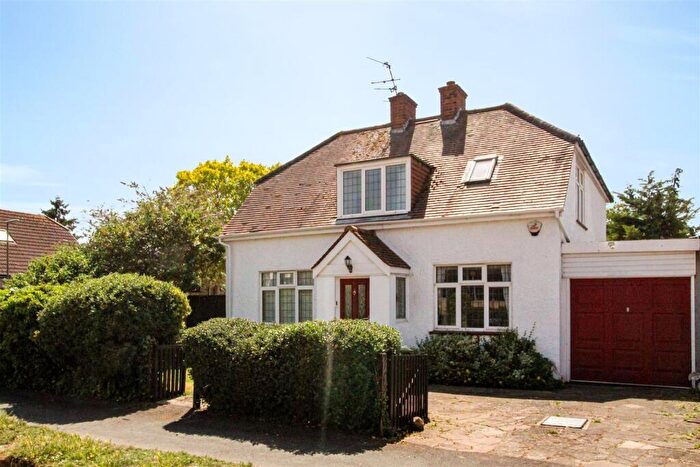
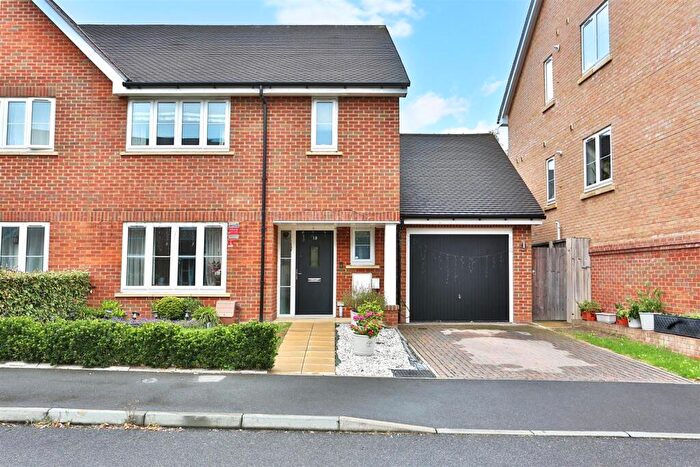
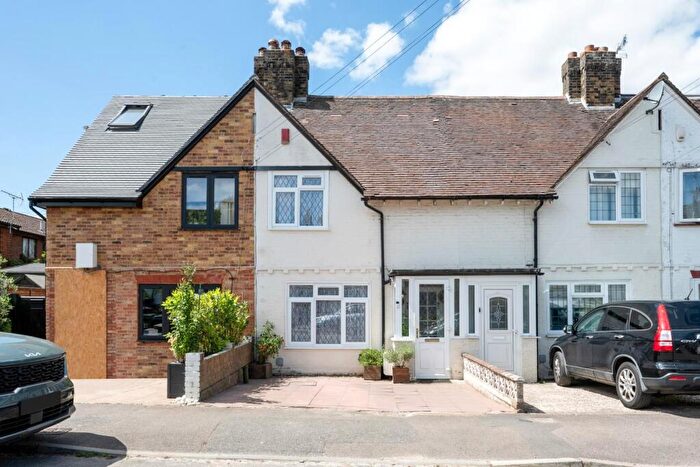
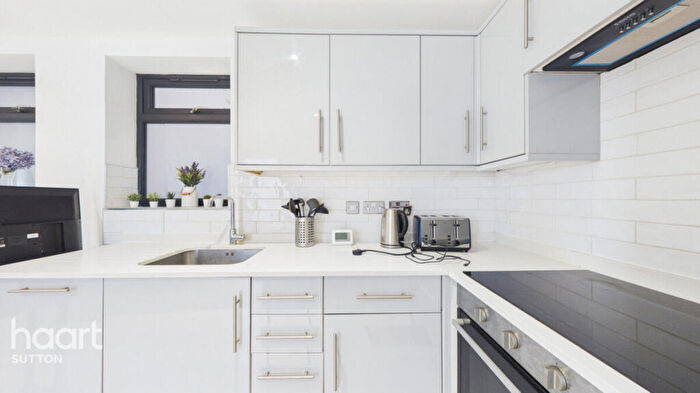
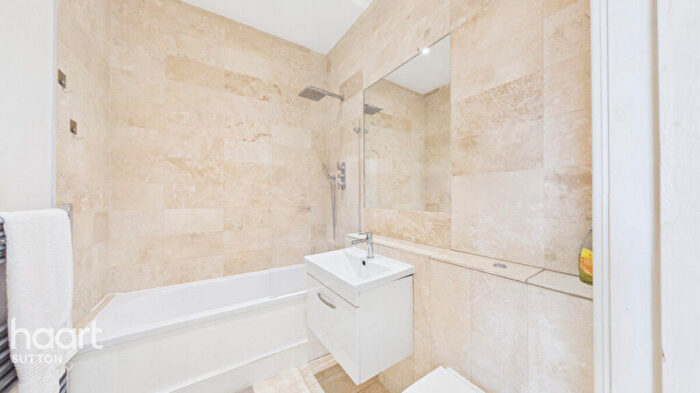
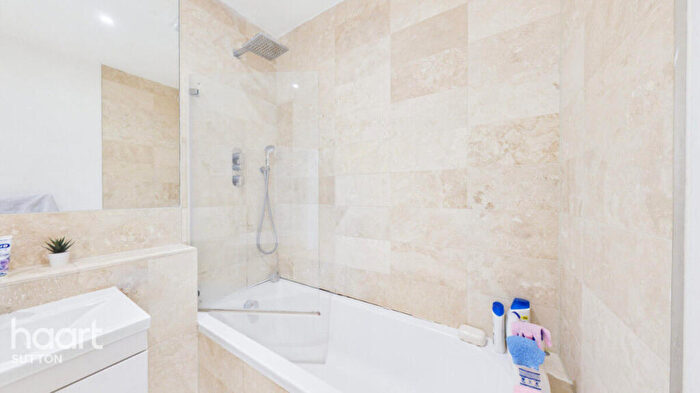
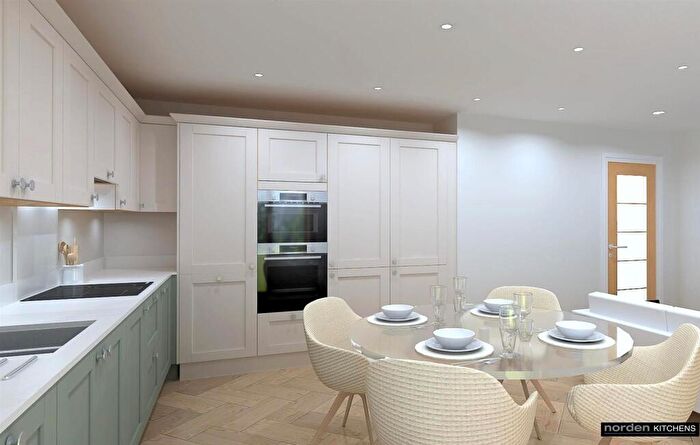
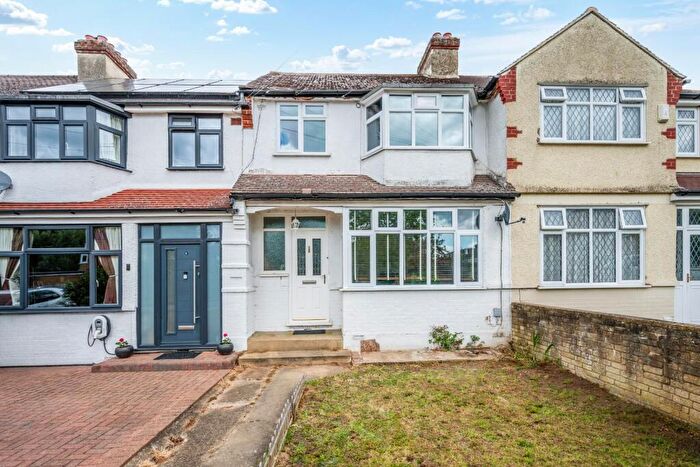
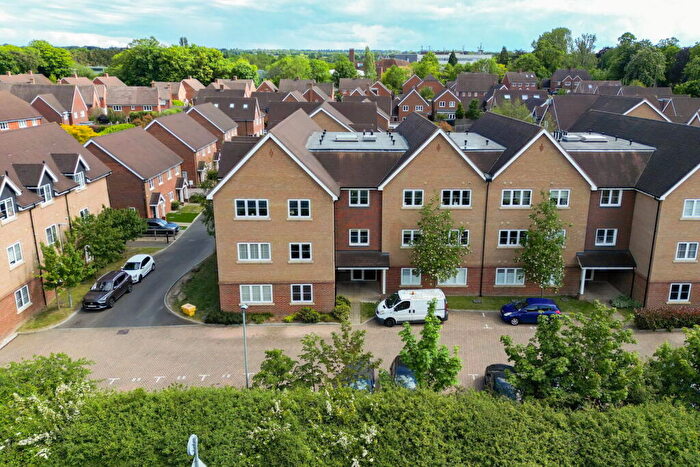
Properties for sale in Ewell
![]()
If you are looking to sell your house, let it out, or receive a property valuation, an expert can help you.
Click the button below to get started.
Roads and Postcodes in Ewell
Navigate through our locations to find the location of your next house in Ewell, Epsom for sale or to rent.
Property price trends in Ewell
According to the latest Land Registry data, the average home in Ewell sold for £631,250 in 2026. That figure comes from 4,116 sales logged over the past 31 years.
Prices have continued to climb over the last three years. Compared with 2023, when the typical sale came in around £523,527, that's a rise of roughly 20.6%.
Looking back five years, average prices are up about 30.2% since 2021, a gain of around £146,233 in cash terms.
Zoom out to the past decade for the fuller picture. Back in 2016, homes here averaged £465,526, so the typical sold price has climbed about 35.6% since then, roughly 3.1% a year. Stretch the view to fifteen years and that annual pace edges up closer to 4.8%.
Frequently asked questions about Ewell
What is the average price for a property for sale in Ewell?
The average price for a property for sale in Ewell is £508,595. This amount is 12% lower than the average price in Epsom. There are 1,589 property listings for sale in Ewell.
What streets have the most expensive properties for sale in Ewell?
The streets with the most expensive properties for sale in Ewell are The Headway at an average of £1,537,295, London Road at an average of £1,330,000 and Old House Close at an average of £1,020,000.
What streets have the most affordable properties for sale in Ewell?
The streets with the most affordable properties for sale in Ewell are Park Hill Road at an average of £163,812, Firle Court at an average of £246,400 and Village Gardens at an average of £250,990.
Which train stations are available in or near Ewell?
Some of the train stations available in or near Ewell are Ewell West, Ewell East and Stoneleigh.
Property Price Paid in Ewell by Year
The average sold property price by year was:
| Year | Average Sold Price | Price Change |
Sold Properties
|
|---|---|---|---|
| 2026 | £631,250 | 25% |
4 Properties |
| 2025 | £473,183 | -10% |
94 Properties |
| 2024 | £520,679 | -1% |
94 Properties |
| 2023 | £523,527 | 4% |
114 Properties |
| 2022 | £502,228 | 3% |
120 Properties |
| 2021 | £485,017 | 6% |
169 Properties |
| 2020 | £456,532 | -4% |
110 Properties |
| 2019 | £473,641 | 2% |
104 Properties |
| 2018 | £462,093 | -8% |
101 Properties |
| 2017 | £499,373 | 7% |
110 Properties |
Property Price per Property Type in Ewell
Here you can find historic sold price data in order to help with your property search.
The average Property Paid Price for specific property types in the last three years are:
| Property Type | Average Sold Price | Sold Properties |
|---|---|---|
| Flat | £305,412.00 | 124 Flats |
| Semi Detached House | £592,346.00 | 55 Semi Detached Houses |
| Detached House | £876,229.00 | 65 Detached Houses |
| Terraced House | £455,243.00 | 62 Terraced Houses |
