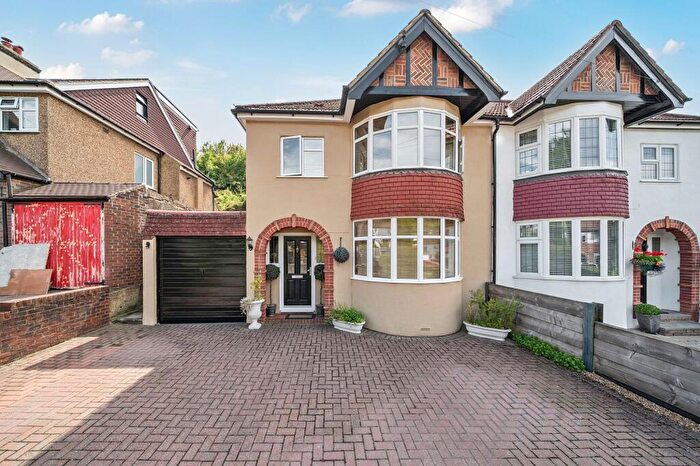
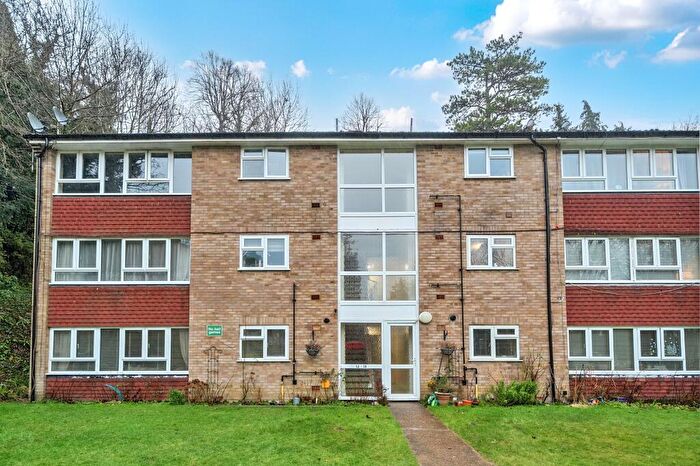
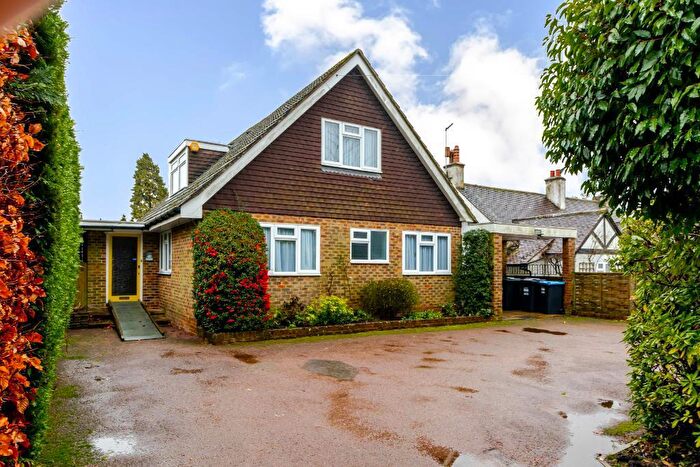
Houses for sale & to rent in Warlingham West, Warlingham
House Prices in Warlingham West
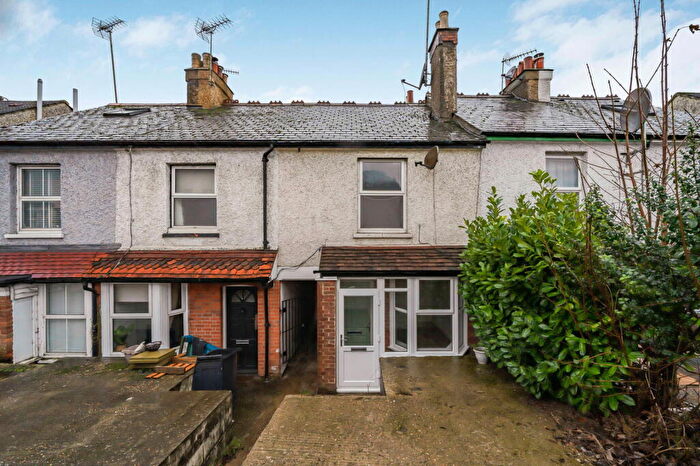
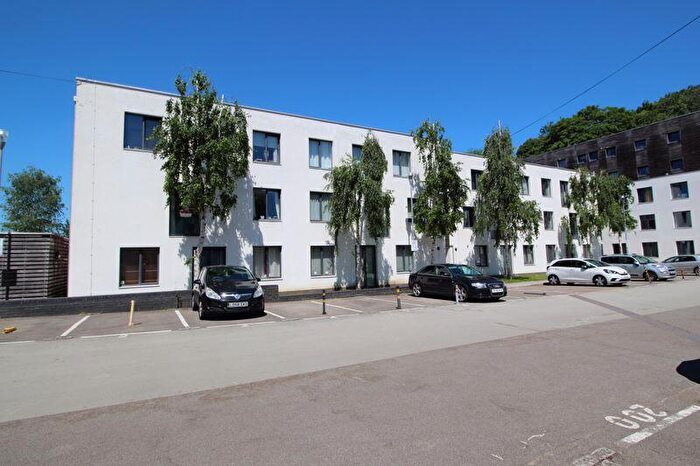
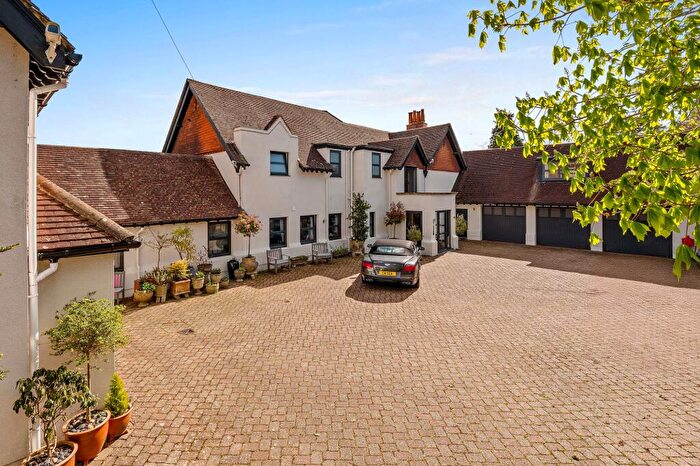
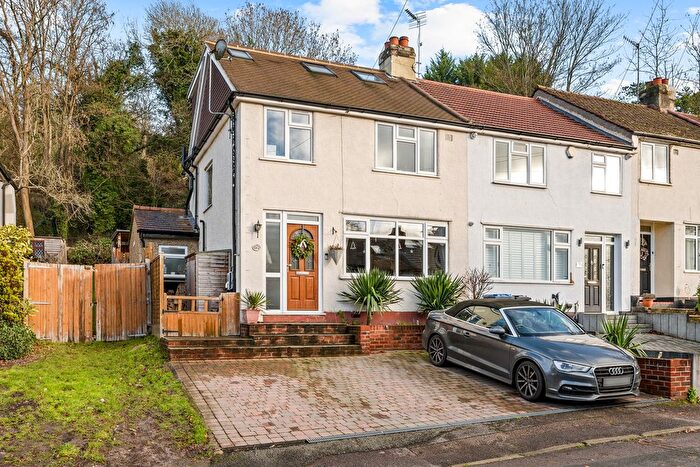
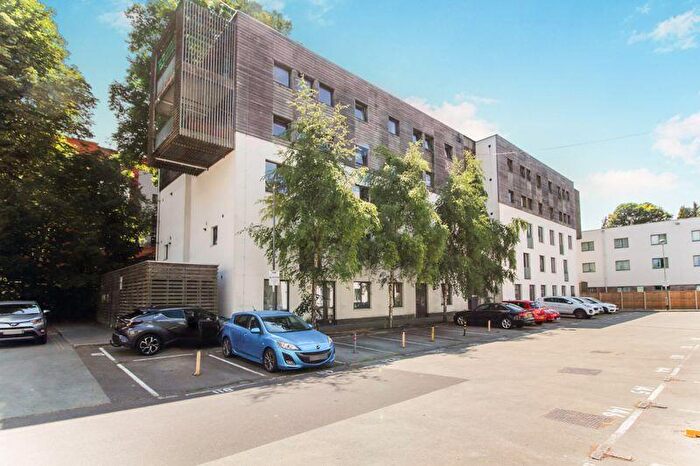
Properties in Warlingham West have an average house price of £683,315.00 and had 133 Property Transactions within the last 3 years¹.
Warlingham West is an area in Warlingham, Surrey with 1,386 households², where the most expensive property was sold for £2,524,000.00.
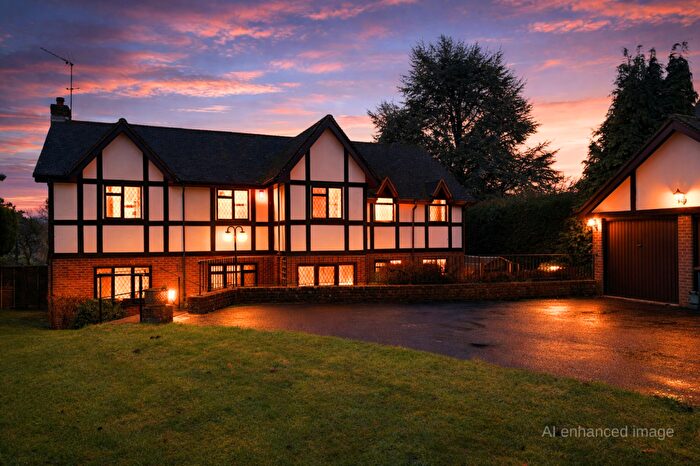
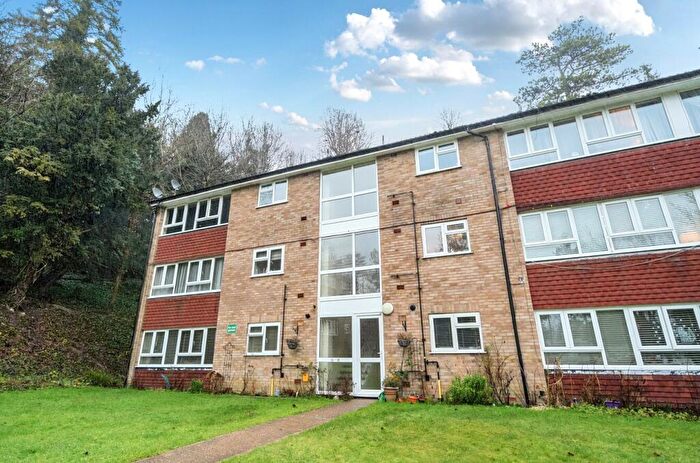
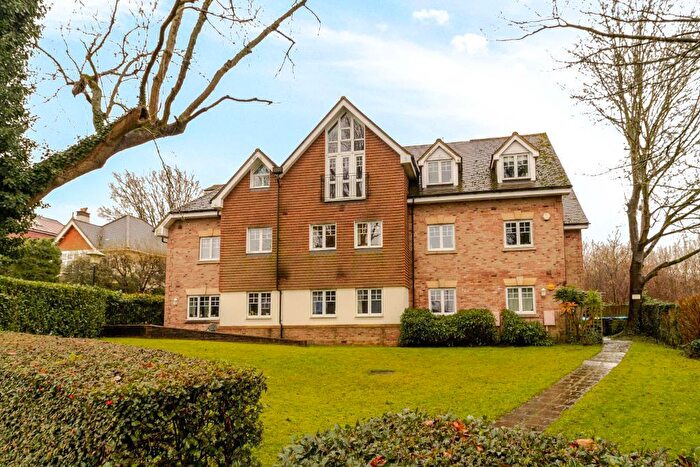
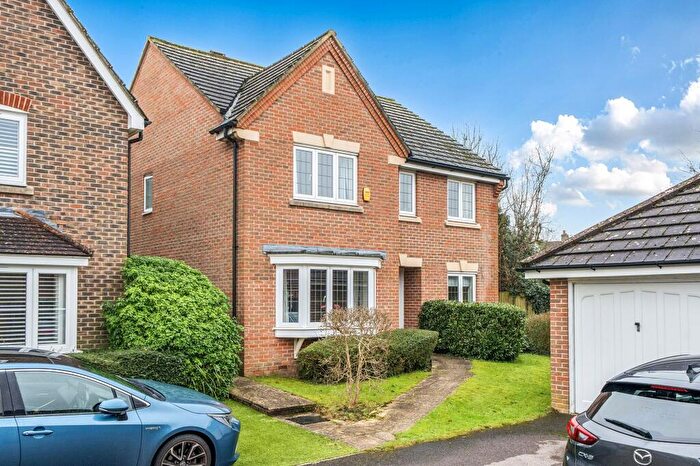
Properties for sale in Warlingham West
Roads and Postcodes in Warlingham West
Navigate through our locations to find the location of your next house in Warlingham West, Warlingham for sale or to rent.
| Streets | Postcodes |
|---|---|
| Ashwood | CR6 9HT |
| Badgers Lane | CR6 9JX |
| Bayards | CR6 9BP |
| Bournewood Grove | CR6 9BX |
| Broadlands Drive | CR6 9HX |
| Bug Hill | CR3 7LB |
| Burfield Drive | CR6 9JS |
| Butterfly Walk | CR6 9JA |
| Clovelly Avenue | CR6 9HZ |
| Coneybury Close | CR6 9BQ |
| Court Farm Park | CR6 9YA |
| Dorin Court | CR6 9JT |
| Hamsey Green Gardens | CR6 9RQ CR6 9RR CR6 9RS CR6 9RT |
| High Pines | CR6 9GQ |
| Hillbury Close | CR6 9TN |
| Hillbury Crescent | CR6 9TS |
| Hillbury Gardens | CR6 9TQ |
| Hillbury Road | CR6 9TD CR6 9TE CR6 9TF CR6 9TG CR6 9TJ CR6 9TL CR6 9TP |
| Homefield Road | CR6 9HQ CR6 9HU |
| Huntsmans Close | CR6 9JU |
| Kooringa | CR6 9JP |
| Landscape Road | CR6 9JB CR6 9FL |
| Leas Road | CR6 9LL |
| Limpsfield Road | CR6 9RA CR6 9RB CR6 9RD CR6 9RE CR6 9RF |
| Littlewold Drive | CR6 9BR |
| Martin Close | CR6 9AD |
| Narrow Lane | CR6 9HY |
| Oakley Road | CR6 9BE CR6 9BF |
| Old Westhall Close | CR6 9HR |
| Overhill | CR6 9JR |
| Paddock Walk | CR6 9HW |
| Redvers Road | CR6 9HN CR6 9JW |
| Ridley Road | CR6 9LR |
| Searchwood Heights | CR6 9GE |
| Searchwood Road | CR6 9BA CR6 9BB |
| Shelton Avenue | CR6 9NE CR6 9NF |
| Shelton Close | CR6 9ND |
| Southview Road | CR6 9JE CR6 9FD |
| Succombs Place | CR6 9JQ |
| Sycamore Place | CR6 9FH |
| Tandridge Road | CR6 9LS |
| The Green | CR6 9NA |
| The Mount | CR6 9JF |
| Timpani Hill | CR6 9BS |
| Tithe Pit Shaw Lane | CR6 9AL CR6 9AN CR6 9AP CR6 9AQ CR6 9AR CR6 9AT |
| Tithepit Shaw Lane | CR6 9YB |
| Tydcombe Road | CR6 9LU |
| Waterfield Drive | CR6 9HP |
| Westhall Park | CR6 9HS |
| Westhall Road | CR6 9BG CR6 9BH CR6 9BU CR6 9HB CR6 9HD CR6 9HE CR6 9HF CR6 9HG CR6 9HH CR6 9HJ CR6 9HL |
| Westview Road | CR6 9JD |
| Windmill Rise | CR6 9FB |
Transport near Warlingham West
-
Upper Warlingham Station
-
Whyteleafe South Station
-
Whyteleafe Station
-
Woldingham Station
-
Caterham Station
-
Kenley Station
-
Riddlesdown Station
-
Purley Station
- FAQ
- Price Paid By Year
- Property Type Price
Frequently asked questions about Warlingham West
What is the average price for a property for sale in Warlingham West?
The average price for a property for sale in Warlingham West is £683,315. This amount is 20% higher than the average price in Warlingham. There are 703 property listings for sale in Warlingham West.
What streets have the most expensive properties for sale in Warlingham West?
The streets with the most expensive properties for sale in Warlingham West are Littlewold Drive at an average of £2,424,500, Westhall Park at an average of £1,500,000 and Landscape Road at an average of £1,255,000.
What streets have the most affordable properties for sale in Warlingham West?
The streets with the most affordable properties for sale in Warlingham West are Dorin Court at an average of £354,808, Shelton Avenue at an average of £383,727 and Succombs Place at an average of £414,571.
Which train stations are available in or near Warlingham West?
Some of the train stations available in or near Warlingham West are Upper Warlingham, Whyteleafe South and Whyteleafe.
Property Price Paid in Warlingham West by Year
The average sold property price by year was:
| Year | Average Sold Price | Price Change |
Sold Properties
|
|---|---|---|---|
| 2025 | £778,388 | 10% |
38 Properties |
| 2024 | £703,869 | 17% |
49 Properties |
| 2023 | £582,881 | -39% |
46 Properties |
| 2022 | £812,524 | 19% |
75 Properties |
| 2021 | £654,239 | -18% |
92 Properties |
| 2020 | £773,966 | 12% |
70 Properties |
| 2019 | £680,586 | 24% |
73 Properties |
| 2018 | £518,708 | -32% |
92 Properties |
| 2017 | £685,902 | 16% |
71 Properties |
| 2016 | £577,456 | 1% |
72 Properties |
| 2015 | £574,524 | -15% |
97 Properties |
| 2014 | £661,726 | 29% |
76 Properties |
| 2013 | £471,803 | 8% |
83 Properties |
| 2012 | £436,354 | -7% |
70 Properties |
| 2011 | £466,949 | -23% |
68 Properties |
| 2010 | £576,183 | 29% |
54 Properties |
| 2009 | £410,182 | -22% |
50 Properties |
| 2008 | £499,129 | 7% |
57 Properties |
| 2007 | £465,275 | 12% |
83 Properties |
| 2006 | £408,032 | 2% |
81 Properties |
| 2005 | £398,593 | 15% |
53 Properties |
| 2004 | £340,417 | 1% |
51 Properties |
| 2003 | £336,710 | 4% |
55 Properties |
| 2002 | £322,220 | 16% |
64 Properties |
| 2001 | £269,443 | 15% |
88 Properties |
| 2000 | £228,263 | 14% |
62 Properties |
| 1999 | £196,107 | 13% |
92 Properties |
| 1998 | £171,164 | 2% |
67 Properties |
| 1997 | £167,693 | 15% |
83 Properties |
| 1996 | £142,474 | -7% |
74 Properties |
| 1995 | £152,391 | - |
54 Properties |
Property Price per Property Type in Warlingham West
Here you can find historic sold price data in order to help with your property search.
The average Property Paid Price for specific property types in the last three years are:
| Property Type | Average Sold Price | Sold Properties |
|---|---|---|
| Semi Detached House | £545,673.00 | 23 Semi Detached Houses |
| Detached House | £1,018,088.00 | 58 Detached Houses |
| Terraced House | £451,666.00 | 9 Terraced Houses |
| Flat | £353,867.00 | 43 Flats |

