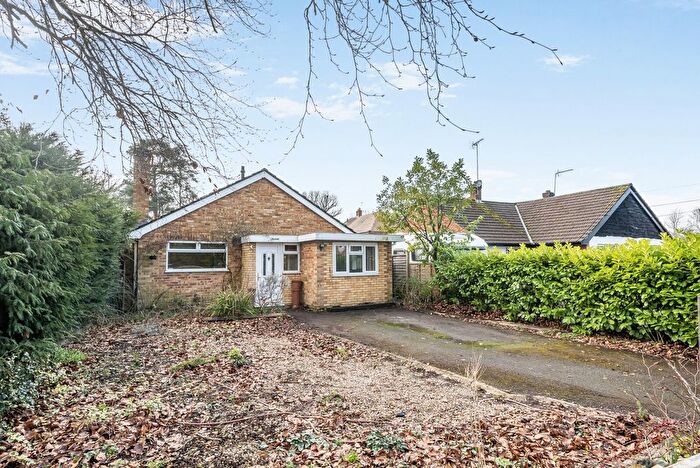
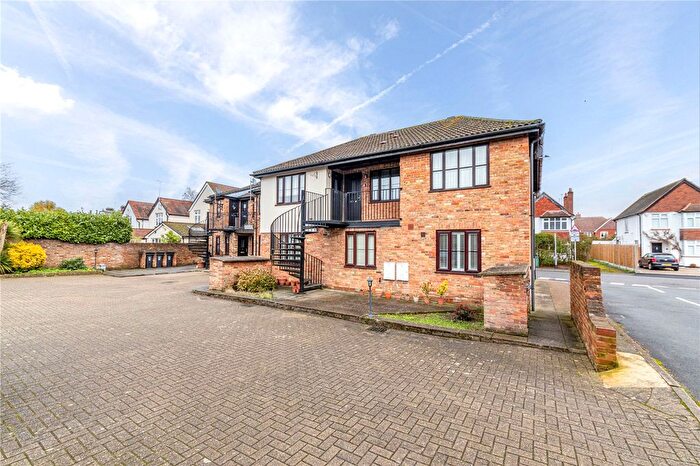
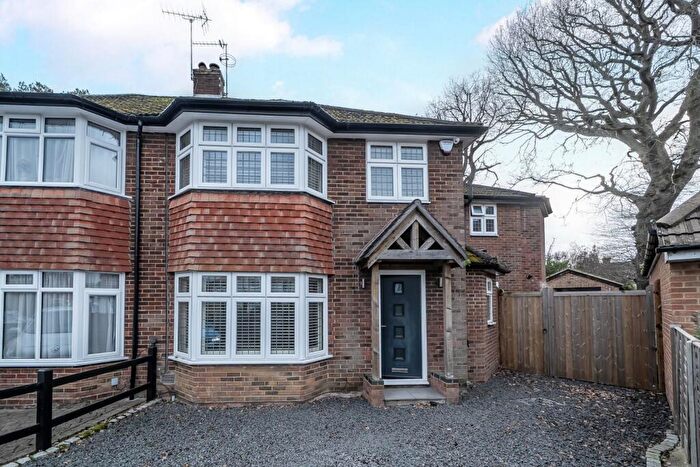
Houses for sale & to rent in Byfleet and West Byfleet, West Byfleet
House Prices in Byfleet and West Byfleet
Properties in Byfleet and West Byfleet have an average house price of £240,333.00 and had 45 Property Transactions within the last 3 years¹.
Byfleet and West Byfleet is an area in West Byfleet, Surrey with 103 households², where the most expensive property was sold for £375,000.00.
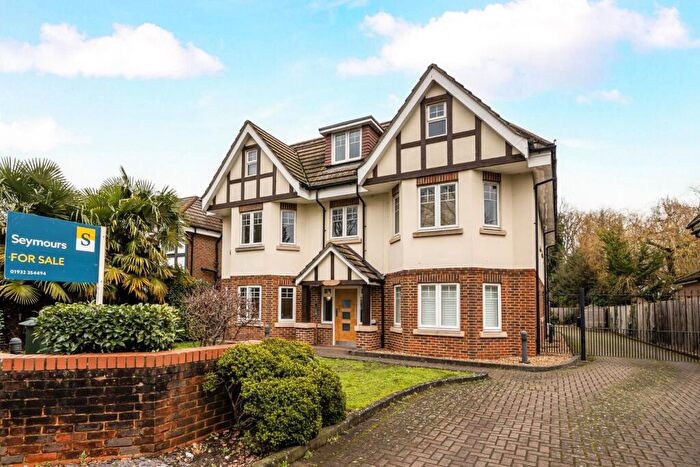
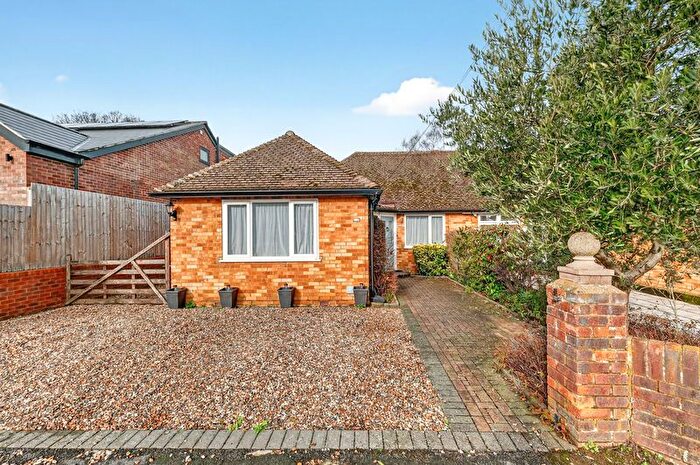
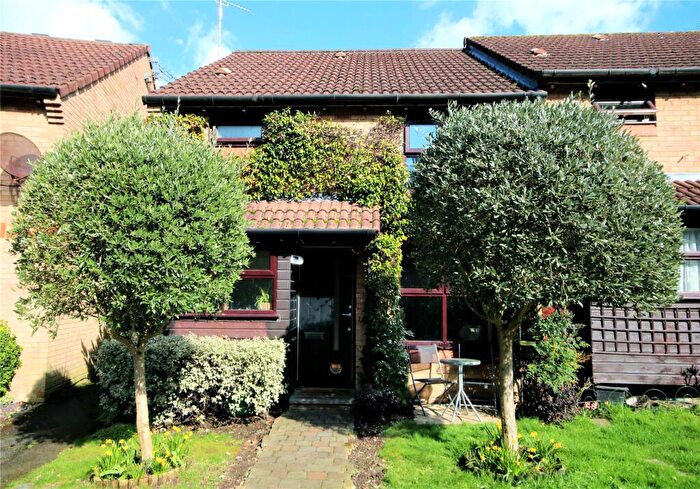
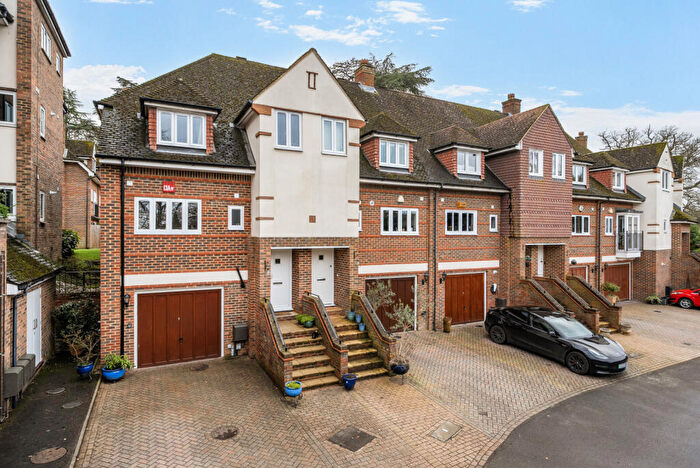
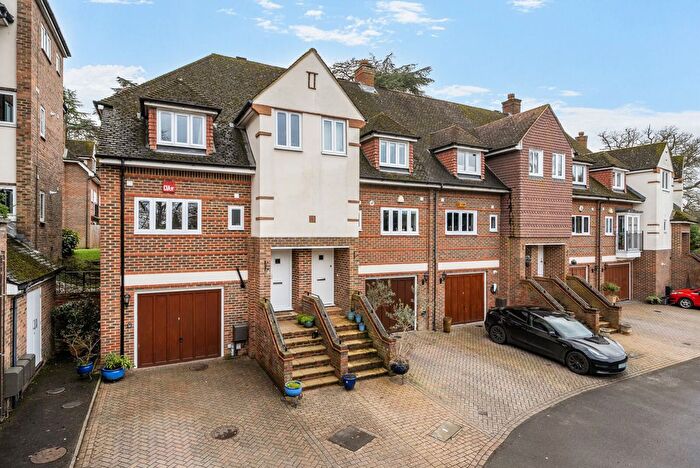
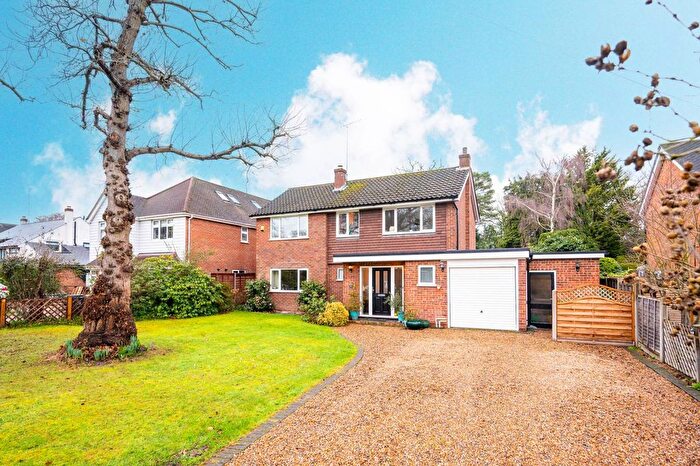
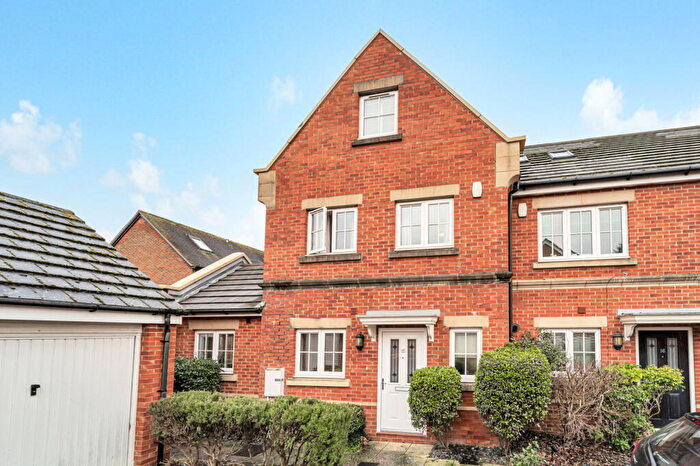
Properties for sale in Byfleet and West Byfleet
Roads and Postcodes in Byfleet and West Byfleet
Navigate through our locations to find the location of your next house in Byfleet and West Byfleet, West Byfleet for sale or to rent.
| Streets | Postcodes |
|---|---|
| Abbot Close | KT14 7JN KT14 7JT KT14 7NR |
| Barnato Close | KT14 6SN |
| Birch Walk | KT14 6EJ |
| Broadoaks Park Road | KT14 6FE KT14 6FH |
| Byfleet Technical Centre | KT14 7JX |
| Camphill Industrial Estate | KT14 6EW |
| Camphill Road | KT14 6EF KT14 6SQ |
| Canada Road | KT14 7JL |
| Chertsey Road | KT14 7FE |
| Dorset Way | KT14 7LB |
| Eden Grove Road | KT14 7PU |
| Hawthorne Close | KT14 7FL |
| High Road | KT14 7BS KT14 7QE KT14 7RL |
| Highfield Road | KT14 6JU KT14 6QU |
| Hobbs Close | KT14 6LT KT14 6FF |
| Lavender Park Road | KT14 6FD |
| Leisure Lane | KT14 6HF |
| Madeira Road | KT14 6DH KT14 6EB KT14 6ES |
| Mill Lane | KT14 7RT |
| Murrays Lane | KT14 7NE |
| Old Woking Road | KT14 6LN KT14 6NU |
| Oyster Lane | KT14 7DU KT14 7JH KT14 7JU KT14 7JW KT14 7JZ |
| Parvis Road | KT14 6EX KT14 6LP KT14 6LR KT14 6LY |
| Pyrford Road | KT14 6RA |
| Rosemount Avenue | KT14 6FA |
| Royston Road | KT14 7NY |
| Sheerwater Road | KT14 6AH |
| Station Approach | KT14 6NG KT14 6NQ KT14 6NW |
| The Corner | KT14 6NY |
| Wey Retail Park | KT14 7NP |
Transport near Byfleet and West Byfleet
- FAQ
- Price Paid By Year
- Property Type Price
Frequently asked questions about Byfleet and West Byfleet
What is the average price for a property for sale in Byfleet and West Byfleet?
The average price for a property for sale in Byfleet and West Byfleet is £240,333. This amount is 54% lower than the average price in West Byfleet. There are 4,055 property listings for sale in Byfleet and West Byfleet.
What streets have the most expensive properties for sale in Byfleet and West Byfleet?
The street with the most expensive properties for sale in Byfleet and West Byfleet is Pyrford Road at an average of £244,150.
What streets have the most affordable properties for sale in Byfleet and West Byfleet?
The street with the most affordable properties for sale in Byfleet and West Byfleet is Lavender Park Road at an average of £209,800.
Which train stations are available in or near Byfleet and West Byfleet?
Some of the train stations available in or near Byfleet and West Byfleet are West Byfleet, Byfleet and New Haw and Weybridge.
Property Price Paid in Byfleet and West Byfleet by Year
The average sold property price by year was:
| Year | Average Sold Price | Price Change |
Sold Properties
|
|---|---|---|---|
| 2025 | £208,333 | 3% |
3 Properties |
| 2024 | £201,650 | -27% |
10 Properties |
| 2023 | £255,421 | -11% |
32 Properties |
| 2022 | £282,600 | -59% |
3 Properties |
| 2021 | £450,000 | 31% |
1 Property |
| 2020 | £309,650 | -58% |
6 Properties |
| 2018 | £488,475 | 51% |
2 Properties |
| 2017 | £237,505 | 5% |
19 Properties |
| 2002 | £225,000 | 26% |
1 Property |
| 1998 | £167,500 | - |
1 Property |
Property Price per Property Type in Byfleet and West Byfleet
Here you can find historic sold price data in order to help with your property search.
The average Property Paid Price for specific property types in the last three years are:
| Property Type | Average Sold Price | Sold Properties |
|---|---|---|
| Flat | £240,333.00 | 45 Flats |

