
Houses for sale in West Byfleet, Woking
House Prices in West Byfleet
Properties in West Byfleet have an average house price of £983k and had 3 Property Transactions within the last 3 years¹.
West Byfleet is an area in Woking, Surrey with 71 households², where the most expensive property was sold for £1.25M.
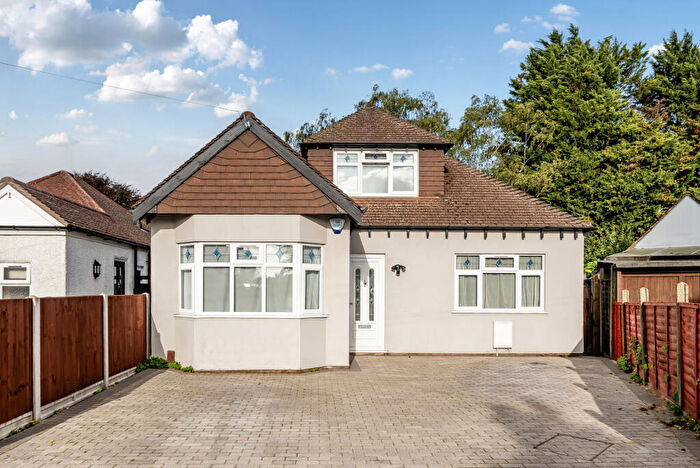
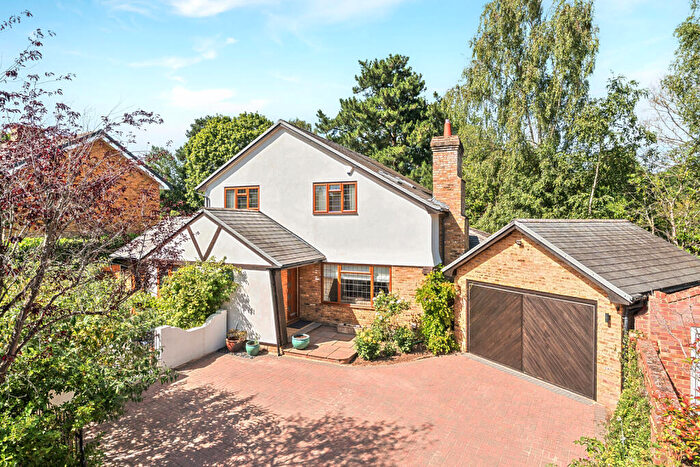
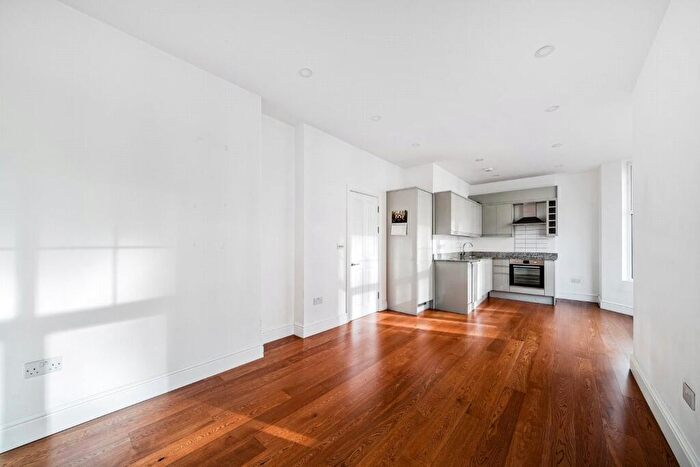
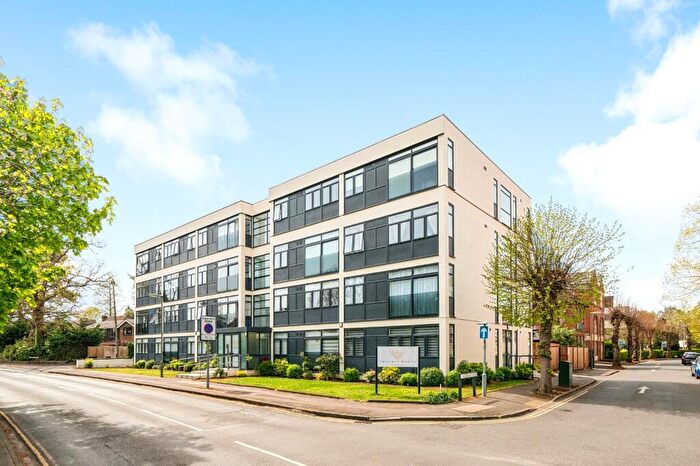
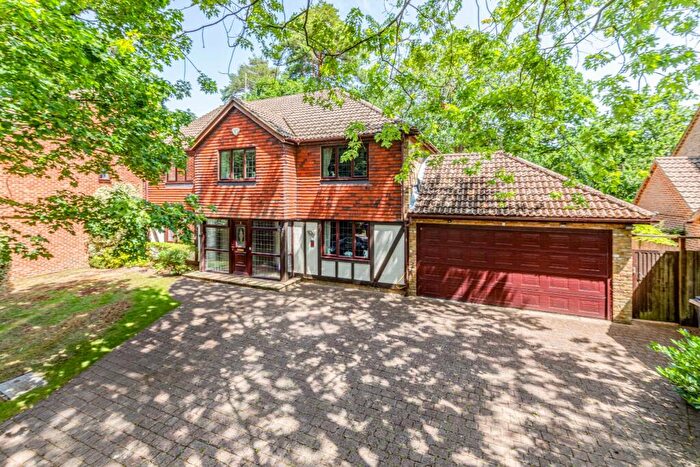
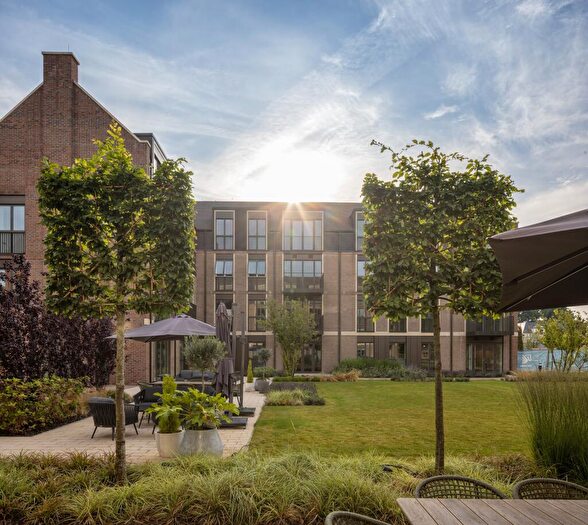
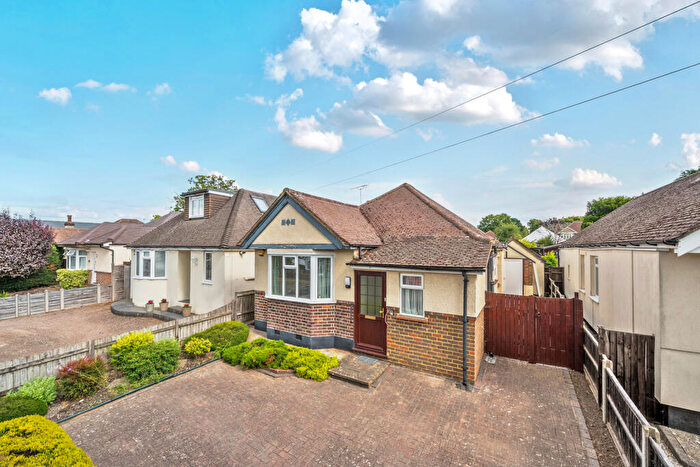
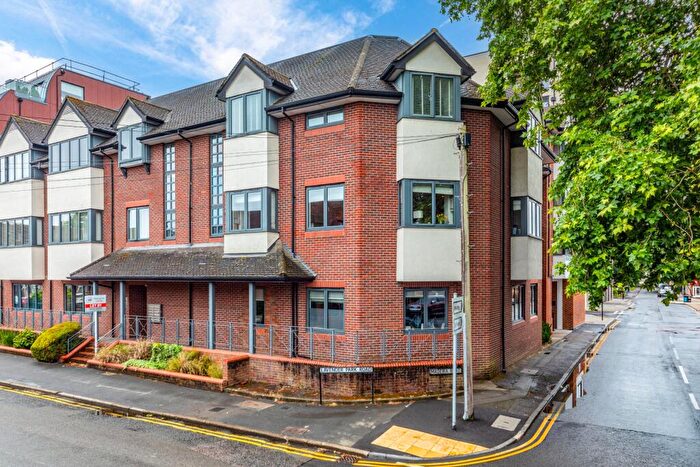
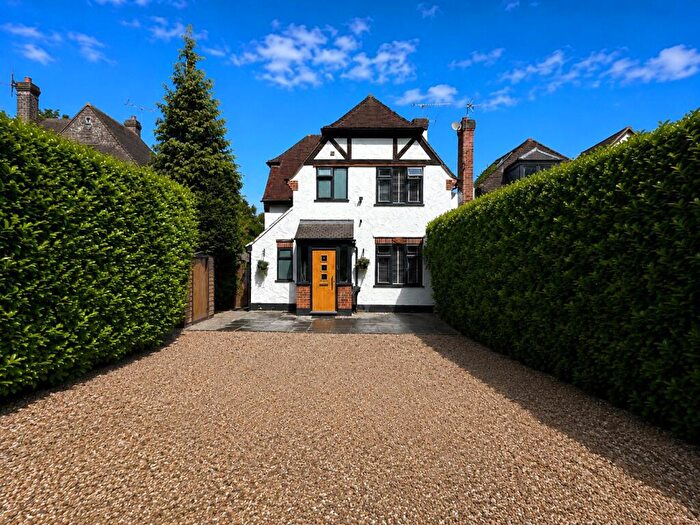
Properties for sale in West Byfleet
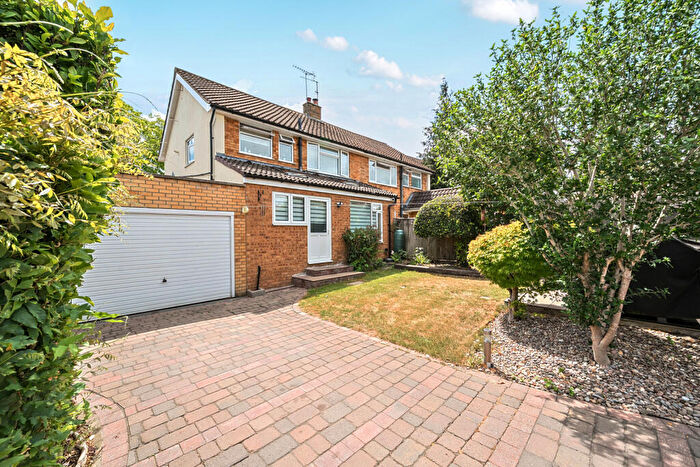
![]()
If you are looking to sell your house, let it out, or receive a property valuation, an expert can help you.
Click the button below to get started.

Roads and Postcodes in West Byfleet
Navigate through our locations to find the location of your next house in West Byfleet, Woking for sale or to rent.
| Streets | Postcodes |
|---|---|
| Ash Close | GU22 8UJ |
| Coldharbour Road | GU22 8SJ |
| Dane Court | GU22 8SX |
| Dodds Lane | GU22 8UW |
| Old Acre | GU22 8XP |
| Providence Place | GU22 8UN |
| Pyrford Road | GU22 8UQ |
| Thorley Gardens | GU22 8UL |
Property price trends in West Byfleet
According to the latest Land Registry data, the average home in West Byfleet sold for £1,005,000 in 2024. That figure comes from 83 sales logged over the past 28 years.
Prices have continued to climb over the last three years. Compared with 2021, when the typical sale came in around £922,500, that's a rise of roughly 8.9%.
Looking back five years, average prices are up about 74.8% since 2019, a gain of around £430,000 in cash terms.
Zoom out to the past decade for the fuller picture. Back in 2014, homes here averaged £868,750, so the typical sold price has climbed about 15.7% since then, roughly 1.5% a year. Stretch the view to fifteen years and that annual pace edges up closer to 4.4%.
Frequently asked questions about West Byfleet
What is the average price for a property for sale in West Byfleet?
The average price for a property for sale in West Byfleet is £983,333. This amount is 77% higher than the average price in Woking. There are 1,295 property listings for sale in West Byfleet.
Which train stations are available in or near West Byfleet?
Some of the train stations available in or near West Byfleet are West Byfleet, Byfleet and New Haw and Woking.
Property Price Paid in West Byfleet by Year
The average sold property price by year was:
| Year | Average Sold Price | Price Change |
Sold Properties
|
|---|---|---|---|
| 2024 | £1,005,000 | 3% |
1 Property |
| 2023 | £972,500 | -27% |
2 Properties |
| 2022 | £1,237,500 | 25% |
2 Properties |
| 2021 | £922,500 | -8% |
2 Properties |
| 2020 | £1,000,000 | 43% |
1 Property |
| 2019 | £575,000 | -45% |
1 Property |
| 2018 | £835,687 | 13% |
8 Properties |
| 2017 | £730,000 | -12% |
2 Properties |
| 2016 | £820,000 | 5% |
3 Properties |
| 2015 | £780,000 | -11% |
1 Property |
Property Price per Property Type in West Byfleet
Here you can find historic sold price data in order to help with your property search.
The average Property Paid Price for specific property types in the last three years are:
| Property Type | Average Sold Price | Sold Properties |
|---|---|---|
| Detached House | £1,125,000.00 | 2 Detached Houses |
| Terraced House | £700,000.00 | 1 Terraced House |
