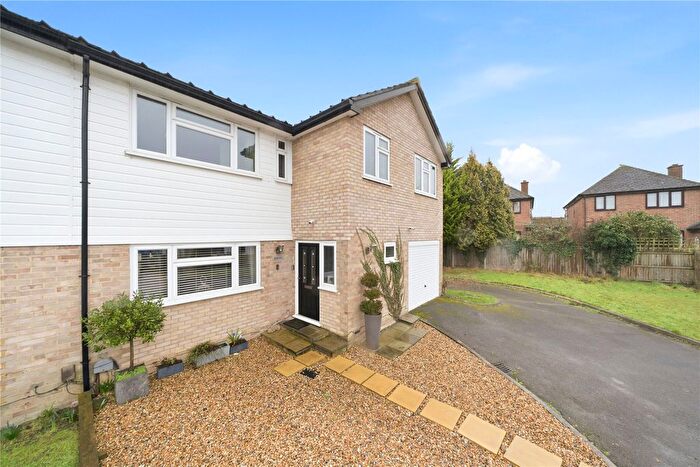
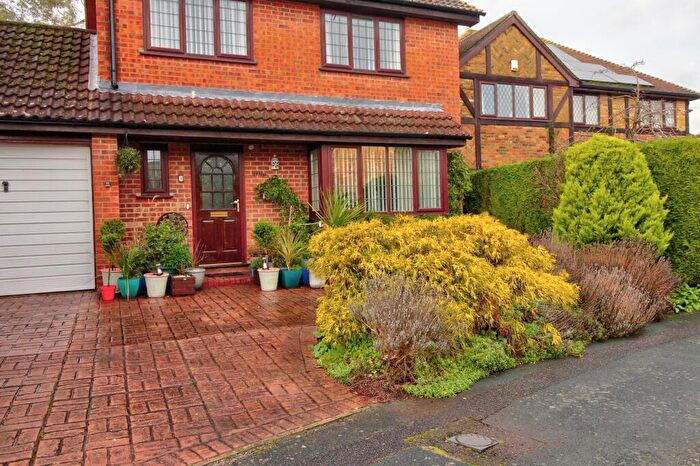
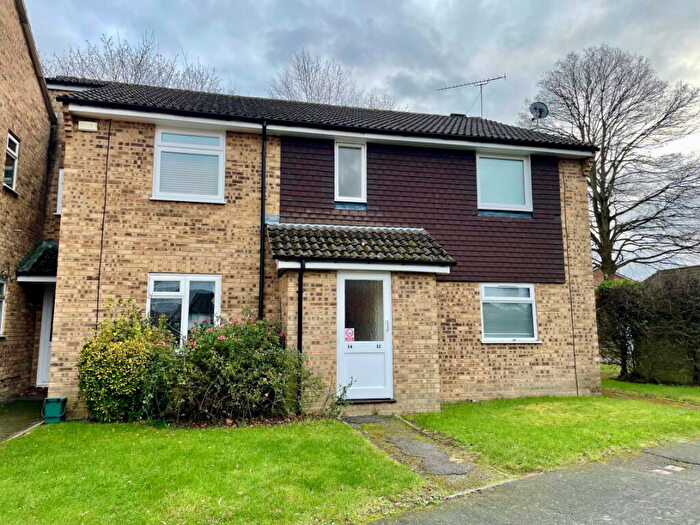
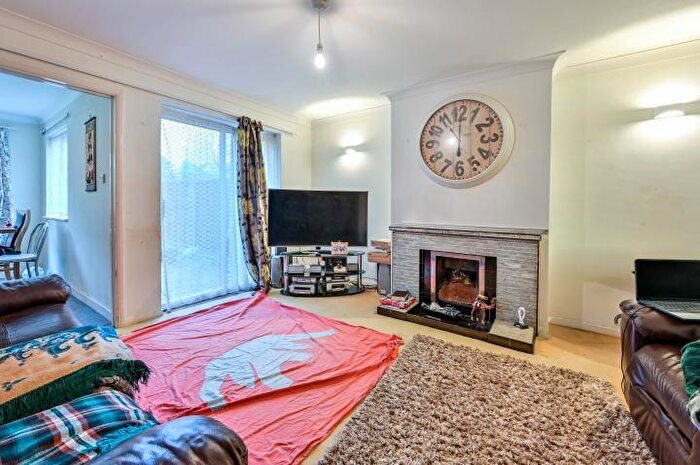
Houses for sale & to rent in Bisley, Woking
House Prices in Bisley
Properties in Bisley have an average house price of £542,918.00 and had 128 Property Transactions within the last 3 years¹.
Bisley is an area in Woking, Surrey with 1,306 households², where the most expensive property was sold for £1,415,000.00.
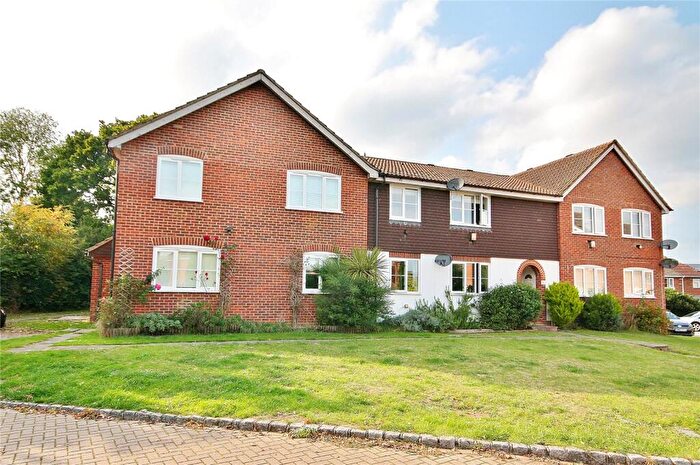
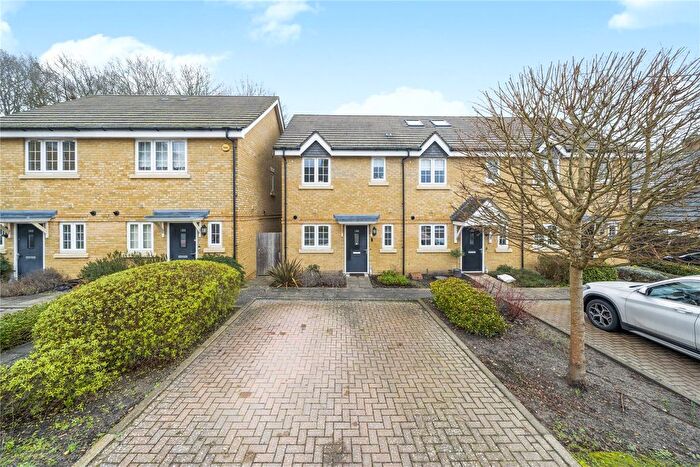
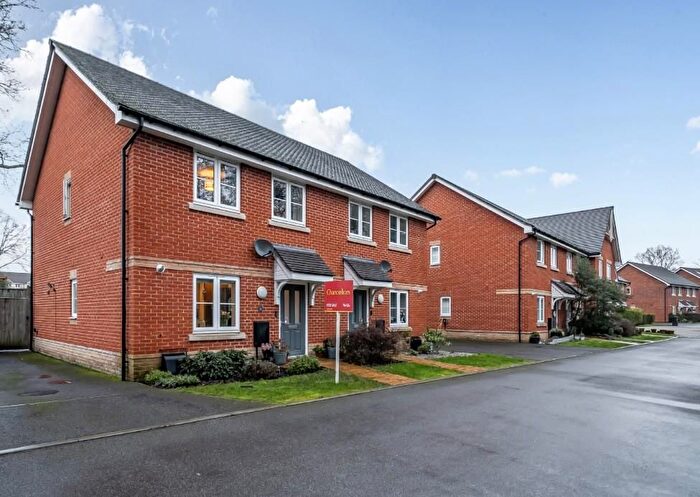
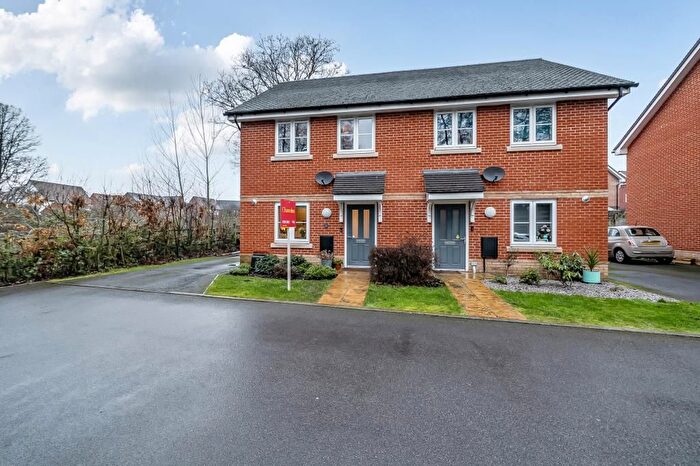
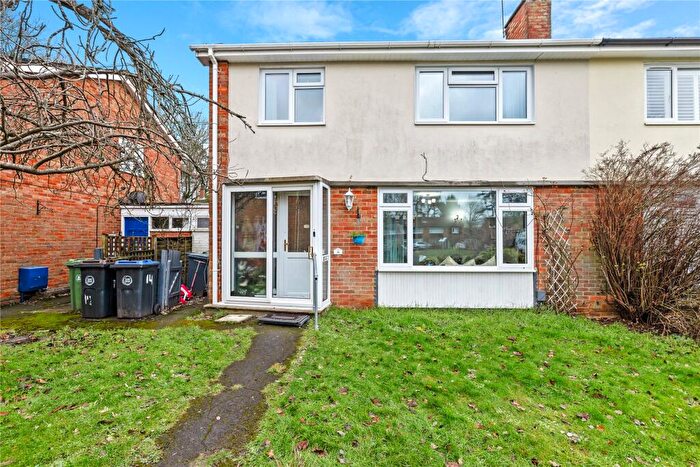
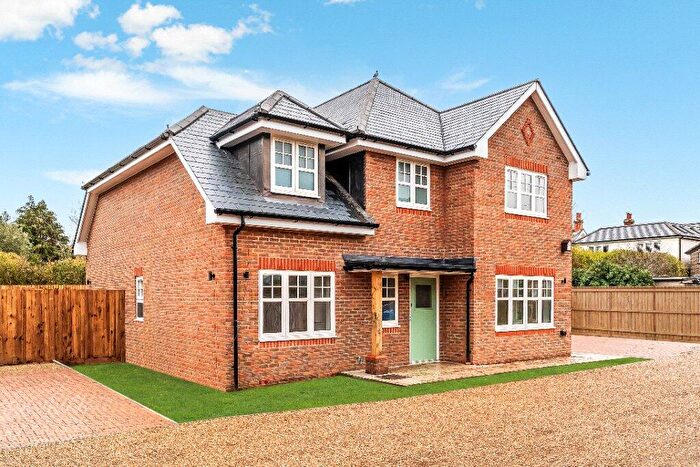
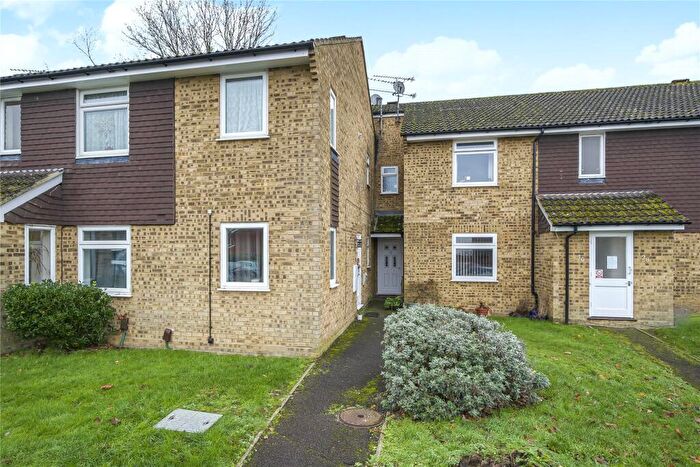
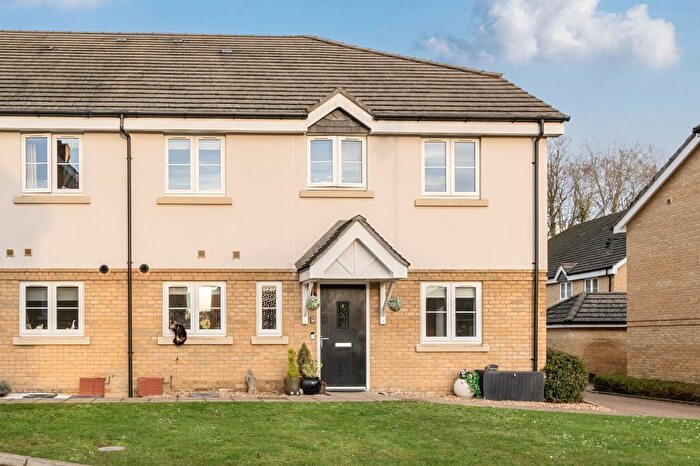
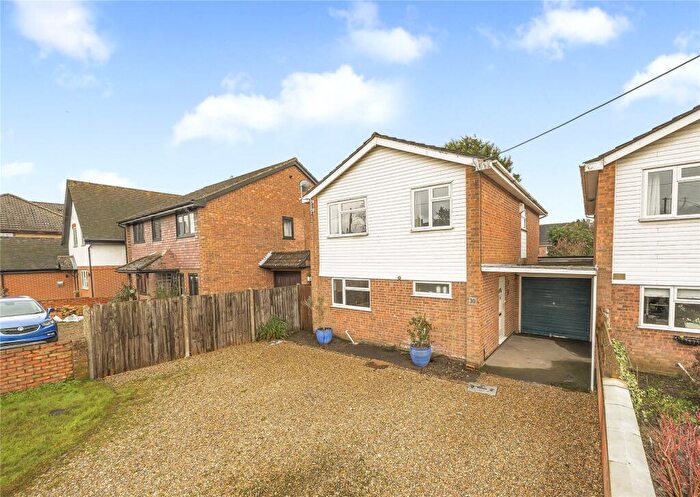
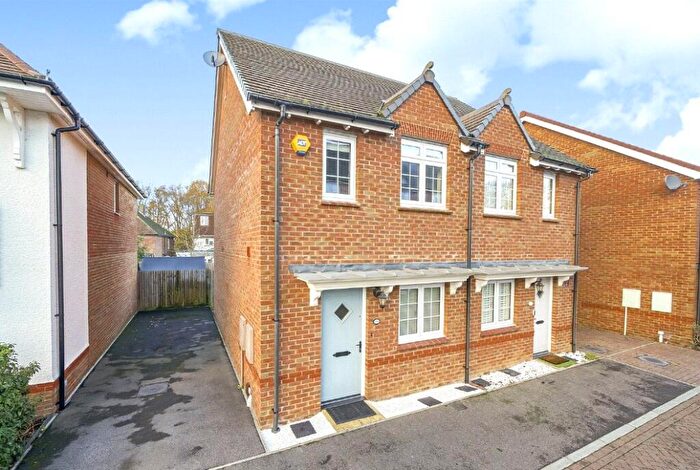
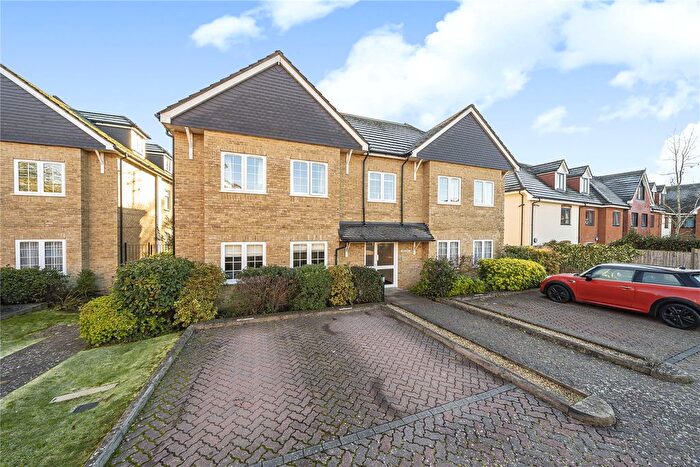
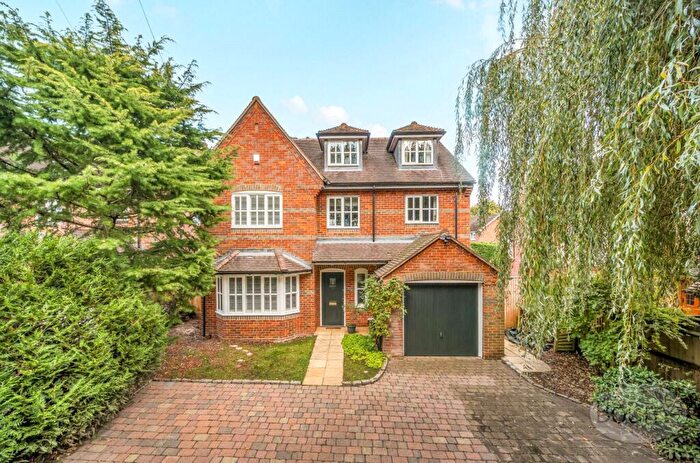
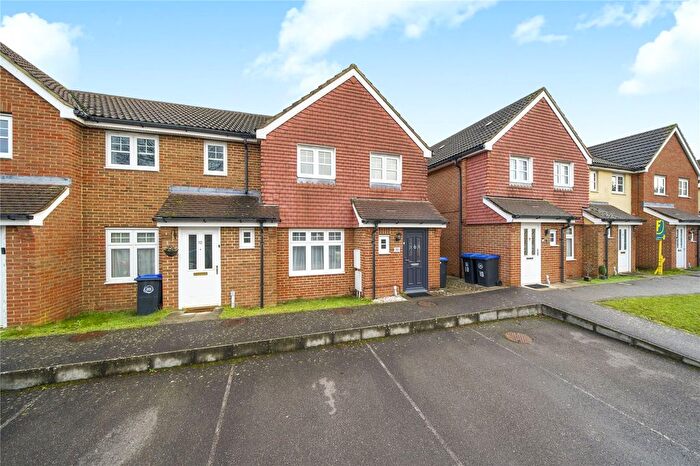
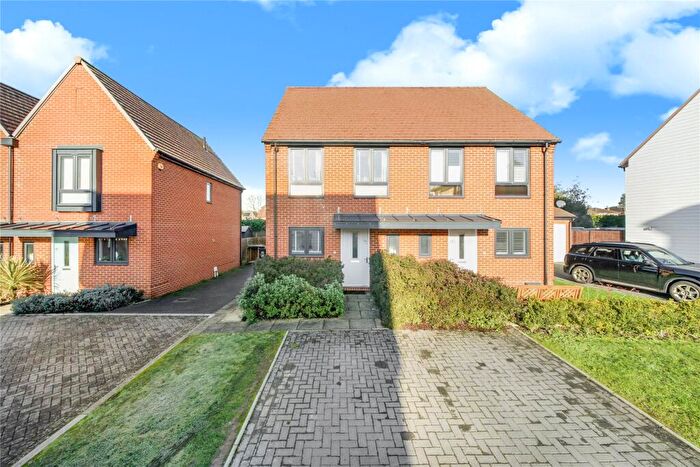
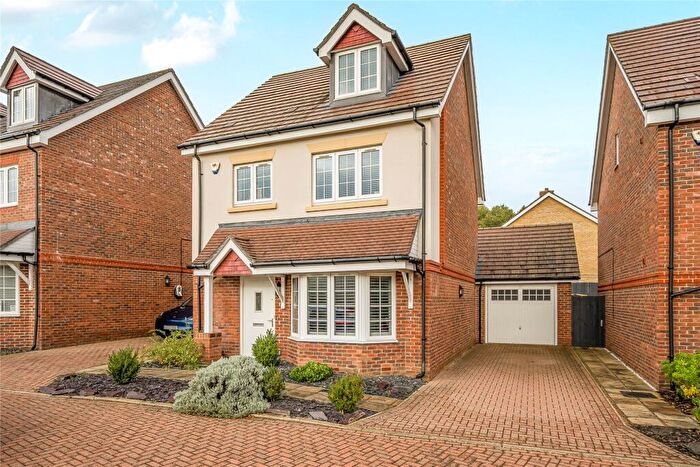
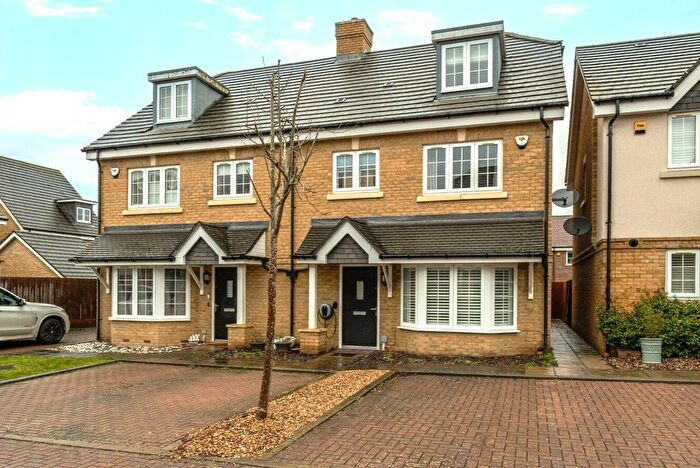
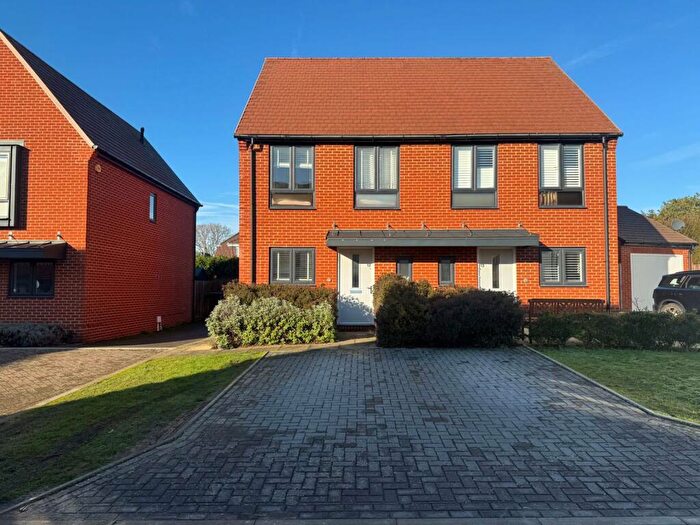
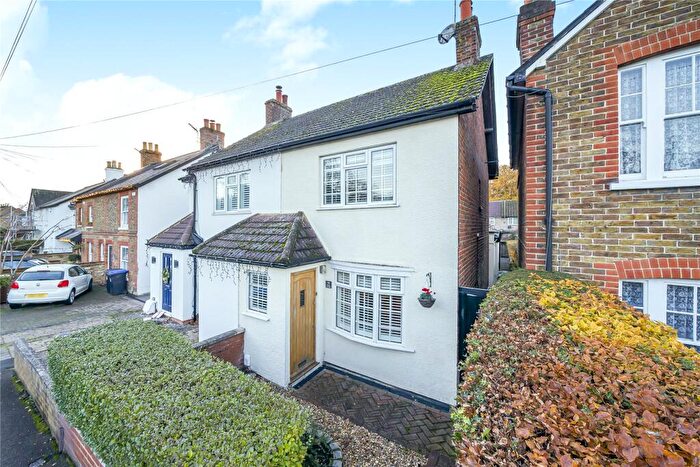
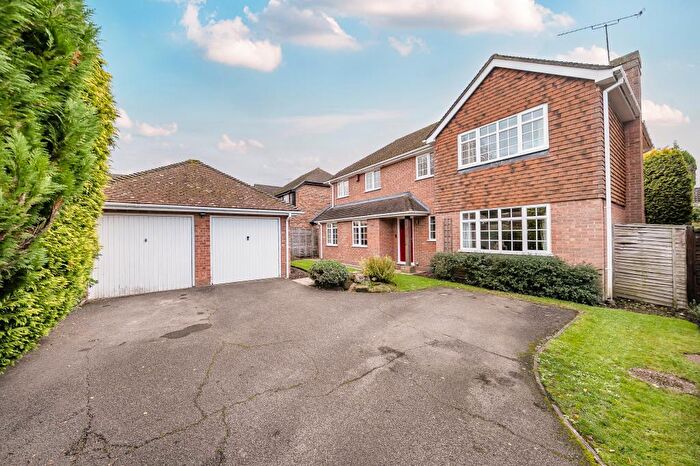
Properties for sale in Bisley
Roads and Postcodes in Bisley
Navigate through our locations to find the location of your next house in Bisley, Woking for sale or to rent.
| Streets | Postcodes |
|---|---|
| Angelica Road | GU24 9EY |
| Arethusa Way | GU24 9BT GU24 9BU GU24 9BX GU24 9BY GU24 9BZ |
| Bisley Green | GU24 9EN GU24 9EW |
| Cedar Grove | GU24 9EF |
| Chatton Row | GU24 9AP |
| Church Lane | GU24 9DX GU24 9EA GU24 9EB GU24 9ED |
| Clews Lane | GU24 9DZ GU24 9SJ |
| Cobbetts Walk | GU24 9DT GU24 9DU |
| Cottesloe Close | GU24 9BS |
| Daffodil Drive | GU24 9EZ |
| Donnafields | GU24 9DP |
| Elder Road | GU24 9HB GU24 9SA |
| Elm Grove | GU24 9DG |
| Ford Road | GU24 9EJ GU24 9EL |
| Foxleigh Grange | GU24 9AQ |
| Freesia Drive | GU24 9HA |
| Germander Drive | GU24 9HE |
| Greyfriars Drive | GU24 9EE |
| Guildford Road | GU24 9AA GU24 9AB GU24 9AD GU24 9AE GU24 9AF GU24 9AG GU24 9DA GU24 9DD GU24 9DJ GU24 9DL GU24 9EQ GU24 9LT |
| Hawthorn Way | GU24 9DF |
| Hollyhock Drive | GU24 9HF |
| Iris Road | GU24 9HG |
| Juniper Drive | GU24 9HQ |
| Kingcup Drive | GU24 9HH |
| Lobelia Road | GU24 9SE |
| Mainstone Road | GU24 9EU |
| Marigold Drive | GU24 9SF |
| Nasturtium Drive | GU24 9SD |
| Orchid Drive | GU24 9SB |
| Pilgrims Way | GU24 9DQ |
| Portway | GU24 9AJ |
| Primrose Drive | GU24 9RU |
| Queens Close | GU24 9AL |
| Queens Road | GU24 9AN GU24 9AR GU24 9AS GU24 9AT GU24 9AU GU24 9AW GU24 9AX |
| Quince Drive | GU24 9RT |
| Reidon Hill | GU21 2SH GU21 2SQ |
| Rosebury Drive | GU24 9RX |
| Salvia Court | GU24 9EH |
| School Close | GU24 9EG |
| Shaftesbury Road | GU24 9ER |
| Snowdrop Way | GU24 9BL |
| South Road | GU24 9ES GU24 9ET |
| Stafford Lake | GU21 2SJ GU24 9AY |
| Strawberry Fields | GU24 9SP |
| Strawberry Rise | GU24 9SR |
| Wilcot Close | GU24 9DE |
| Wilcot Gardens | GU24 9DH |
| Yellowcress Drive | GU24 9HD |
| Zinnia Drive | GU24 9RY |
Transport near Bisley
-
Brookwood Station
-
Worplesdon Station
-
Woking Station
-
Bagshot Station
-
Longcross Station
-
Sunningdale Station
-
Camberley Station
-
Frimley Station
-
Farnborough North Station
- FAQ
- Price Paid By Year
- Property Type Price
Frequently asked questions about Bisley
What is the average price for a property for sale in Bisley?
The average price for a property for sale in Bisley is £542,918. This amount is 2% lower than the average price in Woking. There are 763 property listings for sale in Bisley.
What streets have the most expensive properties for sale in Bisley?
The streets with the most expensive properties for sale in Bisley are Chatton Row at an average of £1,139,166, Ford Road at an average of £1,017,500 and Church Lane at an average of £981,666.
What streets have the most affordable properties for sale in Bisley?
The streets with the most affordable properties for sale in Bisley are Primrose Drive at an average of £165,500, Rosebury Drive at an average of £282,250 and Germander Drive at an average of £295,000.
Which train stations are available in or near Bisley?
Some of the train stations available in or near Bisley are Brookwood, Worplesdon and Woking.
Property Price Paid in Bisley by Year
The average sold property price by year was:
| Year | Average Sold Price | Price Change |
Sold Properties
|
|---|---|---|---|
| 2025 | £528,662 | -2% |
43 Properties |
| 2024 | £538,633 | -5% |
51 Properties |
| 2023 | £567,377 | 1% |
34 Properties |
| 2022 | £559,716 | 10% |
53 Properties |
| 2021 | £503,616 | 7% |
81 Properties |
| 2020 | £467,183 | -5% |
30 Properties |
| 2019 | £488,391 | 6% |
52 Properties |
| 2018 | £457,574 | -2% |
53 Properties |
| 2017 | £468,789 | 2% |
76 Properties |
| 2016 | £459,831 | 15% |
55 Properties |
| 2015 | £393,006 | 10% |
67 Properties |
| 2014 | £354,324 | 0,1% |
69 Properties |
| 2013 | £354,130 | 16% |
65 Properties |
| 2012 | £298,121 | 4% |
42 Properties |
| 2011 | £287,357 | -25% |
48 Properties |
| 2010 | £358,213 | 24% |
37 Properties |
| 2009 | £272,781 | -28% |
37 Properties |
| 2008 | £349,230 | 1% |
40 Properties |
| 2007 | £345,997 | 27% |
90 Properties |
| 2006 | £253,974 | -10% |
86 Properties |
| 2005 | £278,322 | 10% |
69 Properties |
| 2004 | £251,437 | 5% |
107 Properties |
| 2003 | £238,889 | 11% |
87 Properties |
| 2002 | £213,056 | 8% |
108 Properties |
| 2001 | £195,221 | 5% |
107 Properties |
| 2000 | £185,877 | 23% |
69 Properties |
| 1999 | £142,808 | 14% |
108 Properties |
| 1998 | £123,078 | 5% |
102 Properties |
| 1997 | £116,602 | 6% |
128 Properties |
| 1996 | £109,709 | 22% |
94 Properties |
| 1995 | £85,832 | - |
63 Properties |
Property Price per Property Type in Bisley
Here you can find historic sold price data in order to help with your property search.
The average Property Paid Price for specific property types in the last three years are:
| Property Type | Average Sold Price | Sold Properties |
|---|---|---|
| Semi Detached House | £501,303.00 | 33 Semi Detached Houses |
| Detached House | £727,213.00 | 53 Detached Houses |
| Terraced House | £370,266.00 | 35 Terraced Houses |
| Flat | £207,000.00 | 7 Flats |

