
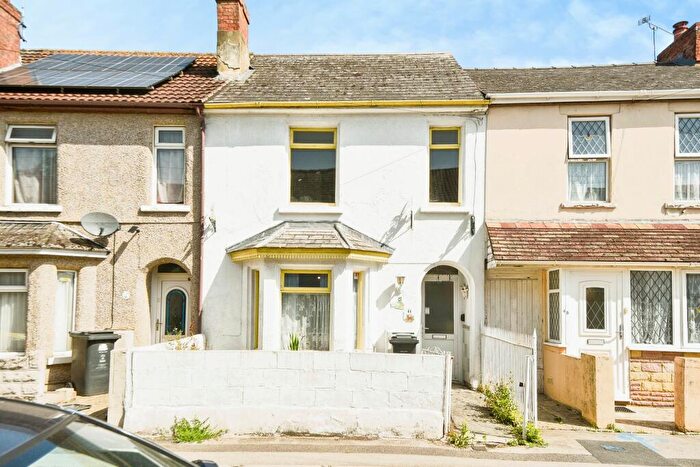
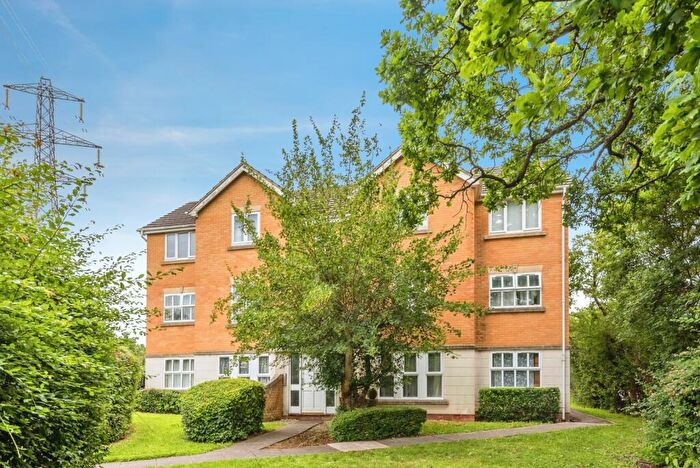
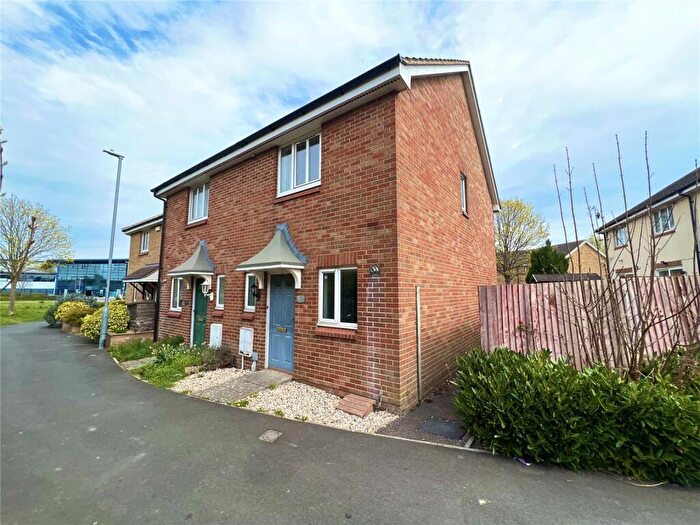
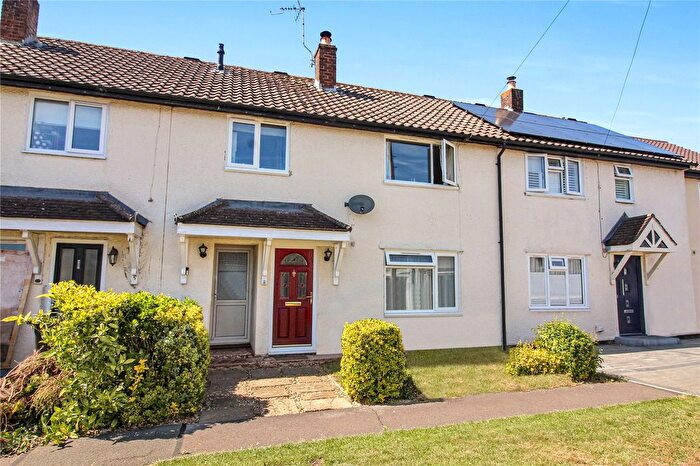
Houses for sale in Swindon, Wiltshire
House Prices in Swindon
Properties in Swindon have an average house price of £364k and had 1,309 Property Transactions within the last 3 years.¹
Swindon is an area in Wiltshire with 13,376 households², where the most expensive property was sold for £2.2M.
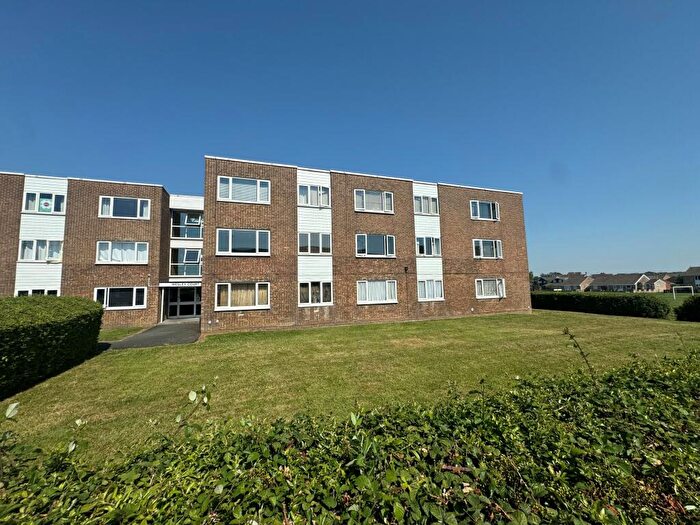
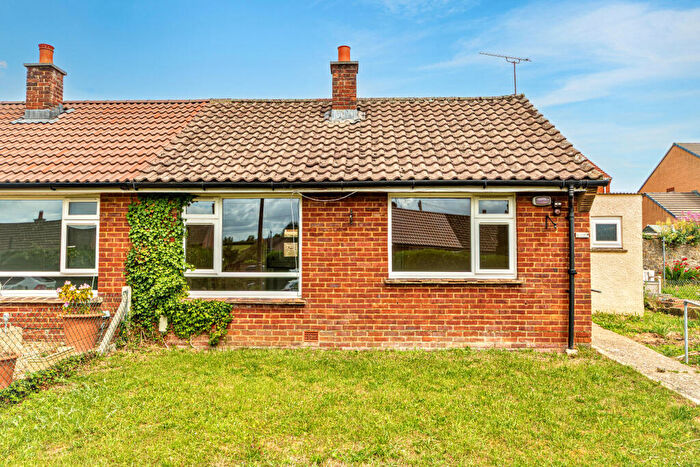
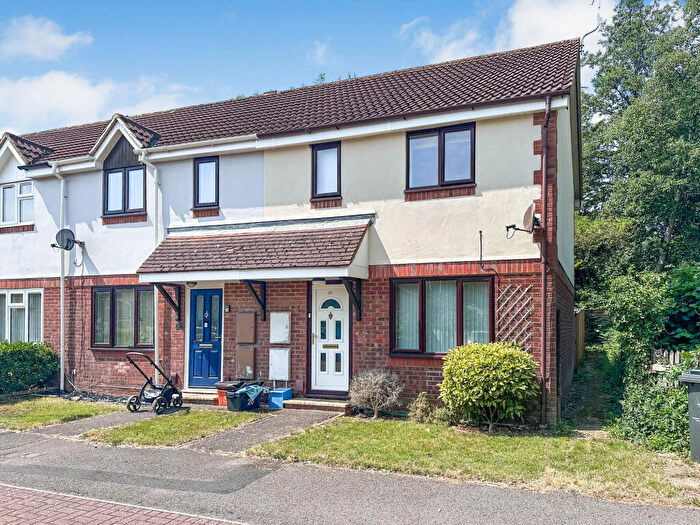
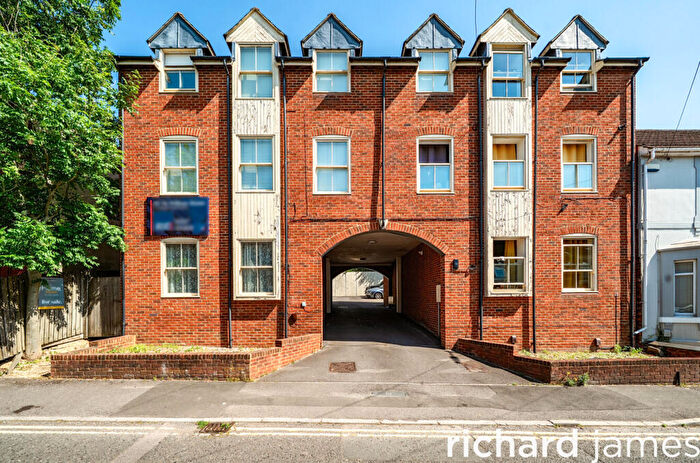
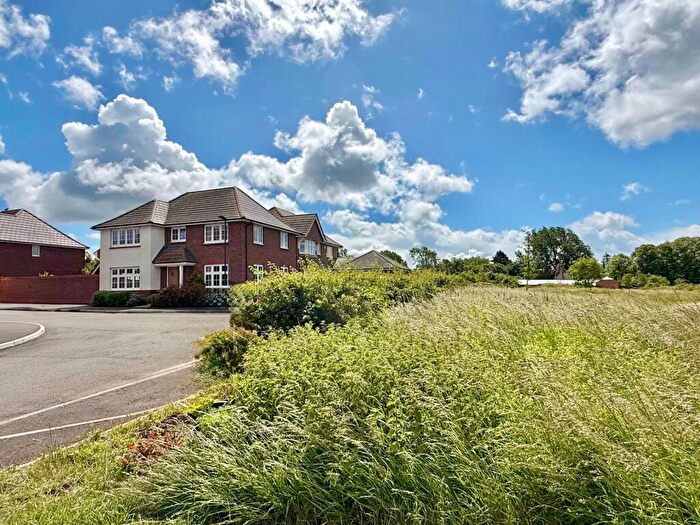
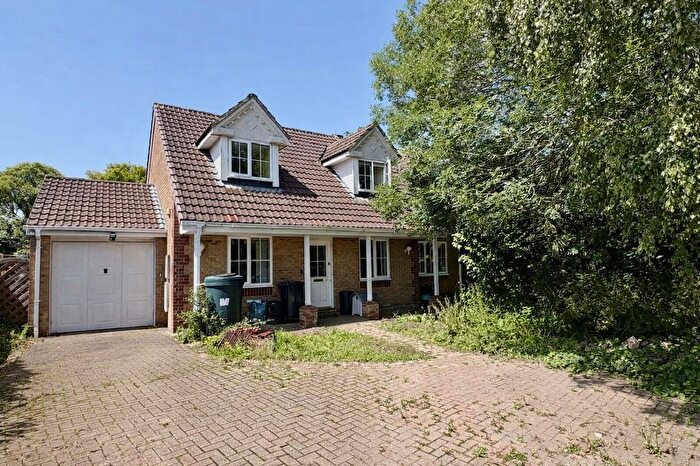
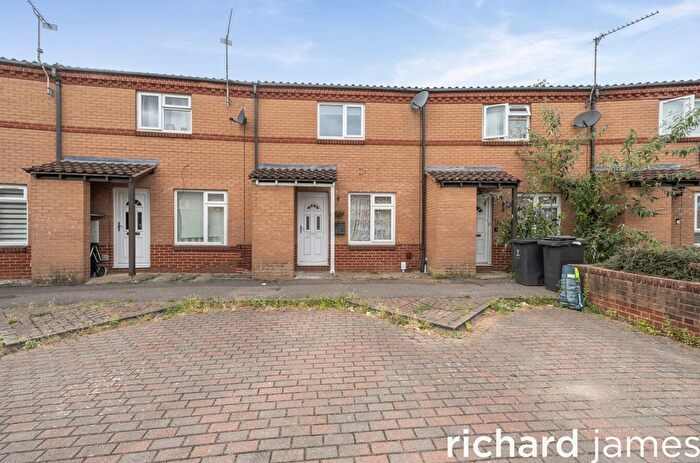
Properties for sale in Swindon
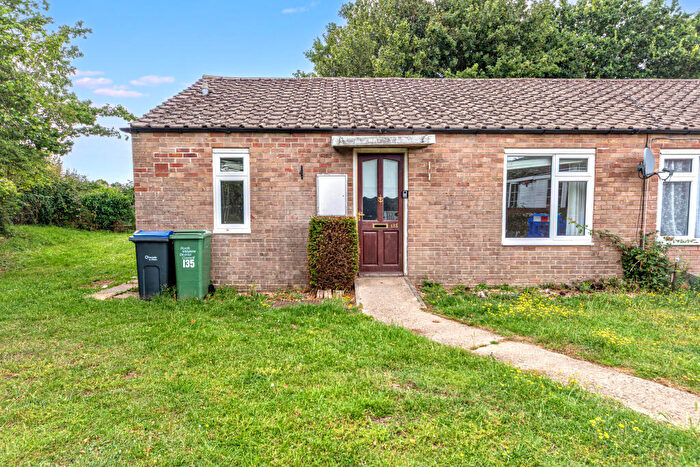
![]()
If you are looking to sell your house, let it out, or receive a property valuation, an expert can help you.
Click the button below to get started.

Neighbourhoods in Swindon
Navigate through our locations to find the location of your next house in Swindon, Wiltshire for sale or to rent.
- Brinkworth
- Cricklade And Latton
- Lyneham
- Minety
- Purton
- Royal Wootton Bassett East
- Royal Wootton Bassett North
- Royal Wootton Bassett South
- West Selkley
- Central
- St Margaret And South Marston
- Eastcott
- Old Town
- Gorse Hill And Pinehurst
- Covingham And Dorcan
- St Andrews
- Haydon Wick
- Penhill And Upper Stratton
- Royal Wootton Bassett South & West
- Marlborough West
- Wroughton And Wichelstowe
- Rodbourne Cheney
- Blunsdon And Highworth
- Ridgeway
- Liden, Eldene And Park South
- Walcot And Park North
- Chiseldon And Lawn
- Mannington And Western
- Shaw
- Cricklade & Latton
Property price trends in Swindon
According to the latest Land Registry data, the average home in Swindon sold for £350,796 in 2026. That figure comes from a substantial record of 16,350 sales logged over the past 31 years.
Prices have softened over the last three years. Compared with 2023, when the typical sale came in around £366,208, that's a fall of roughly 4.2%.
Looking back five years, average prices are up about 1.2% since 2021, a gain of around £4,017 in cash terms.
Zoom out to the past decade for the fuller picture. Back in 2016, homes here averaged £276,089, so the typical sold price has climbed about 27.1% since then, roughly 2.4% a year. Stretch the view to fifteen years and that annual pace holds at about 2.6%.
Frequently asked questions about Swindon
What is the average price for a property for sale in Swindon?
The average price for a property for sale in Swindon is £364,339. This amount is 0.03% lower than the average price in Wiltshire. There are more than 10,000 property listings for sale in Swindon.
What locations have the most expensive properties for sale in Swindon?
The locations with the most expensive properties for sale in Swindon are Lyneham at an average of £629,866, West Selkley at an average of £594,984 and Minety at an average of £530,250.
What locations have the most affordable properties for sale in Swindon?
The locations with the most affordable properties for sale in Swindon are Royal Wootton Bassett North at an average of £275,226, Royal Wootton Bassett South at an average of £305,874 and Purton at an average of £355,053.
Which train stations are available in or near Swindon?
Some of the train stations available in or near Swindon are Swindon, Kemble and Chippenham.
Property Price Paid in Swindon by Year
The average sold property price by year was:
| Year | Average Sold Price | Price Change |
Sold Properties
|
|---|---|---|---|
| 2026 | £350,796 | -5% |
28 Properties |
| 2025 | £368,759 | 3% |
426 Properties |
| 2024 | £359,300 | -2% |
449 Properties |
| 2023 | £366,208 | -2% |
406 Properties |
| 2022 | £373,425 | 7% |
499 Properties |
| 2021 | £346,779 | 9% |
618 Properties |
| 2020 | £315,480 | 4% |
486 Properties |
| 2019 | £302,996 | -3% |
534 Properties |
| 2018 | £312,991 | 6% |
622 Properties |
| 2017 | £293,409 | 6% |
639 Properties |
Property Price per Property Type in Swindon
Here you can find historic sold price data in order to help with your property search.
The average Property Paid Price for specific property types in the last three years are:
| Property Type | Average Sold Price | Sold Properties |
|---|---|---|
| Semi Detached House | £318,559.00 | 395 Semi Detached Houses |
| Detached House | £529,890.00 | 454 Detached Houses |
| Terraced House | £270,458.00 | 347 Terraced Houses |
| Flat | £147,520.00 | 113 Flats |
Transport in Swindon
Please see below transportation links in this area:
