
Houses for sale & to rent in SN1 5BG, Emlyn Square, Central, Swindon
House Prices in SN1 5BG, Emlyn Square, Central
Properties in SN1 5BG have no sales history available within the last 3 years. SN1 5BG is a postcode in Emlyn Square located in Central, an area in Swindon, Swindon, with 3 households².
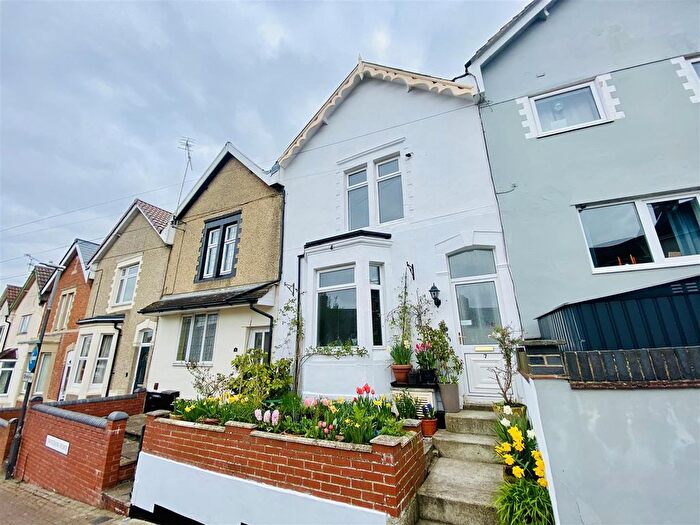
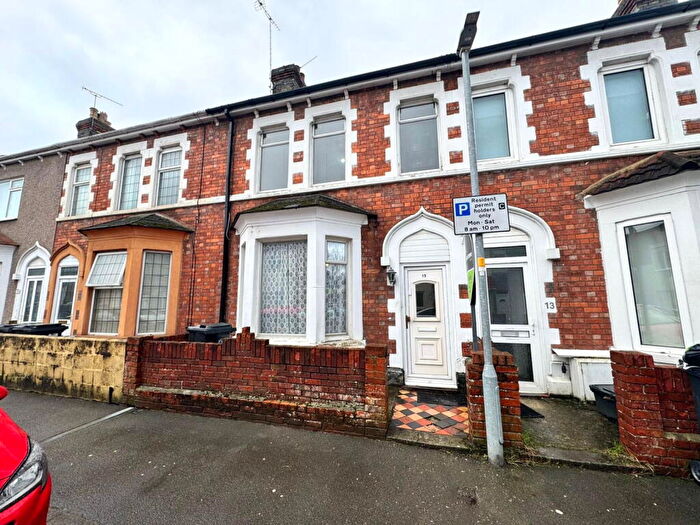
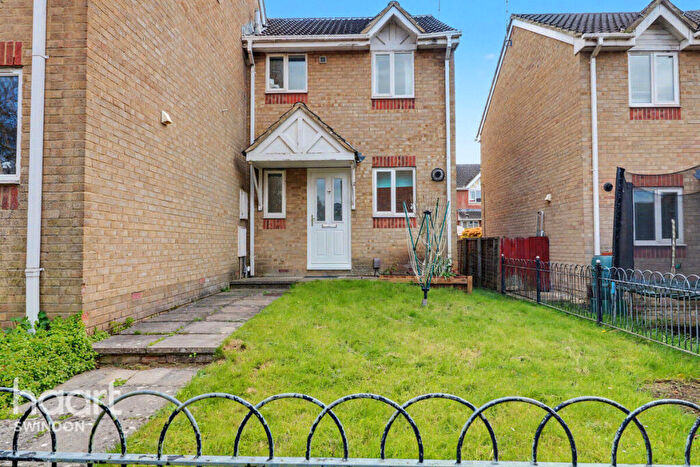
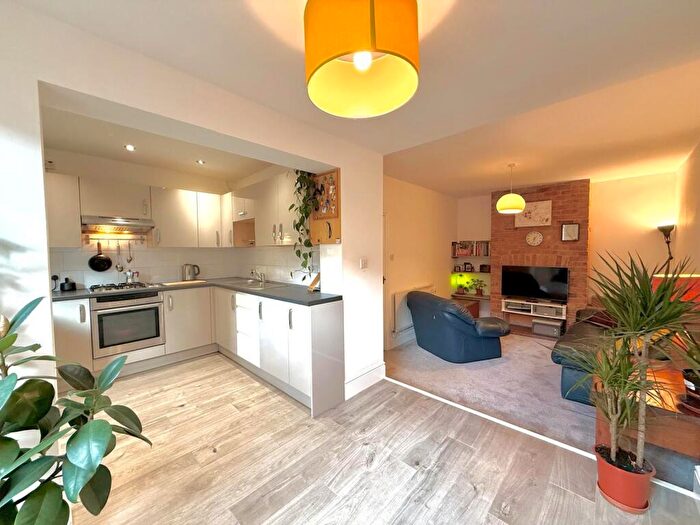
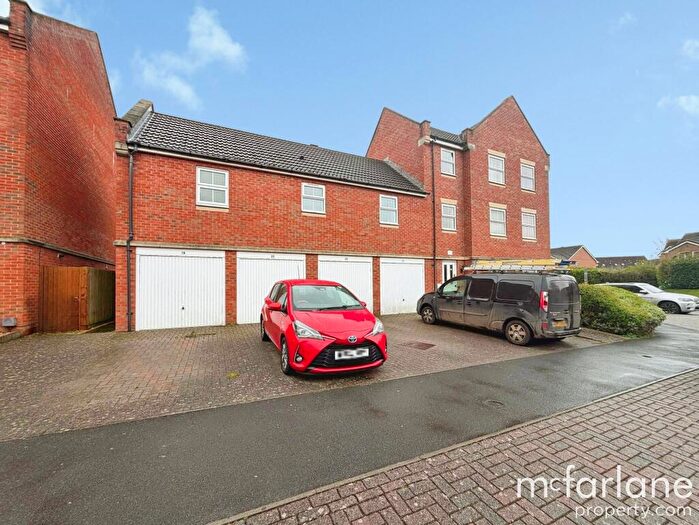
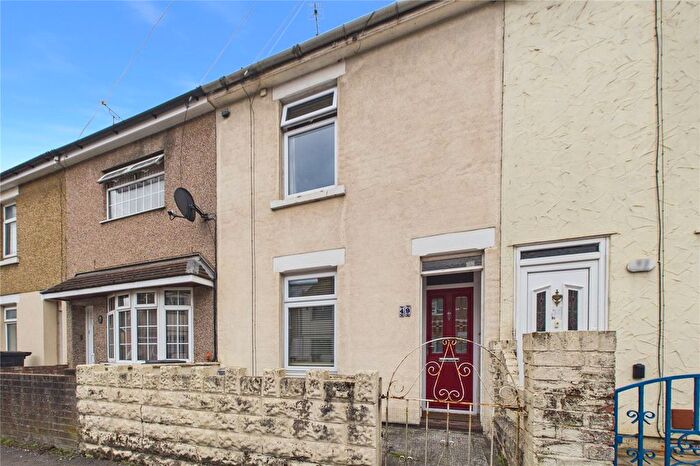
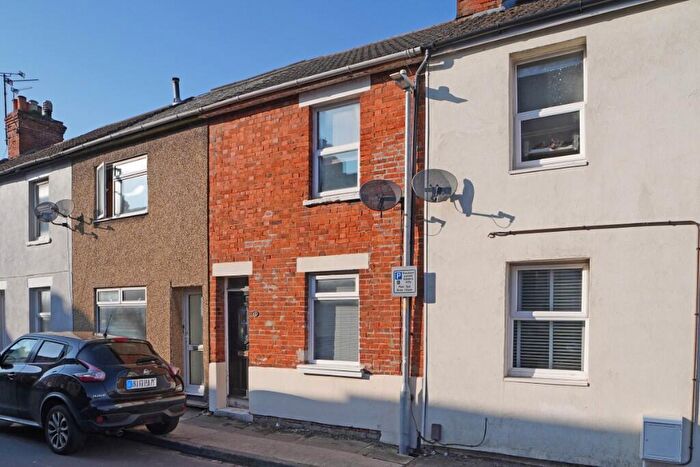
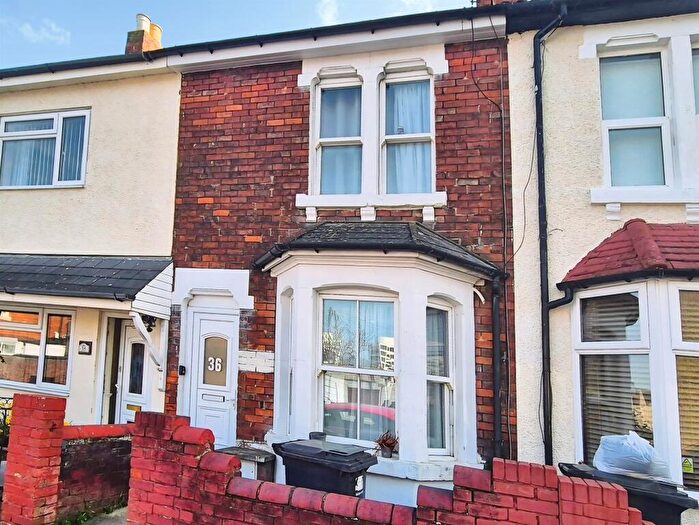
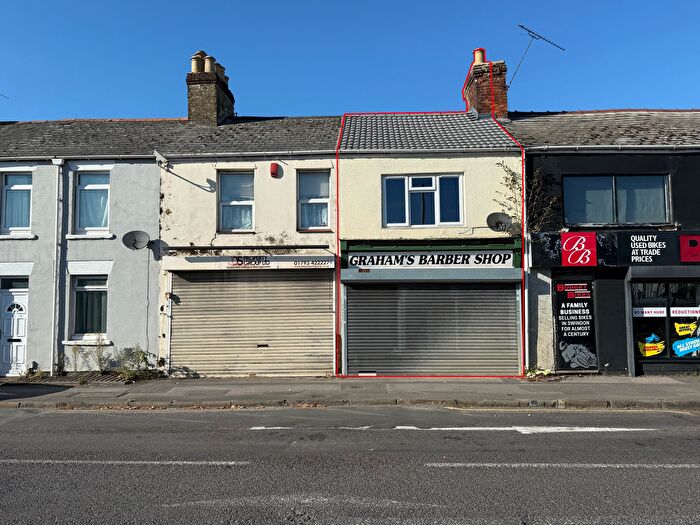
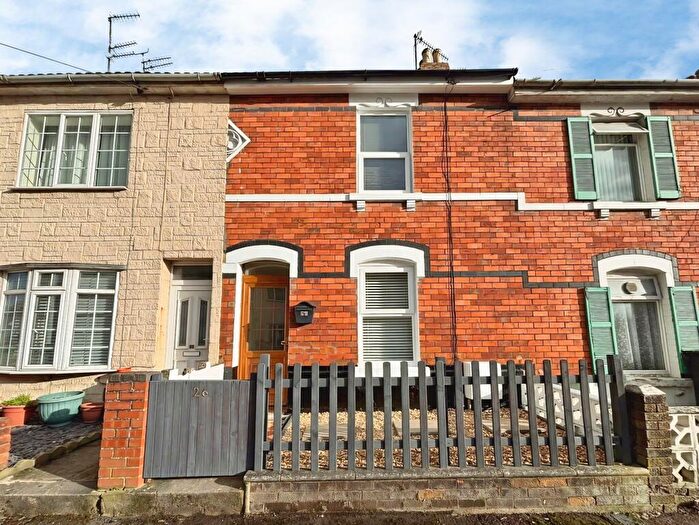
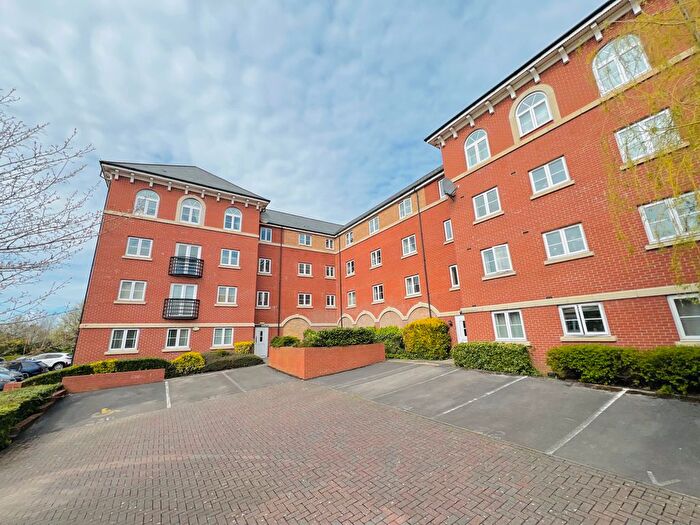
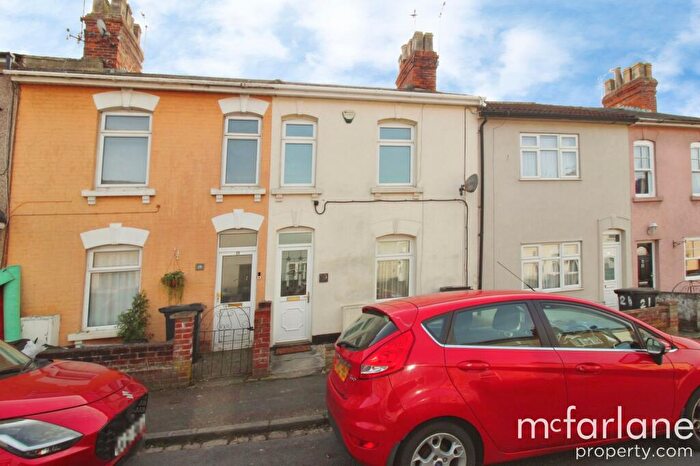
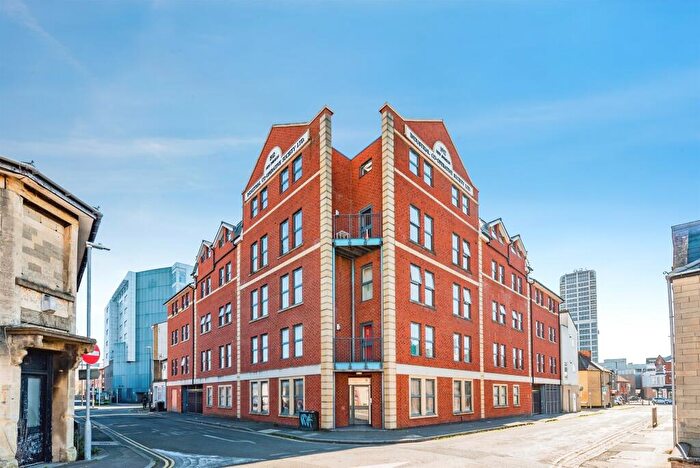
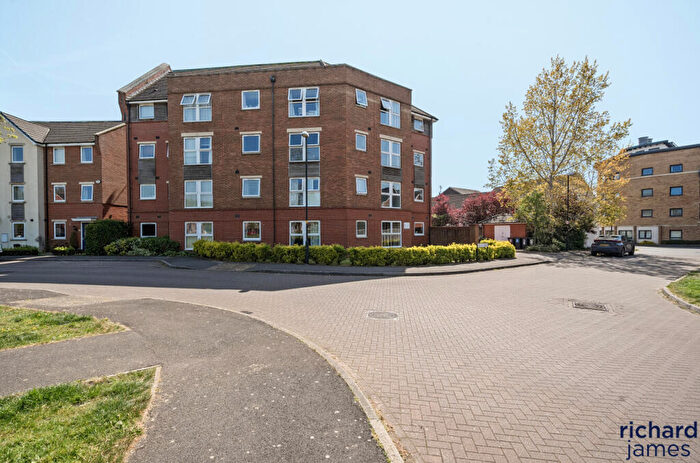
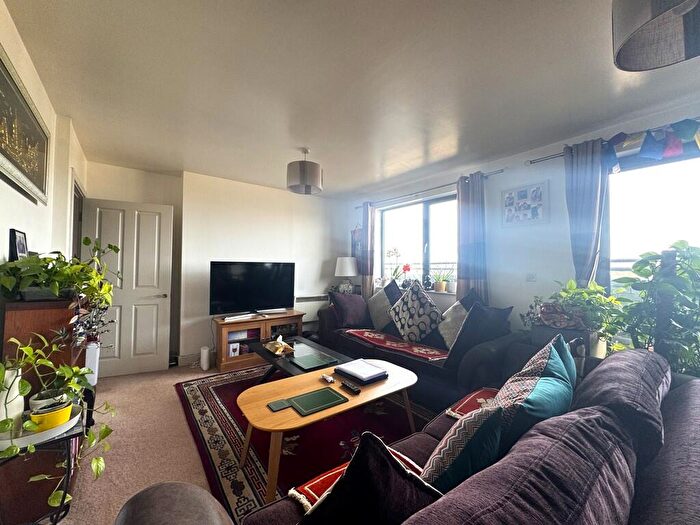
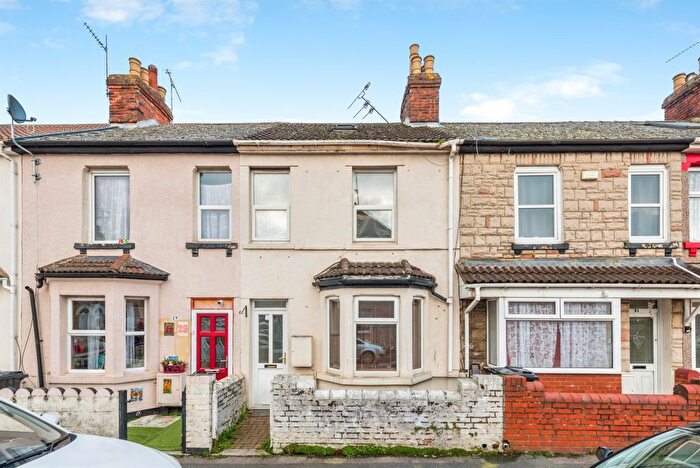
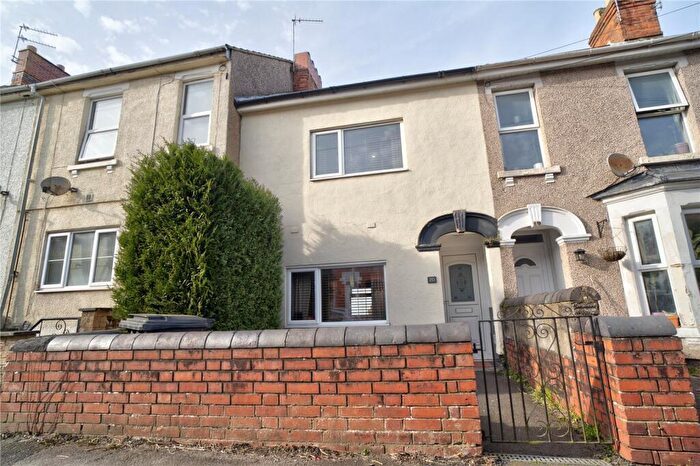
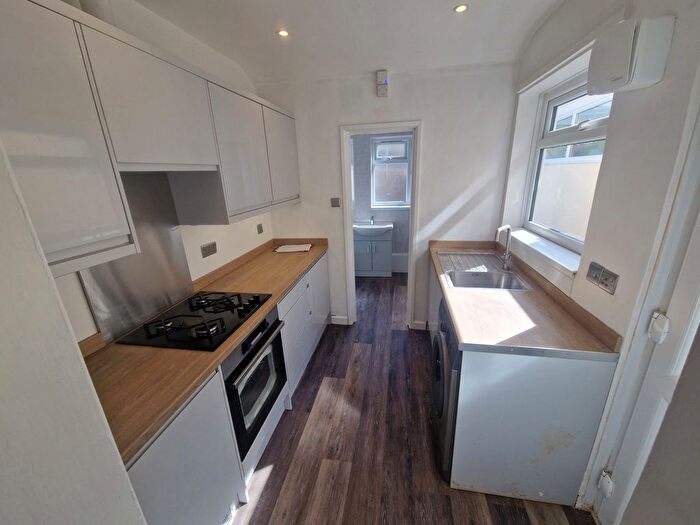
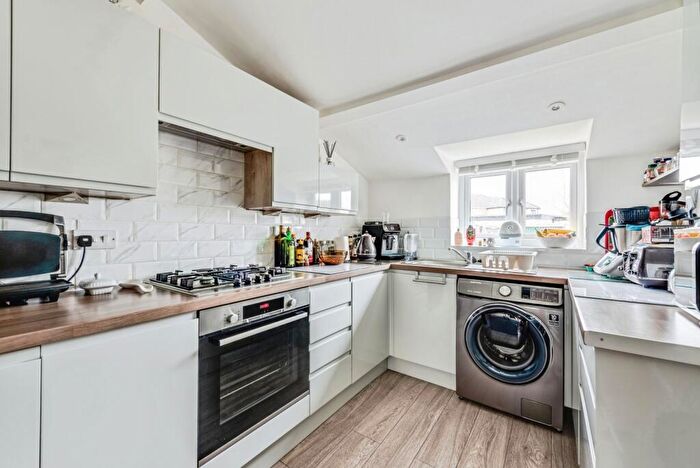
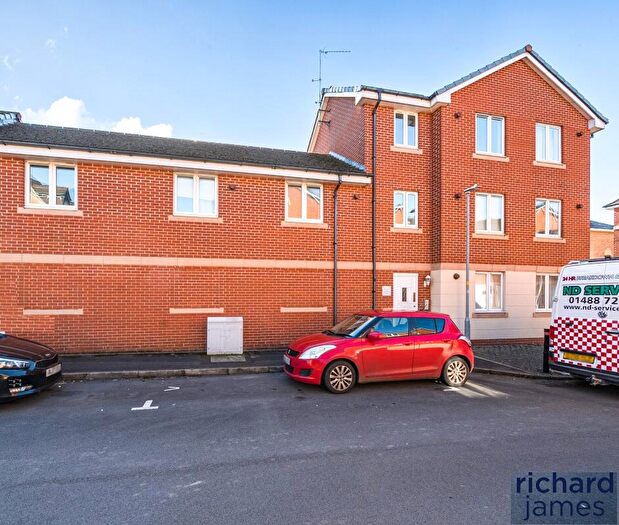
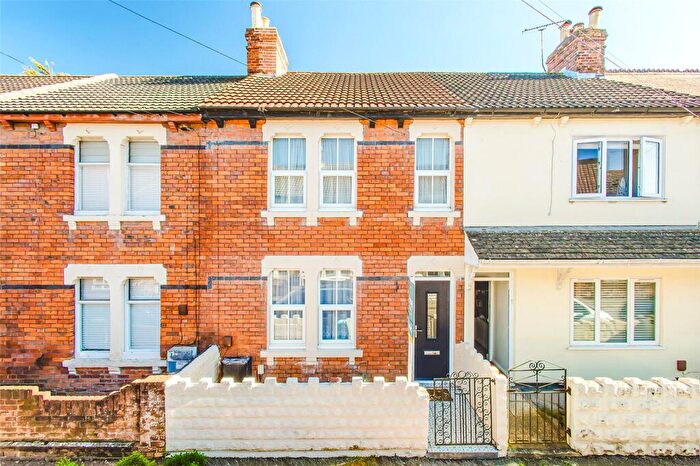
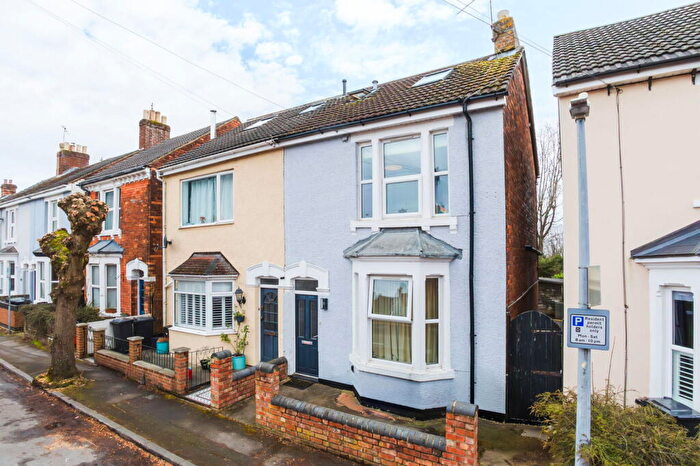
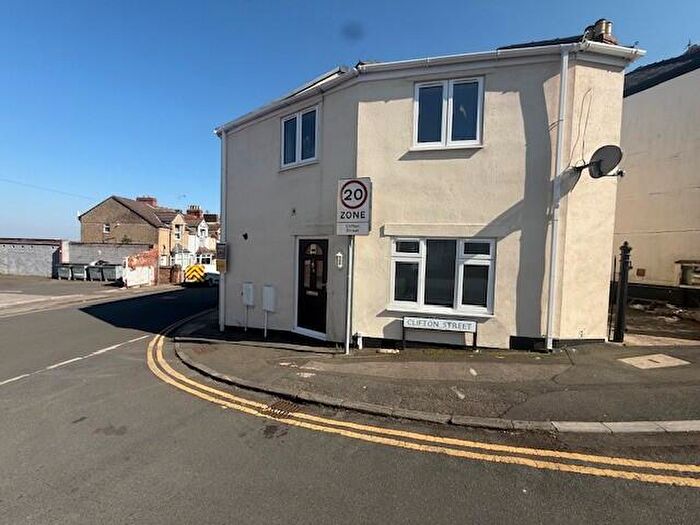
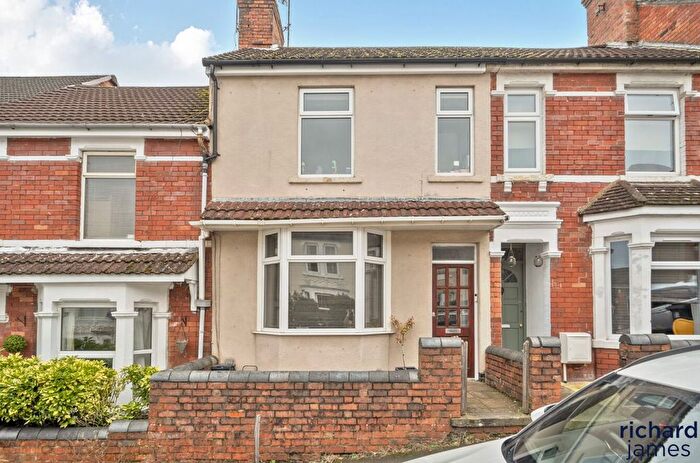
Properties for sale near SN1 5BG, Emlyn Square
![]()
If you are looking to sell your house, let it out, or receive a property valuation, an expert can help you.
Click the button below to get started.
Price Paid in Emlyn Square, SN1 5BG, Central
12A Emlyn Square, SN1 5BG, Central Swindon
Property 12A has been sold 2 times. The last time it was sold was in 23/08/2018 and the sold price was £138,000.00.
This flat, sold as a leasehold on 23/08/2018, is a 58 sqm top-floor flat with an EPC rating of D.
| Date | Price | Property Type | Tenure | Classification |
|---|---|---|---|---|
| 23/08/2018 | £138,000.00 | Flat | leasehold | Established Building |
| 31/01/2007 | £123,000.00 | Flat | leasehold | Established Building |
13A Emlyn Square, SN1 5BG, Central Swindon
Property 13A has been sold 4 times. The last time it was sold was in 15/08/2014 and the sold price was £110,000.00.
This flat, sold as a leasehold on 15/08/2014, is a 80 sqm top-floor flat with an EPC rating of E.
| Date | Price | Property Type | Tenure | Classification |
|---|---|---|---|---|
| 15/08/2014 | £110,000.00 | Flat | leasehold | Established Building |
| 03/06/2005 | £119,450.00 | Terraced House | leasehold | Established Building |
| 20/01/2004 | £105,000.00 | Terraced House | leasehold | Established Building |
| 26/03/1999 | £47,500.00 | Terraced House | leasehold | Established Building |
Postcodes in Emlyn Square, Central
Navigate through other locations in Emlyn Square, Central, Swindon to see more property listings for sale or to rent.
Transport near SN1 5BG, Emlyn Square
-
 Swindon Station
 -
Kemble Station
-
Bedwyn Station
-
Pewsey Station
-
Chippenham Station
-
Hungerford Station
-
Kintbury Station
-
Melksham Station
House price paid reports for SN1 5BG, Emlyn Square
Click on the buttons below to see price paid reports by year or property price:
- Price Paid By Year
Property Price Paid in SN1 5BG, Emlyn Square by Year
The average sold property price by year was:
| Year | Average Sold Price | Price Change |
Sold Properties
|
|---|---|---|---|
| 2018 | £138,000 | 20% |
1 Property |
| 2014 | £110,000 | -12% |
1 Property |
| 2007 | £123,000 | 3% |
1 Property |
| 2005 | £119,450 | 12% |
1 Property |
| 2004 | £105,000 | 55% |
1 Property |
| 1999 | £47,500 | - |
1 Property |