
Houses for sale & to rent in SN2 2DE, Hayle Road, Mannington And Western, Swindon
House Prices in SN2 2DE, Hayle Road, Mannington And Western
Properties in SN2 2DE have no sales history available within the last 3 years. SN2 2DE is a postcode in Hayle Road located in Mannington And Western, an area in Swindon, Swindon, with 8 households².
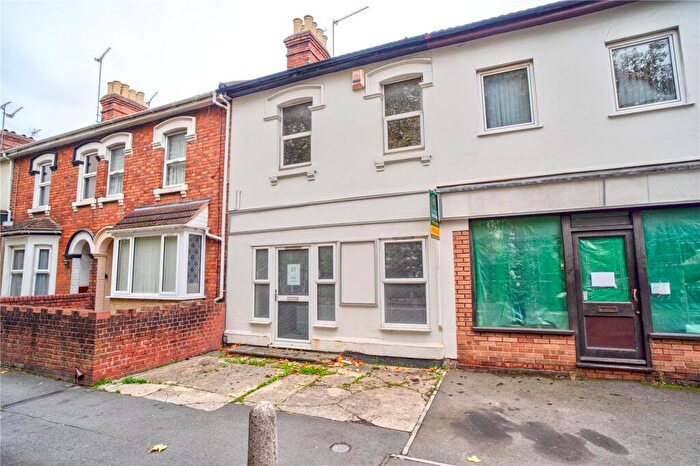
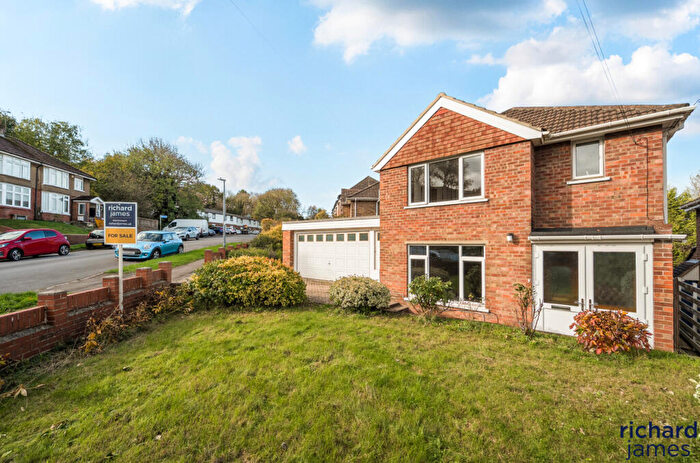
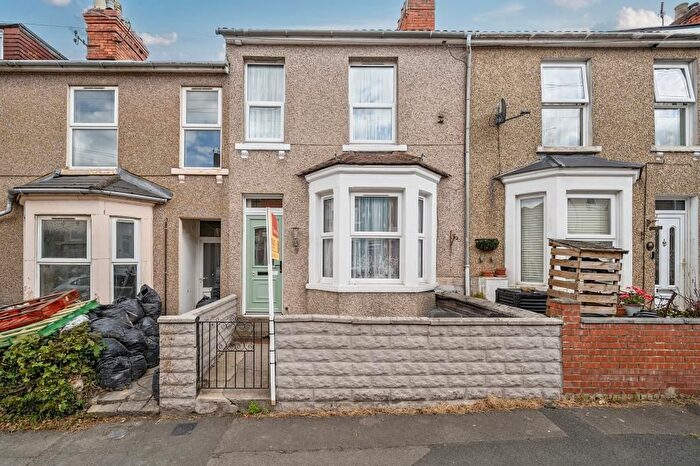
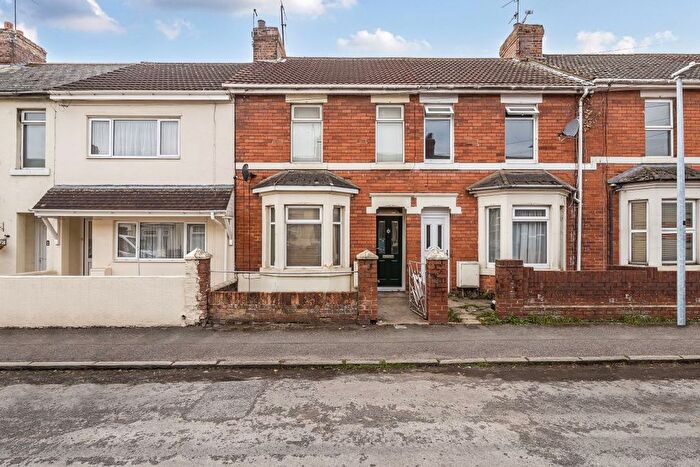
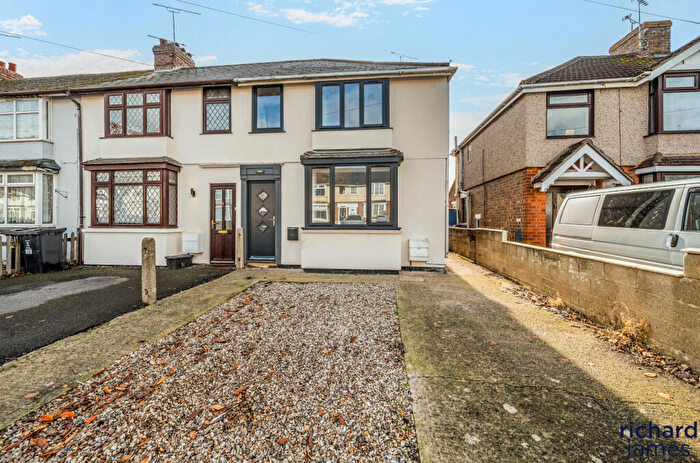
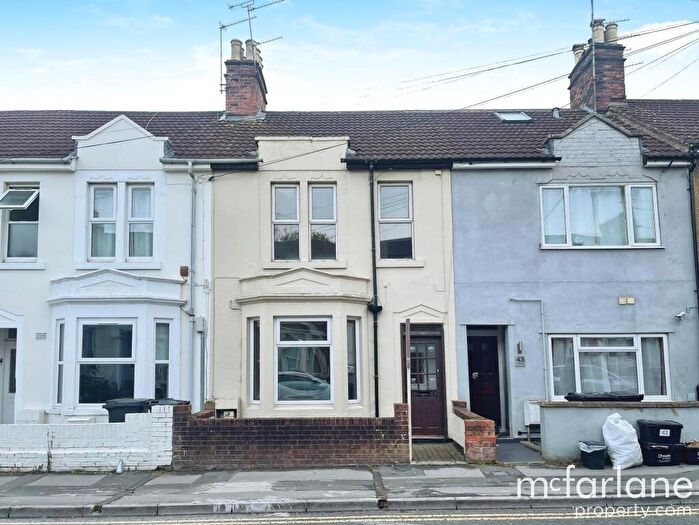
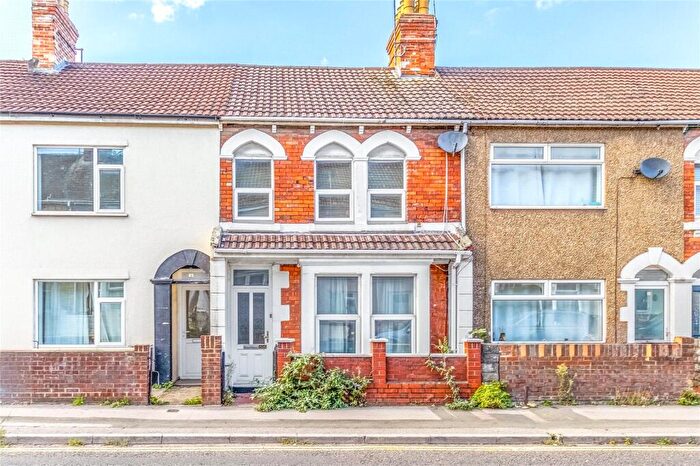
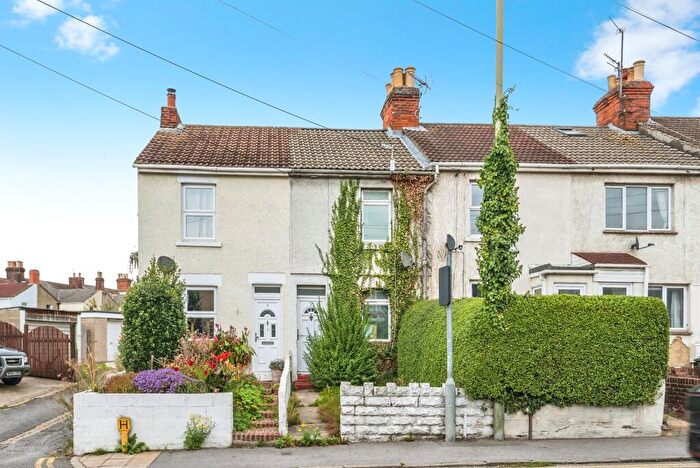
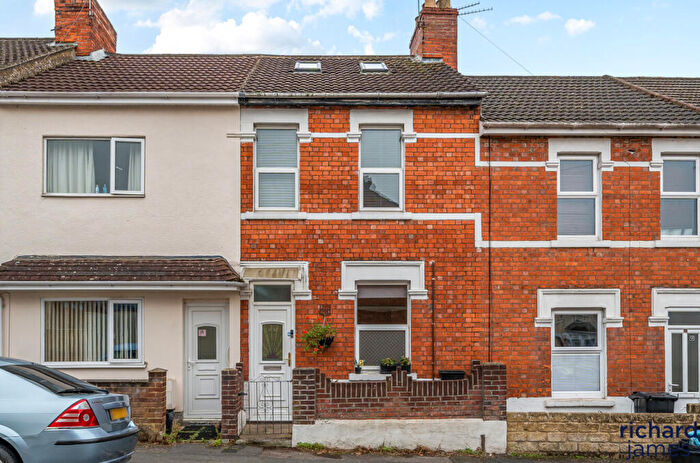
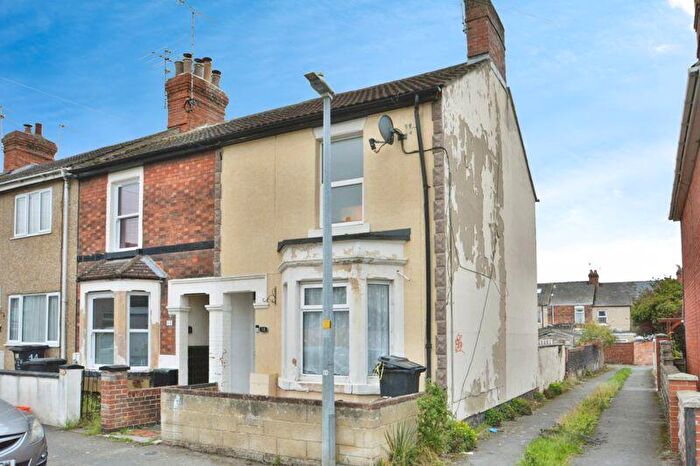
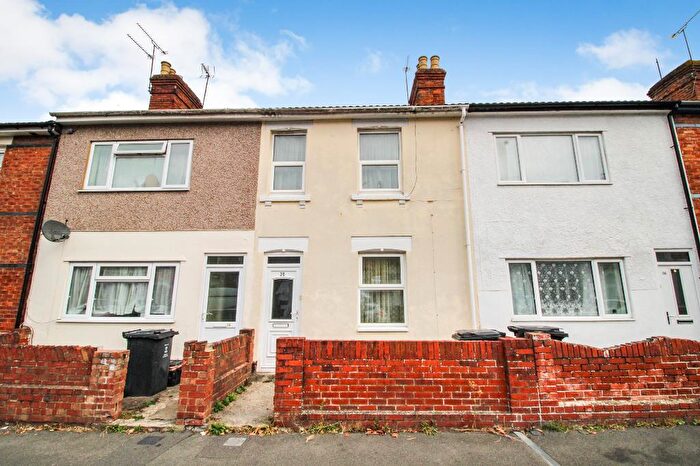
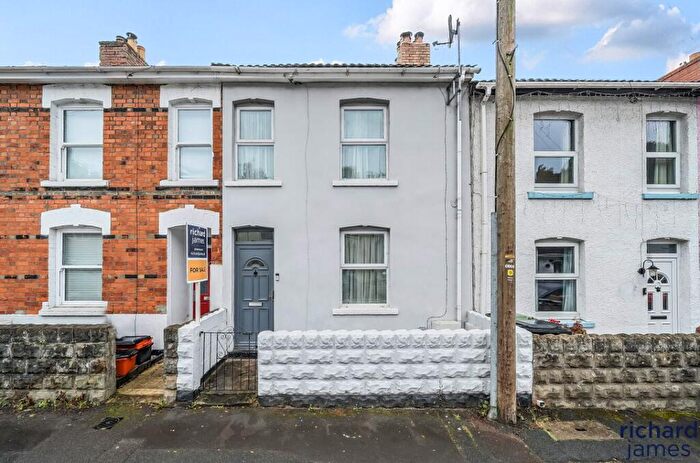
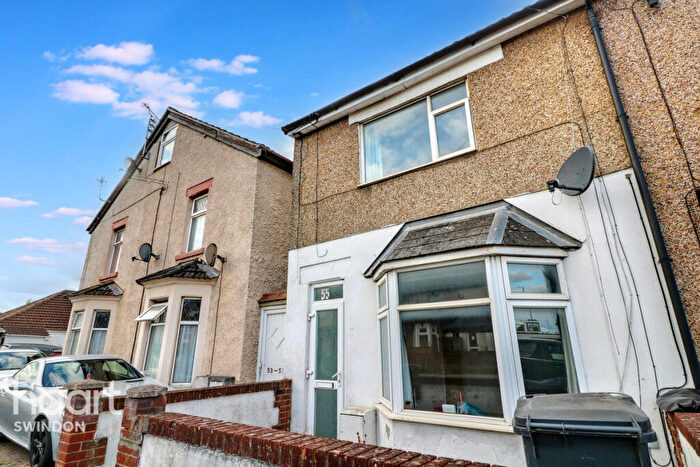
Properties for sale near SN2 2DE, Hayle Road


![]()
If you are looking to sell your house, let it out, or receive a property valuation, an expert can help you.
Click the button below to get started.


Price Paid in Hayle Road, SN2 2DE, Mannington And Western
1 Hayle Road, SN2 2DE, Mannington And Western Swindon
Property 1 has been sold 3 times. The last time it was sold was in 09/08/2019 and the sold price was £260,000.00.
This semi detached house, sold as a freehold on 09/08/2019, is a 111 sqm semi-detached house with an EPC rating of C.
| Date | Price | Property Type | Tenure | Classification |
|---|---|---|---|---|
| 09/08/2019 | £260,000.00 | Semi Detached House | freehold | Established Building |
| 05/02/2016 | £225,000.00 | Semi Detached House | freehold | Established Building |
| 18/10/2002 | £173,995.00 | Semi Detached House | freehold | New Build |
2 Hayle Road, SN2 2DE, Mannington And Western Swindon
Property 2 has been sold 4 times. The last time it was sold was in 10/02/2017 and the sold price was £266,000.00.
This semi detached house, sold as a freehold on 10/02/2017, is a 112 sqm semi-detached house with an EPC rating of C.
| Date | Price | Property Type | Tenure | Classification |
|---|---|---|---|---|
| 10/02/2017 | £266,000.00 | Semi Detached House | freehold | Established Building |
| 10/10/2014 | £214,000.00 | Semi Detached House | freehold | Established Building |
| 21/09/2006 | £192,500.00 | Semi Detached House | freehold | Established Building |
| 23/10/2002 | £175,995.00 | Semi Detached House | freehold | New Build |
Transport near SN2 2DE, Hayle Road
-
 Swindon Station
 -
Kemble Station
-
Chippenham Station
-
Pewsey Station
-
Bedwyn Station
-
Hungerford Station
-
Kintbury Station
-
Melksham Station
House price paid reports for SN2 2DE, Hayle Road
Click on the buttons below to see price paid reports by year or property price:
- Price Paid By Year
Property Price Paid in SN2 2DE, Hayle Road by Year
The average sold property price by year was:
| Year | Average Sold Price | Price Change |
Sold Properties
|
|---|---|---|---|
| 2019 | £260,000 | -2% |
1 Property |
| 2017 | £266,000 | 15% |
1 Property |
| 2016 | £225,000 | 5% |
1 Property |
| 2014 | £214,000 | 10% |
1 Property |
| 2006 | £192,500 | 9% |
1 Property |
| 2002 | £174,995 | - |
2 Properties |