
Houses for sale in Ashton-under-lyne, Tameside
House Prices in Ashton-under-lyne
Properties in Ashton-under-lyne have an average house price of £195k and had 2,222 Property Transactions within the last 3 years.¹
Ashton-under-lyne is an area in Tameside with 25,601 households², where the most expensive property was sold for £900k.
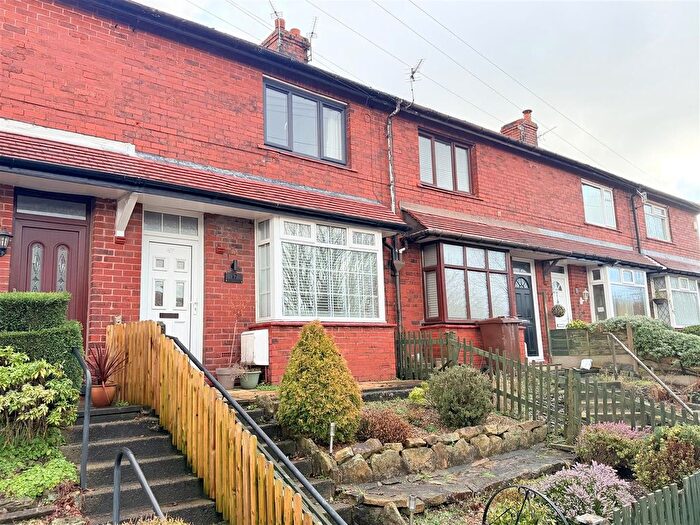
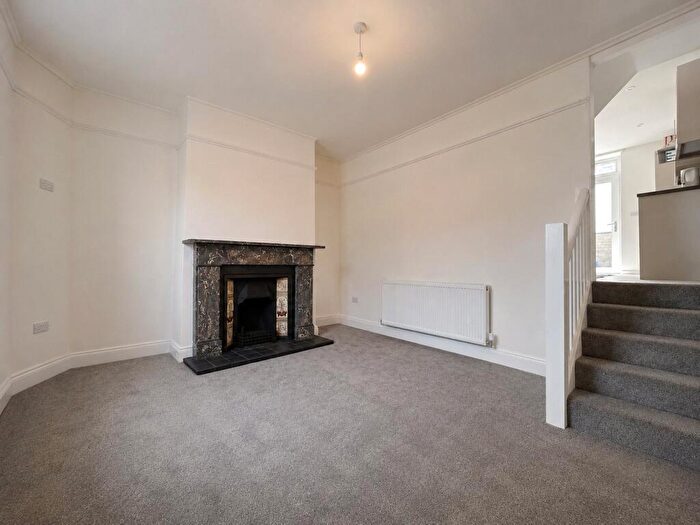
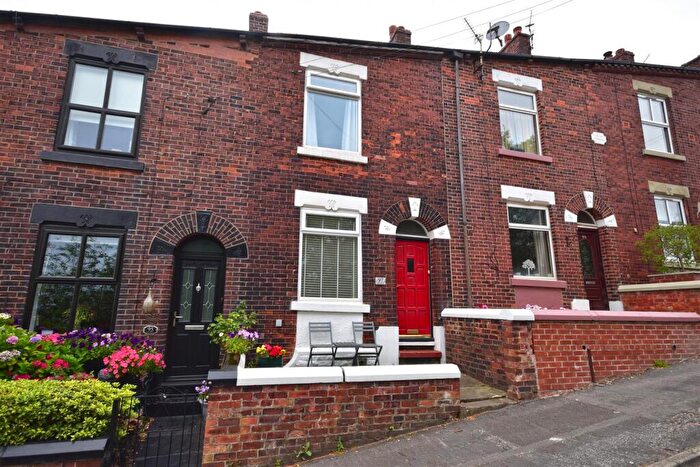
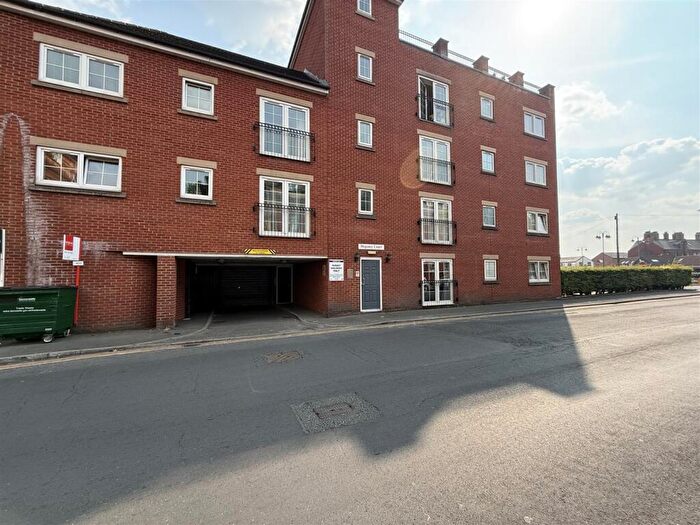
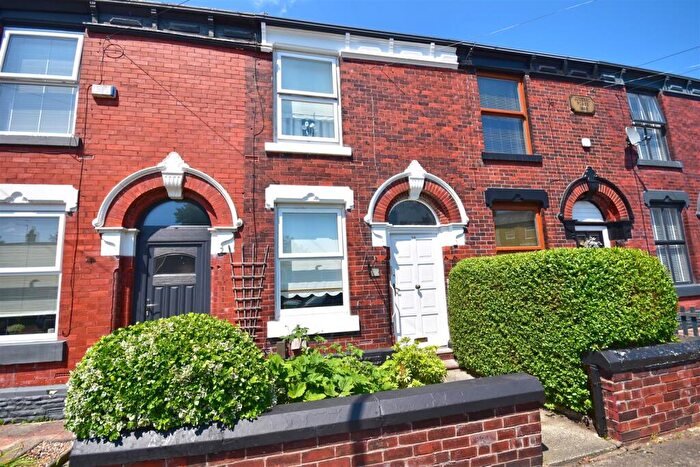
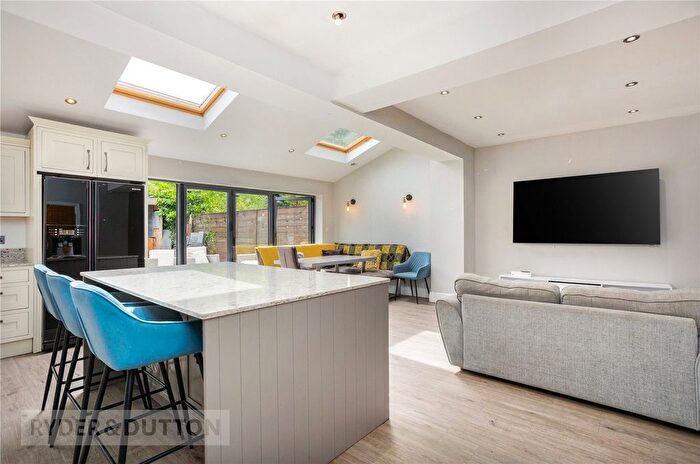
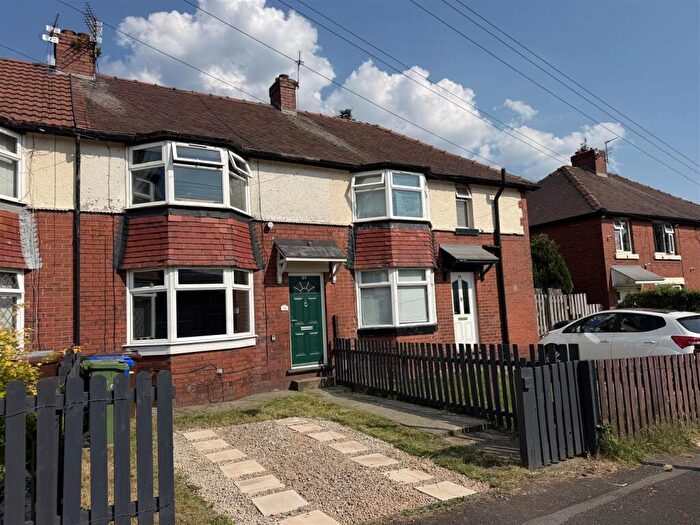
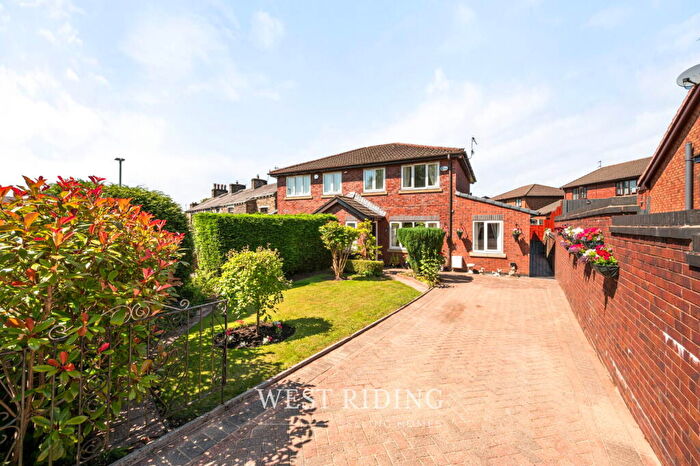
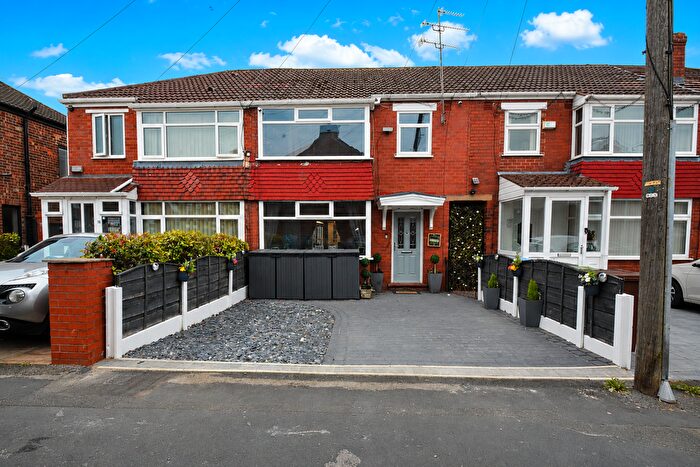
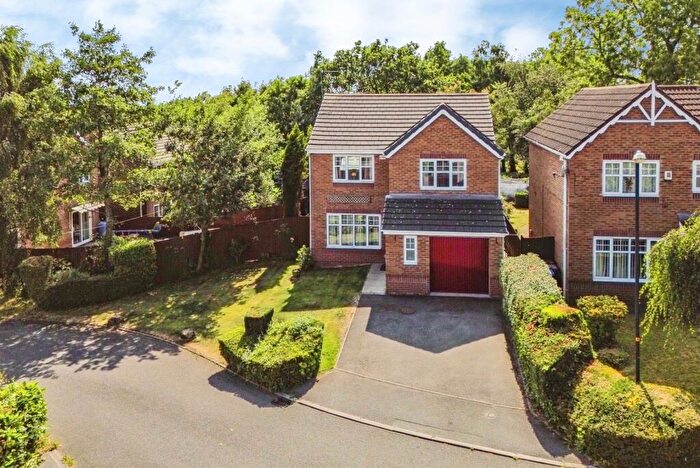
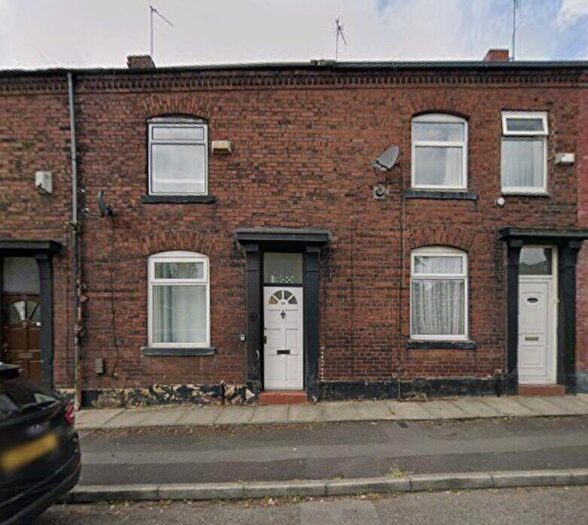
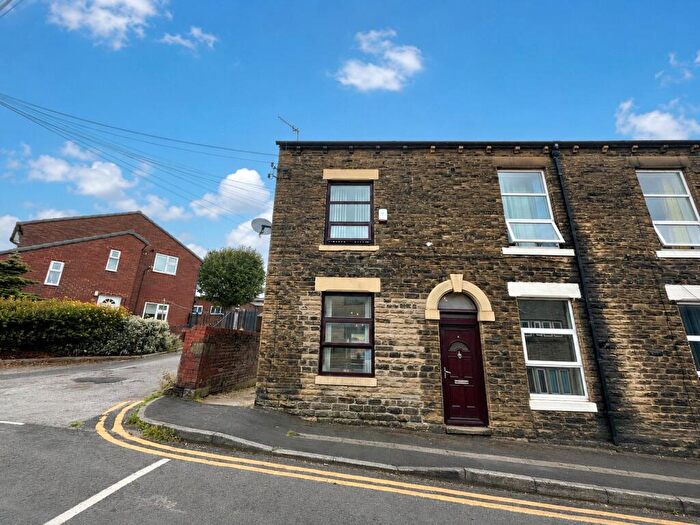
Properties for sale in Ashton-under-lyne
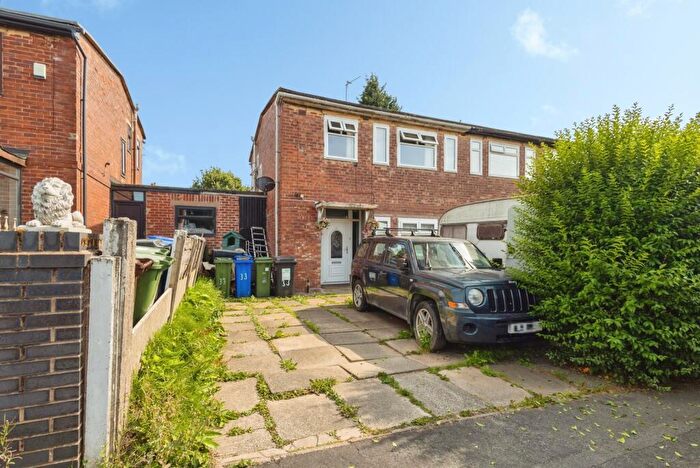
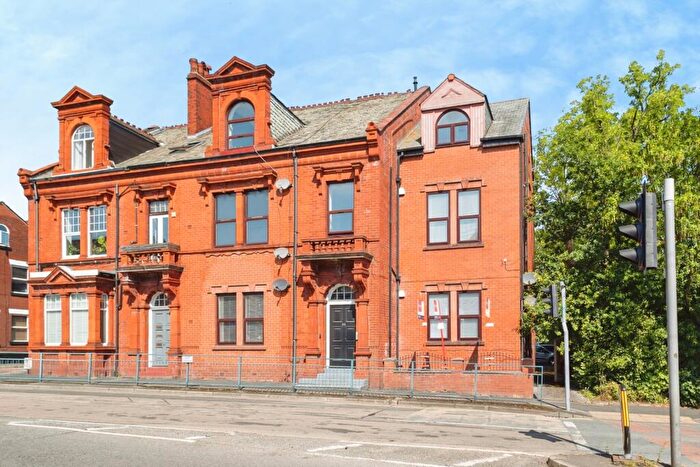
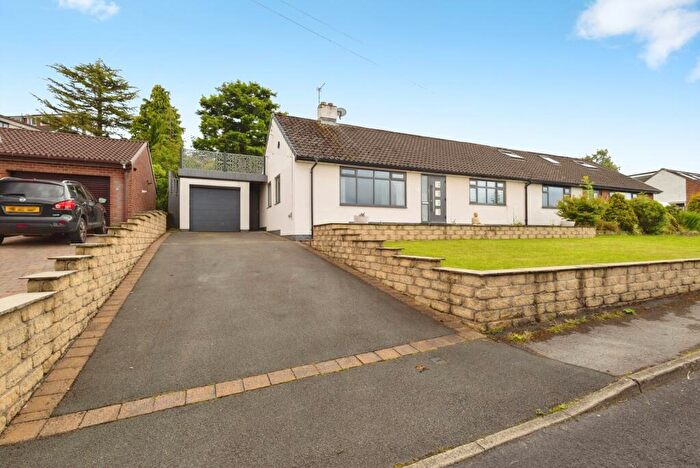
![]()
If you are looking to sell your house, let it out, or receive a property valuation, an expert can help you.
Click the button below to get started.
Neighbourhoods in Ashton-under-lyne
Navigate through our locations to find the location of your next house in Ashton-under-lyne, Tameside for sale or to rent.
Property price trends in Ashton-under-lyne
According to the latest Land Registry data, the average home in Ashton-under-lyne sold for £172,335 in 2026. That figure comes from a substantial record of 27,572 sales logged over the past 31 years.
Prices have fallen back over the last three years. Compared with 2023, when the typical sale came in around £190,621, that's a fall of roughly 9.6%.
Looking back five years, average prices are up about 1.3% since 2021, a gain of around £2,179 in cash terms.
Zoom out to the past decade for the fuller picture. Back in 2016, homes here averaged £126,543, so the typical sold price has climbed about 36.2% since then, roughly 3.1% a year. Stretch the view to fifteen years and that annual pace holds at about 3.2%.
Frequently asked questions about Ashton-under-lyne
What is the average price for a property for sale in Ashton-under-lyne?
The average price for a property for sale in Ashton-under-lyne is £195,116. This amount is 8% lower than the average price in Tameside. There are 8,917 property listings for sale in Ashton-under-lyne.
What locations have the most expensive properties for sale in Ashton-under-lyne?
The locations with the most expensive properties for sale in Ashton-under-lyne are Ashton Hurst at an average of £236,819, Mossley at an average of £209,495 and Ashton Waterloo at an average of £205,366.
What locations have the most affordable properties for sale in Ashton-under-lyne?
The locations with the most affordable properties for sale in Ashton-under-lyne are St Peters at an average of £151,046 and Ashton St Michaels at an average of £172,821.
Which train stations are available in or near Ashton-under-lyne?
Some of the train stations available in or near Ashton-under-lyne are Ashton-Under-Lyne, Stalybridge and Mossley (Greater Manchester).
Property Price Paid in Ashton-under-lyne by Year
The average sold property price by year was:
| Year | Average Sold Price | Price Change |
Sold Properties
|
|---|---|---|---|
| 2026 | £172,335 | -19% |
45 Properties |
| 2025 | £204,878 | 6% |
682 Properties |
| 2024 | £192,007 | 1% |
785 Properties |
| 2023 | £190,621 | 3% |
710 Properties |
| 2022 | £184,586 | 8% |
876 Properties |
| 2021 | £170,156 | 6% |
1,088 Properties |
| 2020 | £160,068 | 12% |
700 Properties |
| 2019 | £141,210 | 3% |
737 Properties |
| 2018 | £136,434 | -1% |
839 Properties |
| 2017 | £137,631 | 8% |
891 Properties |
Property Price per Property Type in Ashton-under-lyne
Here you can find historic sold price data in order to help with your property search.
The average Property Paid Price for specific property types in the last three years are:
| Property Type | Average Sold Price | Sold Properties |
|---|---|---|
| Semi Detached House | £233,581.00 | 634 Semi Detached Houses |
| Terraced House | £159,235.00 | 1,231 Terraced Houses |
| Detached House | £347,080.00 | 207 Detached Houses |
| Flat | £117,298.00 | 150 Flats |
Transport in Ashton-under-lyne
Please see below transportation links in this area:
