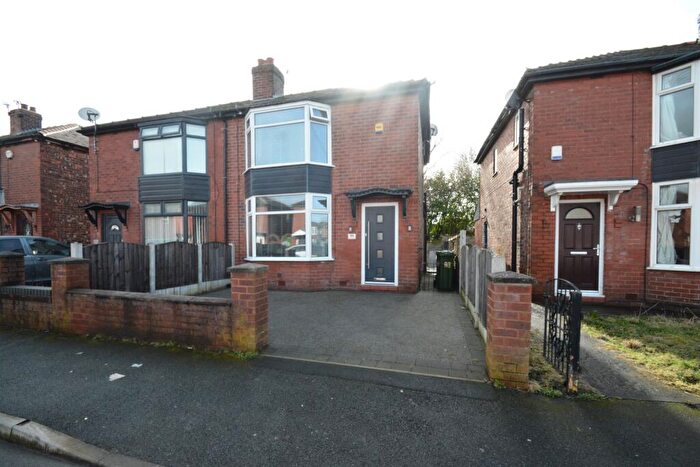
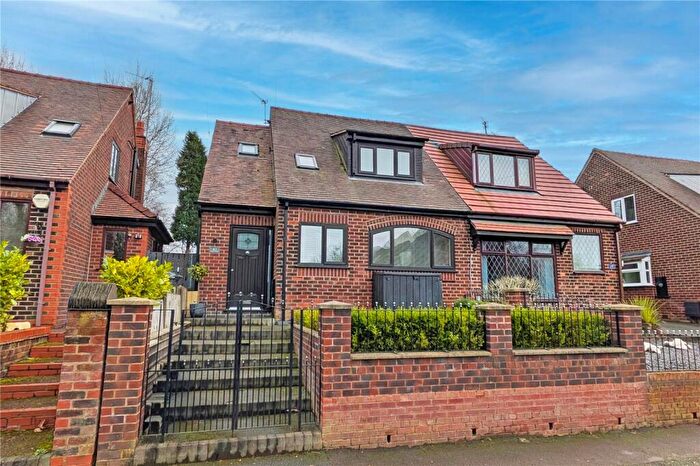
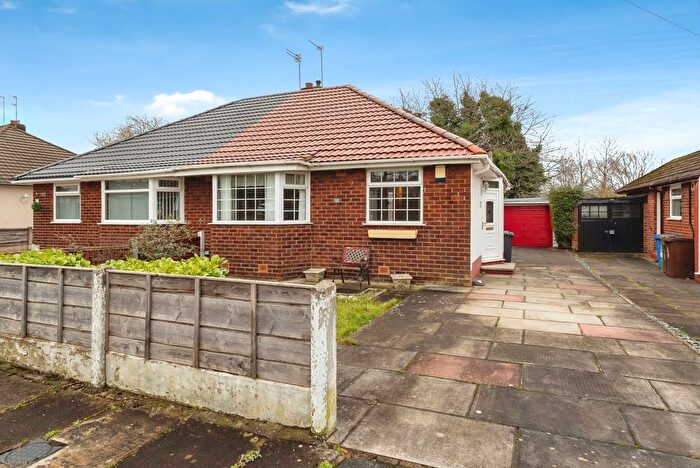
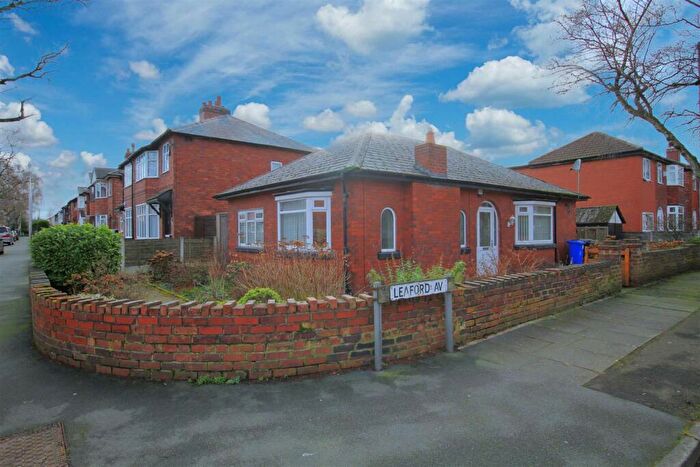
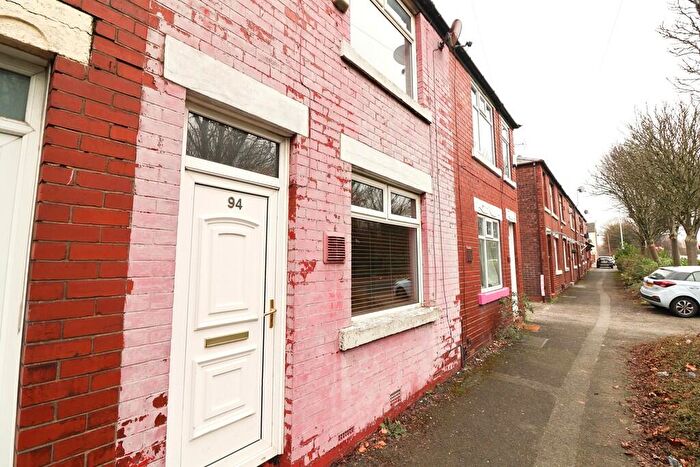
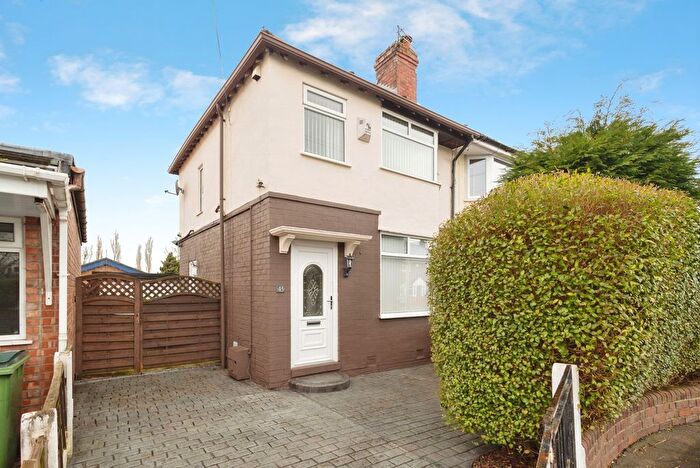
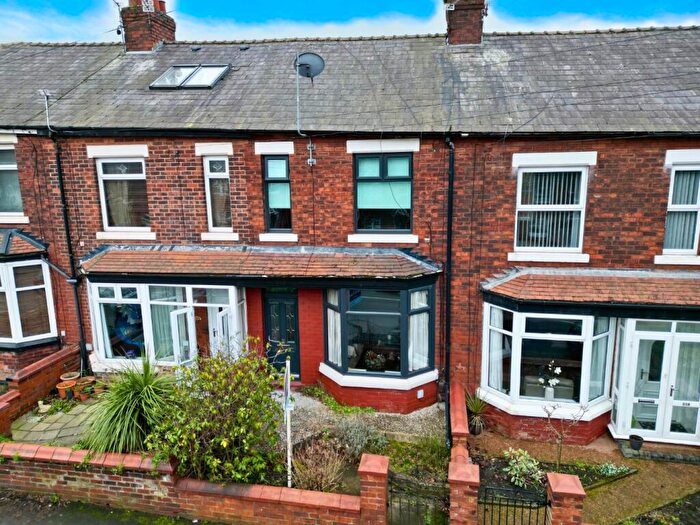
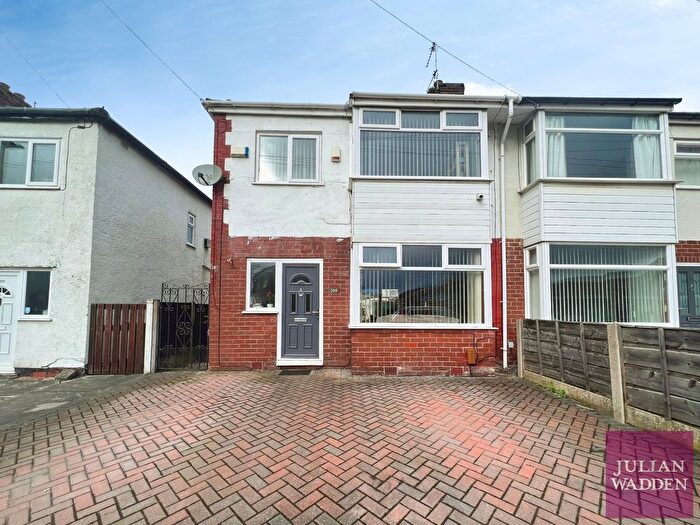
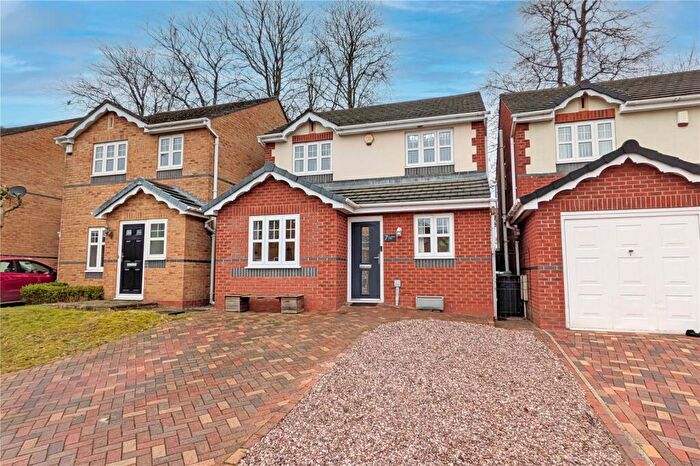
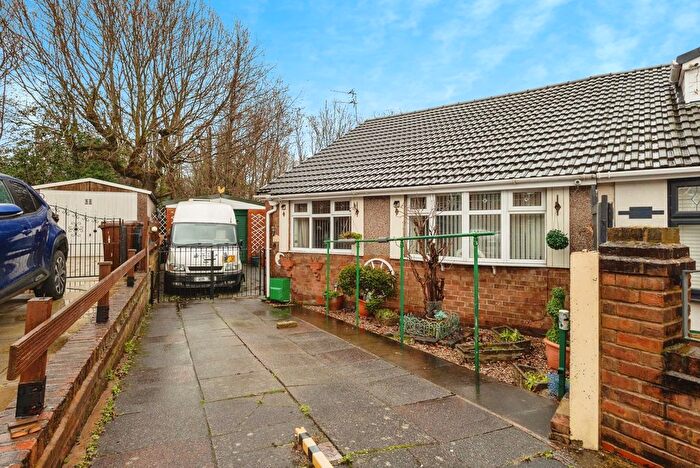
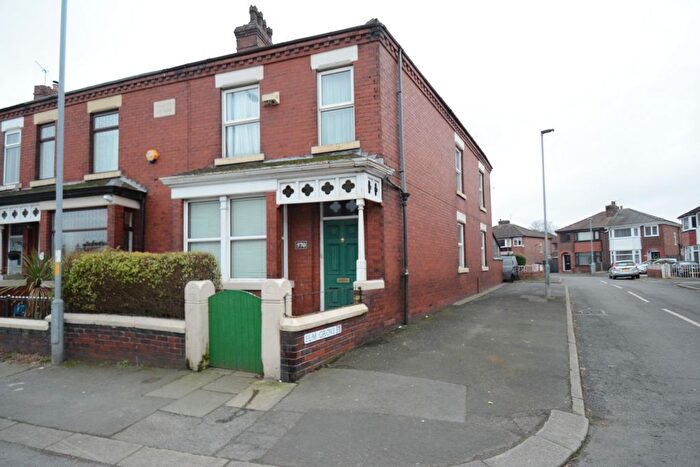
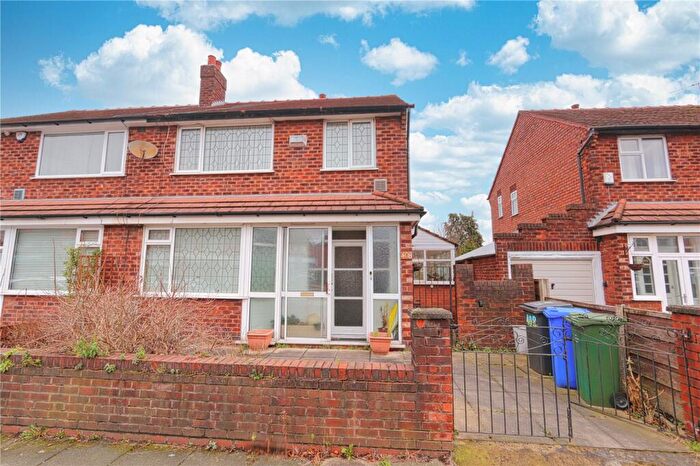
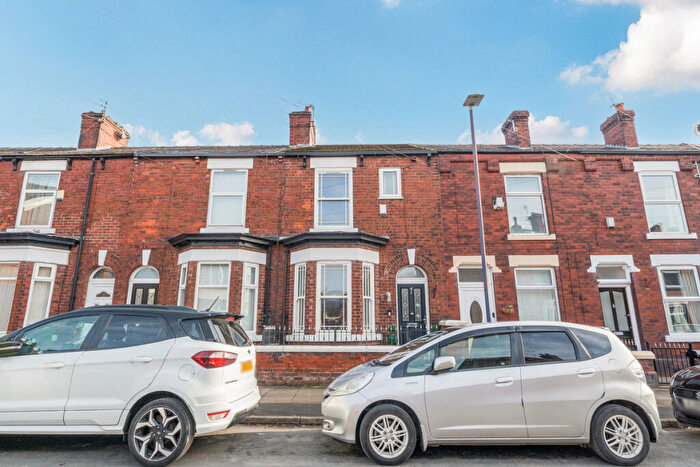
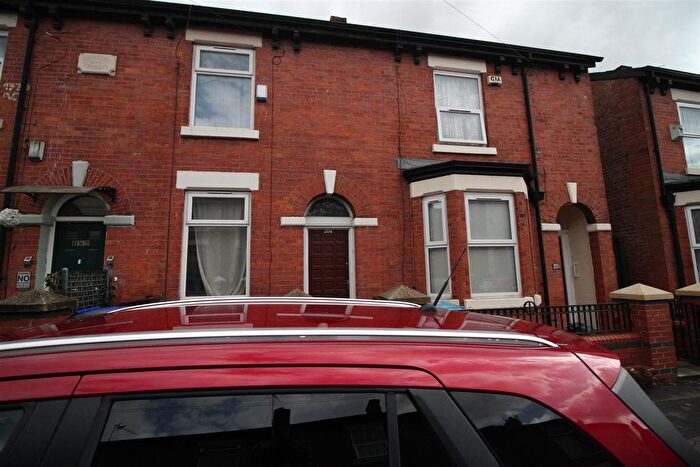
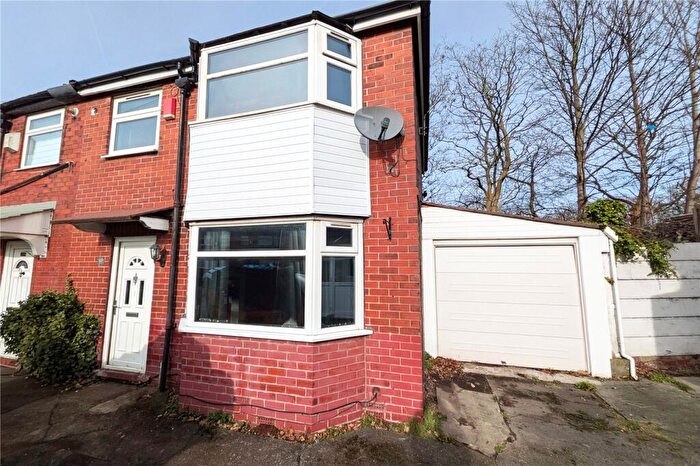
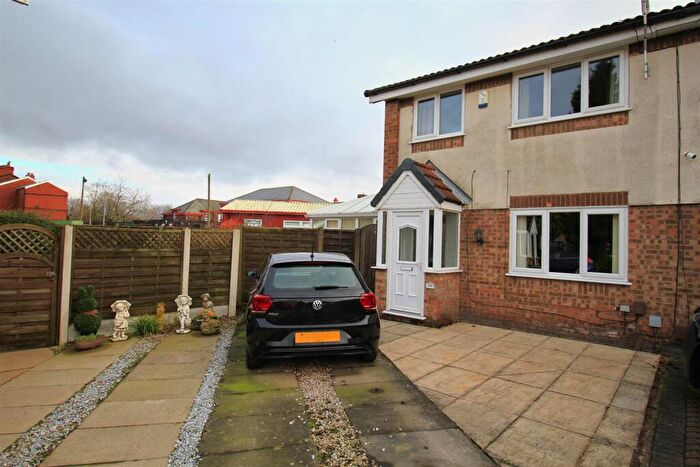
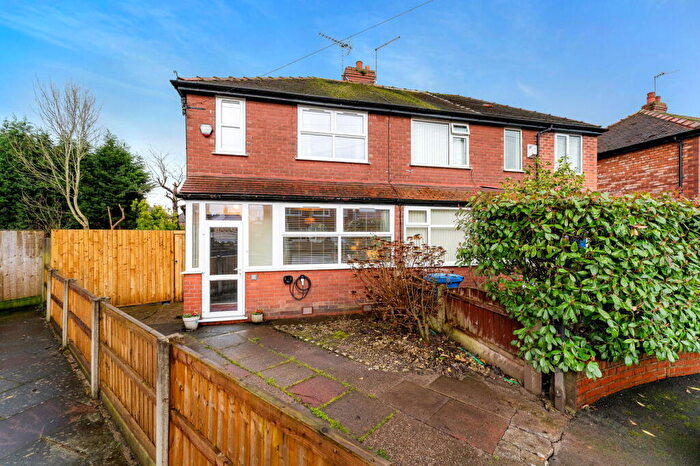
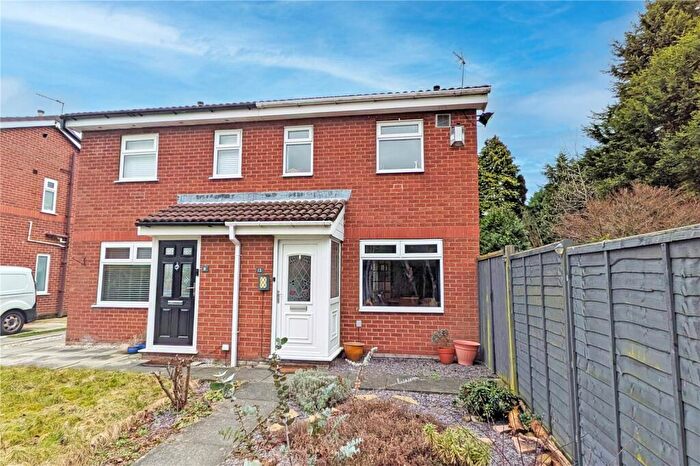
Houses for sale & to rent in Manchester, Tameside
House Prices in Manchester
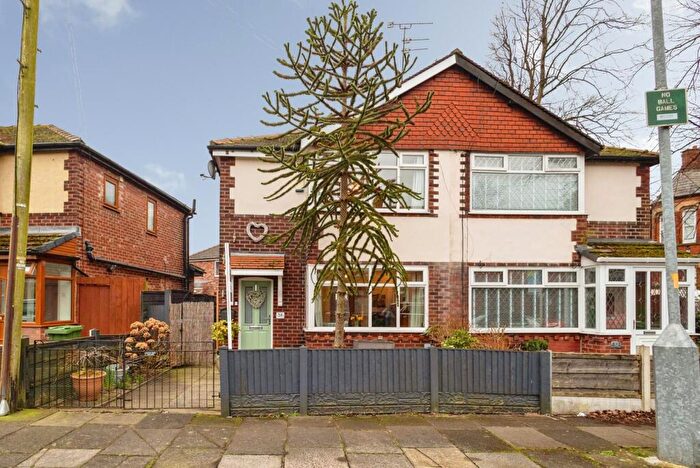
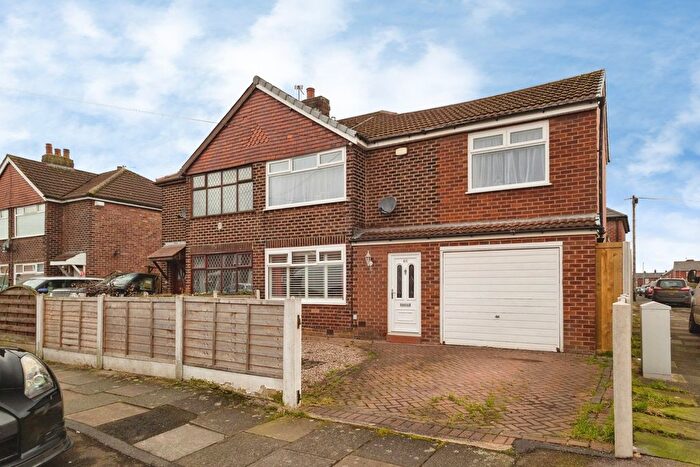
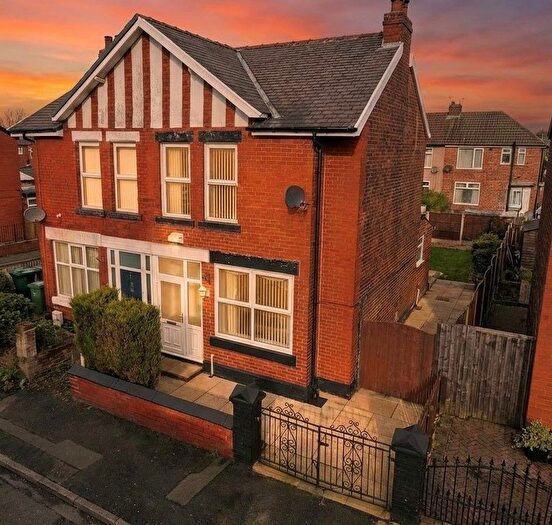
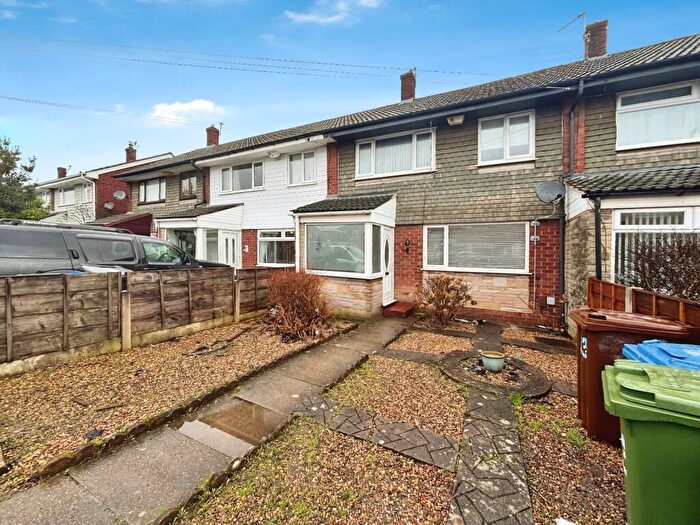
Properties in Manchester have an average house price of £213,004.00 and had 2,667 Property Transactions within the last 3 years.¹
Manchester is an area in Tameside with 30,347 households², where the most expensive property was sold for £637,500.00.
Properties for sale in Manchester
Neighbourhoods in Manchester
Navigate through our locations to find the location of your next house in Manchester, Tameside for sale or to rent.
Transport in Manchester
Please see below transportation links in this area:
-
Denton Station
-
Fairfield Station
-
Guide Bridge Station
-
Gorton Station
-
Reddish North Station
-
Hyde North Station
-
Ryder Brow Station
-
Flowery Field Station
-
Hyde Central Station
-
Belle Vue Station
- FAQ
- Price Paid By Year
- Property Type Price
Frequently asked questions about Manchester
What is the average price for a property for sale in Manchester?
The average price for a property for sale in Manchester is £213,004. This amount is 1% higher than the average price in Tameside. There are 9,040 property listings for sale in Manchester.
What locations have the most expensive properties for sale in Manchester?
The locations with the most expensive properties for sale in Manchester are Audenshaw at an average of £238,503, Denton West at an average of £229,089 and Denton South at an average of £204,807.
What locations have the most affordable properties for sale in Manchester?
The locations with the most affordable properties for sale in Manchester are St Peters at an average of £187,826, Denton North East at an average of £198,216 and Droylsden West at an average of £201,108.
Which train stations are available in or near Manchester?
Some of the train stations available in or near Manchester are Denton, Fairfield and Guide Bridge.
Property Price Paid in Manchester by Year
The average sold property price by year was:
| Year | Average Sold Price | Price Change |
Sold Properties
|
|---|---|---|---|
| 2025 | £217,160 | 1% |
725 Properties |
| 2024 | £215,629 | 4% |
993 Properties |
| 2023 | £207,082 | 1% |
949 Properties |
| 2022 | £204,420 | 10% |
1,203 Properties |
| 2021 | £184,561 | 7% |
1,419 Properties |
| 2020 | £172,265 | 7% |
936 Properties |
| 2019 | £159,940 | 4% |
1,154 Properties |
| 2018 | £153,862 | 4% |
1,318 Properties |
| 2017 | £147,980 | 8% |
1,271 Properties |
| 2016 | £136,025 | 7% |
1,102 Properties |
| 2015 | £126,620 | 5% |
1,012 Properties |
| 2014 | £120,077 | 1% |
939 Properties |
| 2013 | £119,394 | 4% |
775 Properties |
| 2012 | £115,135 | -4% |
672 Properties |
| 2011 | £119,921 | 5% |
700 Properties |
| 2010 | £113,617 | 1% |
697 Properties |
| 2009 | £112,999 | -7% |
581 Properties |
| 2008 | £121,110 | -8% |
707 Properties |
| 2007 | £130,340 | 6% |
1,466 Properties |
| 2006 | £122,211 | 9% |
1,458 Properties |
| 2005 | £110,801 | 11% |
939 Properties |
| 2004 | £98,477 | 18% |
1,383 Properties |
| 2003 | £81,066 | 23% |
1,644 Properties |
| 2002 | £62,327 | 13% |
1,543 Properties |
| 2001 | £54,362 | 4% |
1,413 Properties |
| 2000 | £52,278 | 9% |
1,425 Properties |
| 1999 | £47,730 | 7% |
1,168 Properties |
| 1998 | £44,389 | -1% |
1,094 Properties |
| 1997 | £44,969 | 6% |
1,295 Properties |
| 1996 | £42,246 | 3% |
1,064 Properties |
| 1995 | £41,040 | - |
954 Properties |
Property Price per Property Type in Manchester
Here you can find historic sold price data in order to help with your property search.
The average Property Paid Price for specific property types in the last three years are:
| Property Type | Average Sold Price | Sold Properties |
|---|---|---|
| Semi Detached House | £230,313.00 | 1,231 Semi Detached Houses |
| Terraced House | £181,123.00 | 1,066 Terraced Houses |
| Detached House | £326,745.00 | 223 Detached Houses |
| Flat | £126,701.00 | 147 Flats |

