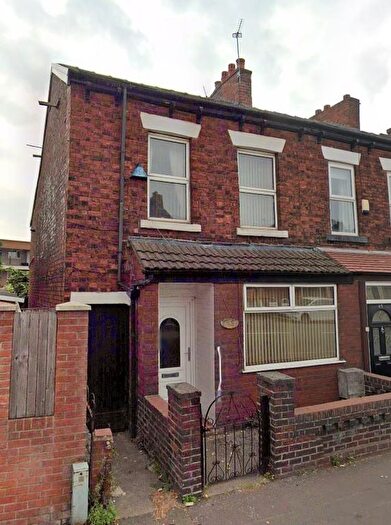
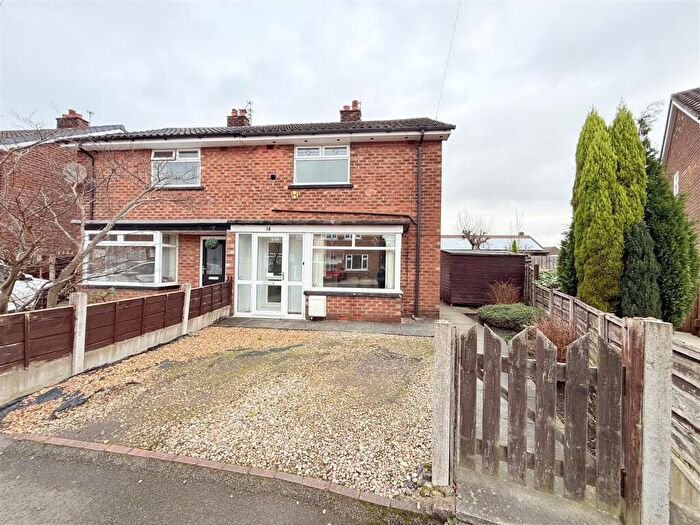
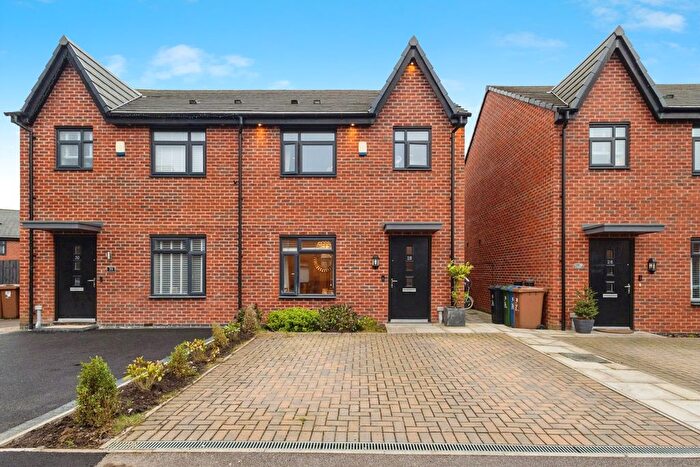
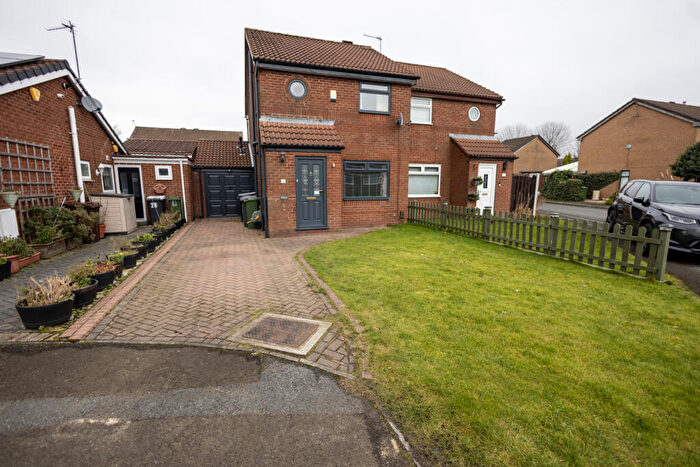
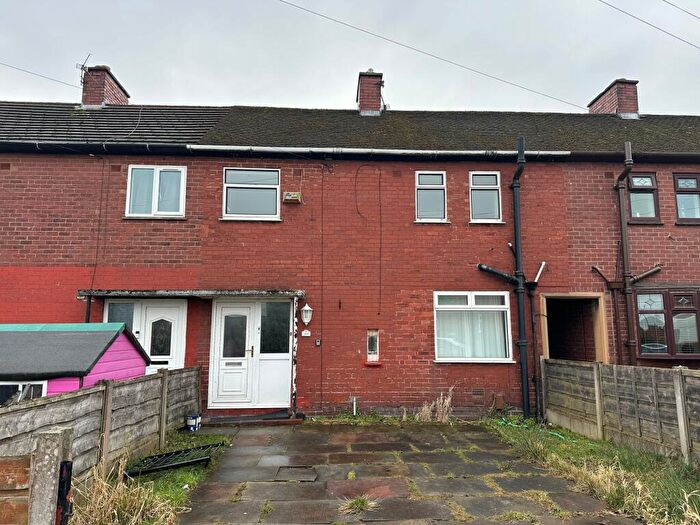
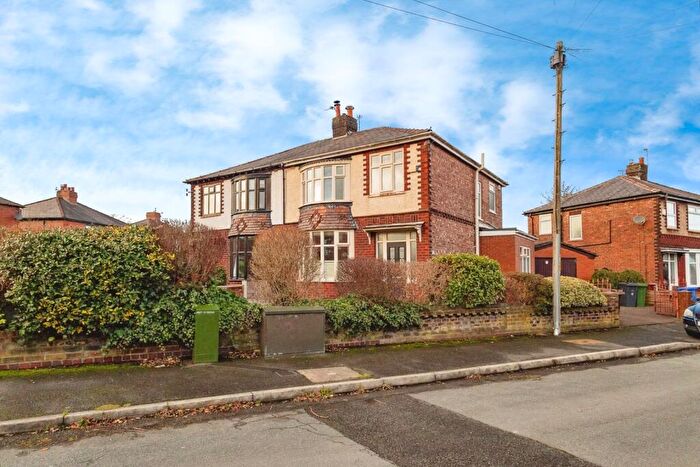
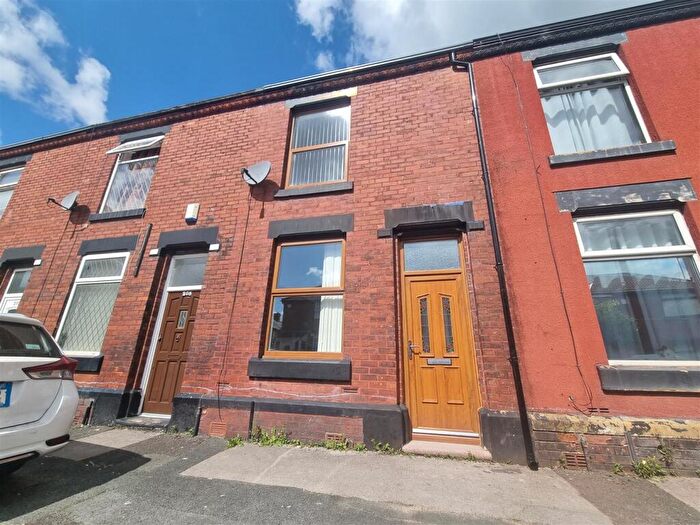
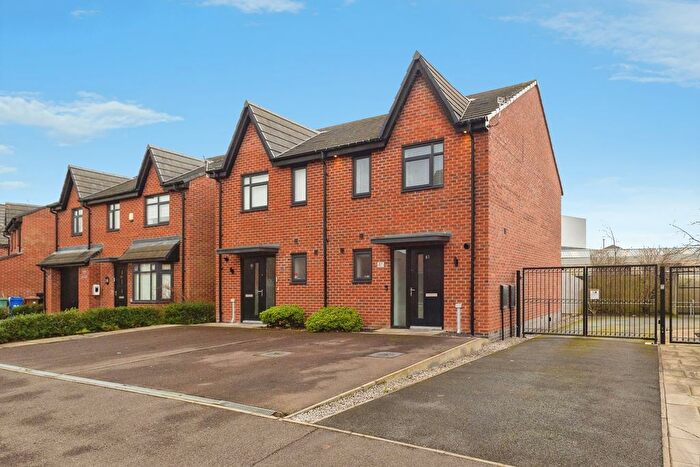
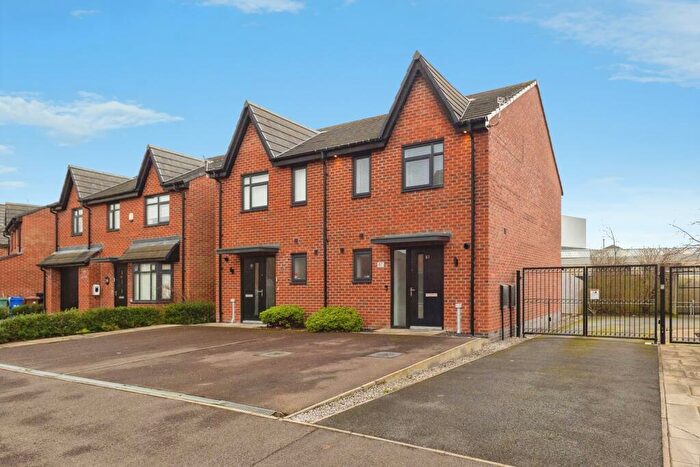
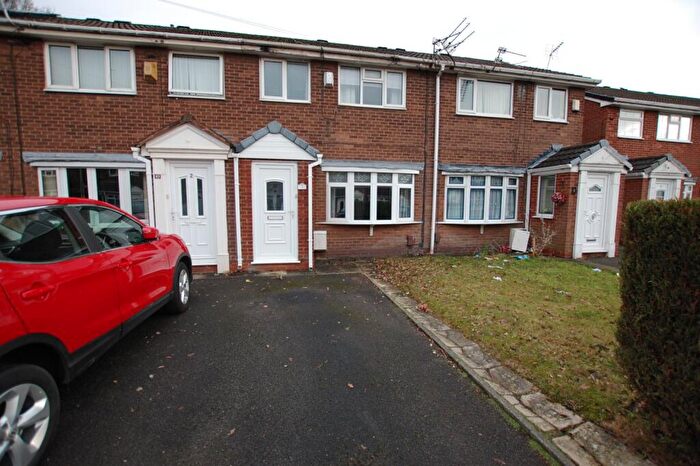
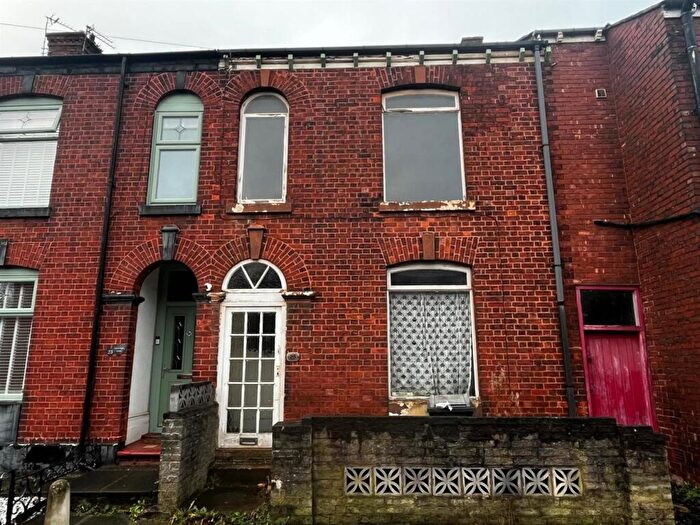
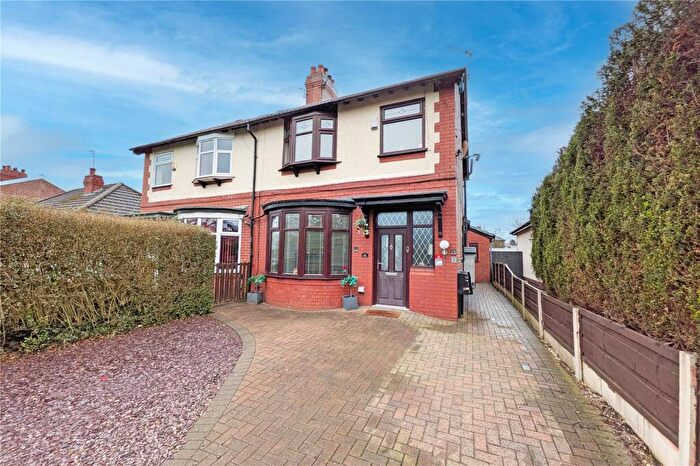
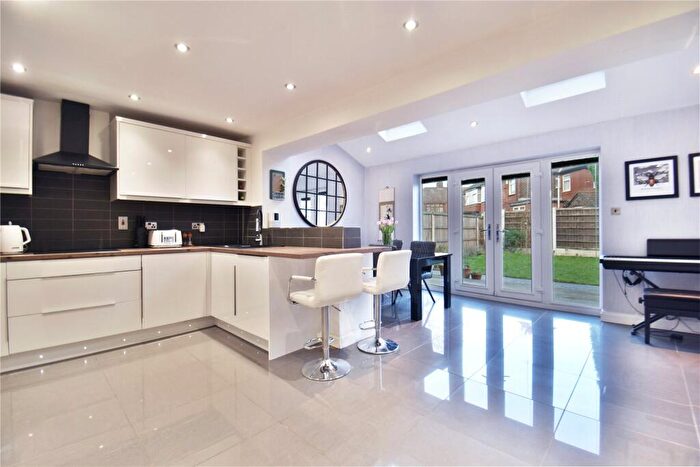
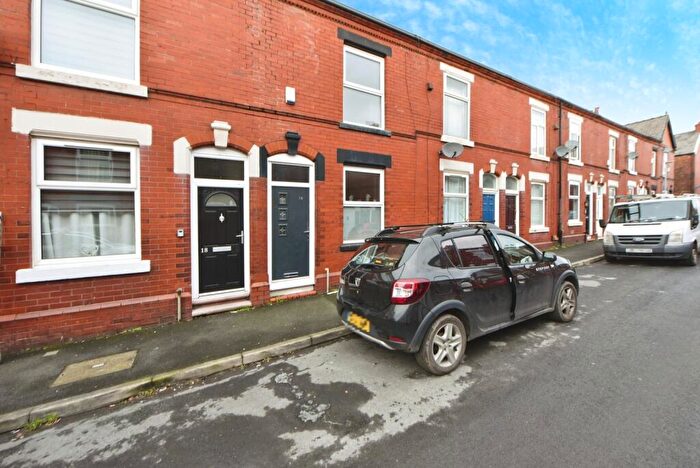
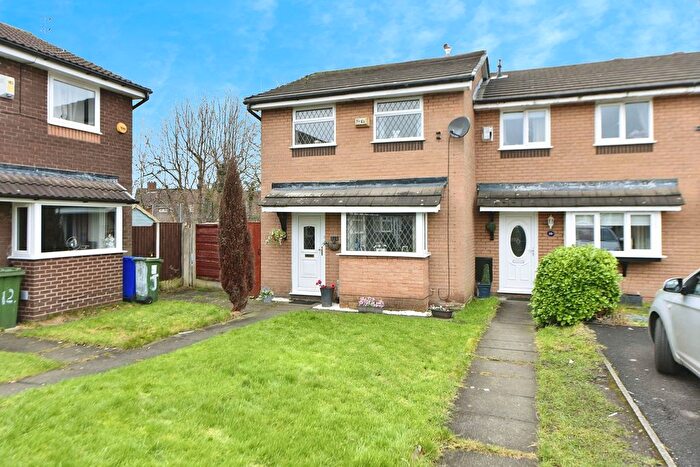
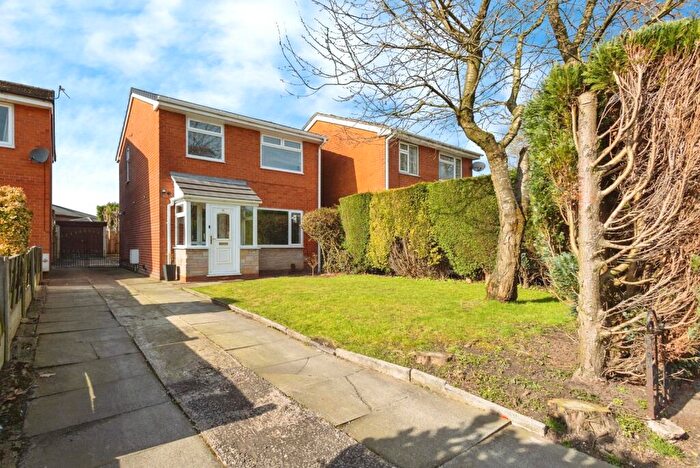
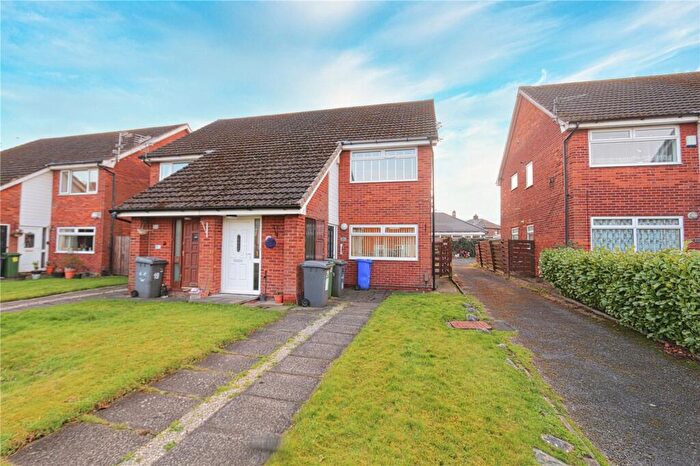
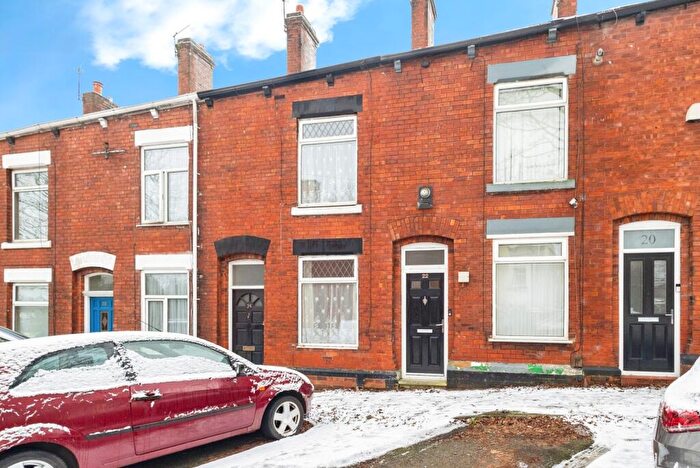
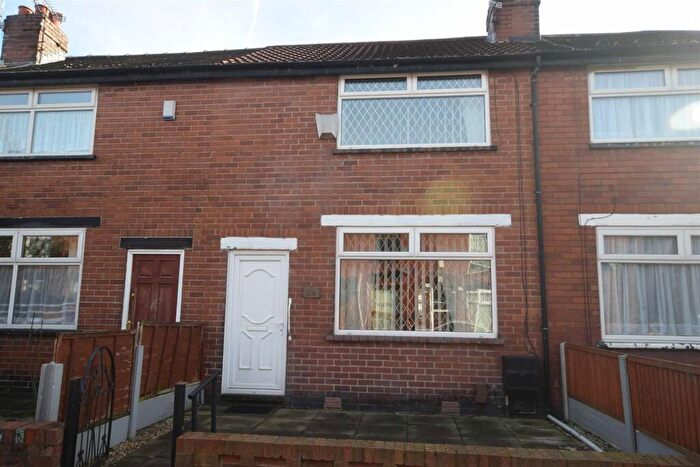
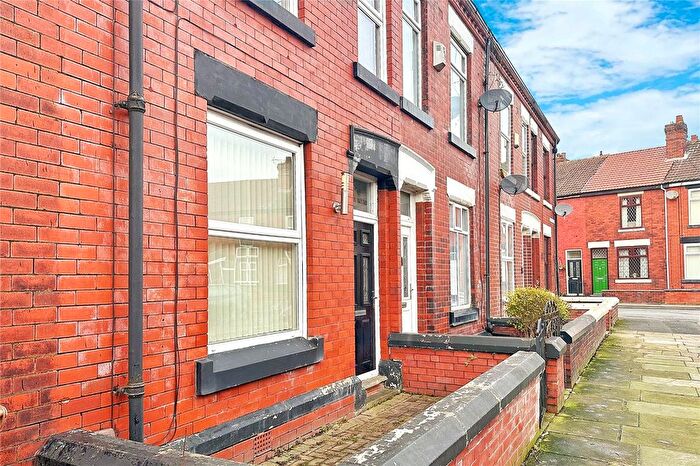
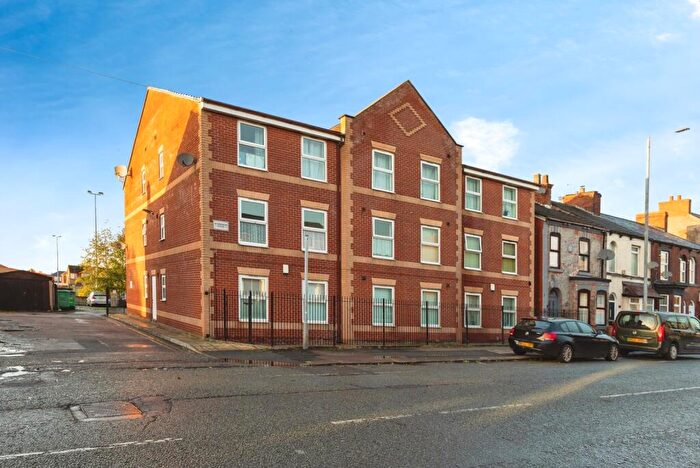
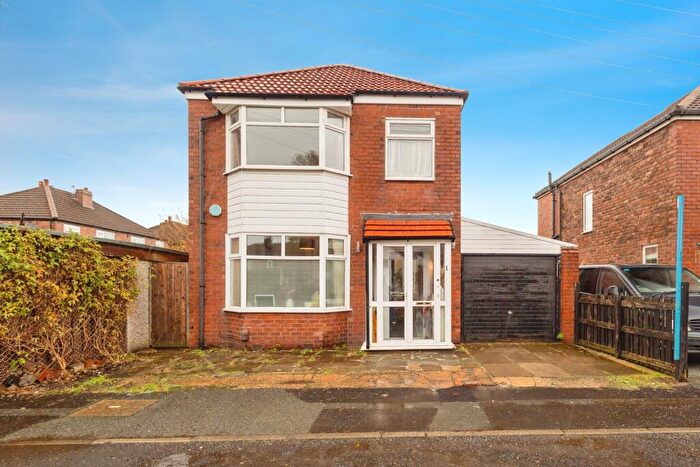
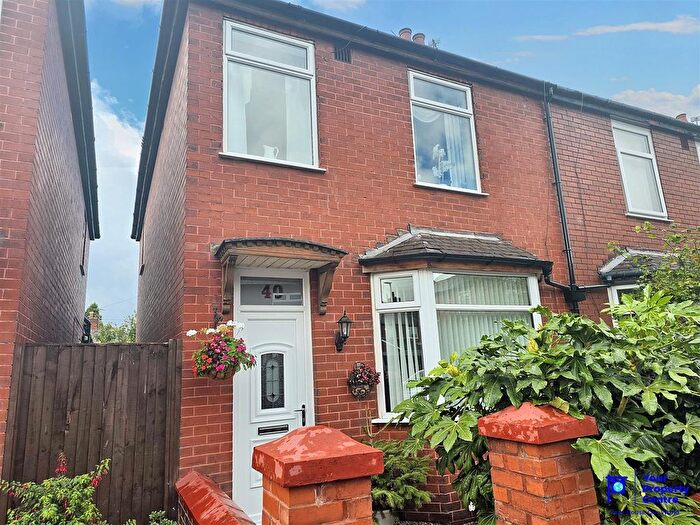
Houses for sale & to rent in St Peters, Manchester
House Prices in St Peters
Properties in St Peters have an average house price of £218,399.68 and had 78 Property Transactions within the last 3 years¹.
St Peters is an area in Manchester, Tameside with 649 households², where the most expensive property was sold for £500,000.00.
Properties for sale in St Peters
Roads and Postcodes in St Peters
Navigate through our locations to find the location of your next house in St Peters, Manchester for sale or to rent.
| Streets | Postcodes |
|---|---|
| Arnfield Road | M34 5ZP M34 5ZQ |
| Ashworth Avenue | M34 5HA |
| Ashworth View | M34 5YG |
| Audenshaw Road | M34 5HD M34 5HJ M34 5HQ M34 5HP |
| Bank Street | M34 5BU |
| Birch Grove | M34 5DN |
| Bridge Street | M34 5ZL |
| Bye Street | M34 5BS |
| Cartwright Street | M34 5DF |
| Chapel Gardens | M34 5BP |
| Chapel Street | M34 5DE |
| Church Close | M34 5FH |
| Churchfields | M34 5HZ |
| Davenport Street | M34 5TP |
| Derby Terrace | M34 5TS |
| Duncan Road | M34 5ZR |
| East Street | M34 5BX WV1 3BE |
| Eldon Close | M34 5FD |
| Enville Street | M34 5FE M34 5YH |
| Garden Street | M34 5DD |
| Guide Court | M34 5ZN |
| Guide Lane | M34 5EE M34 5UB M34 5BR M34 5BY M34 5BZ M34 5FF M34 5HY M34 5HF |
| Hanover Street North | M34 5HW |
| Hanover Street South | M34 5TQ |
| James Street | M34 5HL |
| Manor Street | M34 5JG |
| Manor Walk | M34 5JH |
| Martin Street | M34 5ZH |
| Mount Pleasant Street | M34 5BT M34 5JN M34 5BQ M34 5XX |
| Paradise Street | M34 5JL |
| Pear View | M34 5ZW |
| Poland Street | M34 5TW M34 5TY |
| Providence Street | M34 5BG |
| Redmond Close | M34 5FL |
| Saxon Lane | M34 5ZS |
| Scott Gate | M34 5JS |
| Shepley Industrial Estate North | M34 5DR |
| Shepley Road | M34 5DL |
| Shepley Street | M34 5JD |
| Slate Lane | M34 5FS |
| St Stephens Avenue | M34 5TR |
| Stelfox Lane | M34 5HE |
| Tame Street | M34 5JE M34 5TX |
| Telford Close | M34 5FB |
| The Old Stables | M34 5DH |
| Thorn Way | M34 5ZU |
| Water Street | M34 5FN |
| West View | M34 5JR |
| Whitehead Street | M34 5HH |
| Wright Street | M34 5TT |
| York Street | M34 5TN |
| M34 5ZX |
Transport near St Peters
-
Guide Bridge Station
-
Denton Station
-
Hyde North Station
-
Fairfield Station
-
Flowery Field Station
-
Ashton-Under-Lyne Station
-
Hyde Central Station
-
Gorton Station
-
Newton For Hyde Station
-
Stalybridge Station
- FAQ
- Price Paid By Year
- Property Type Price
Frequently asked questions about St Peters
What is the average price for a property for sale in St Peters?
The average price for a property for sale in St Peters is £218,400. This amount is 3% higher than the average price in Manchester. There are 496 property listings for sale in St Peters.
What streets have the most expensive properties for sale in St Peters?
The streets with the most expensive properties for sale in St Peters are Duncan Road at an average of £330,000, Eldon Close at an average of £308,000 and Guide Court at an average of £298,000.
What streets have the most affordable properties for sale in St Peters?
The streets with the most affordable properties for sale in St Peters are Bank Street at an average of £111,250, Garden Street at an average of £133,500 and Guide Lane at an average of £134,500.
Which train stations are available in or near St Peters?
Some of the train stations available in or near St Peters are Guide Bridge, Denton and Hyde North.
Property Price Paid in St Peters by Year
The average sold property price by year was:
| Year | Average Sold Price | Price Change |
Sold Properties
|
|---|---|---|---|
| 2025 | £199,925 | -9% |
20 Properties |
| 2024 | £217,735.58 | -6% |
26 Properties |
| 2023 | £230,485.94 | 19% |
32 Properties |
| 2022 | £185,771.43 | -1% |
35 Properties |
| 2021 | £186,791.11 | -25% |
75 Properties |
| 2020 | £233,233.46 | 19% |
41 Properties |
| 2019 | £189,834.73 | -13% |
71 Properties |
| 2018 | £213,959.1 | 23% |
60 Properties |
| 2017 | £165,498.61 | 29% |
36 Properties |
| 2016 | £116,941 | 15% |
17 Properties |
| 2015 | £99,500 | -4% |
11 Properties |
| 2014 | £103,970 | -5% |
17 Properties |
| 2013 | £108,979 | 33% |
17 Properties |
| 2012 | £73,083 | -60% |
12 Properties |
| 2011 | £116,900 | 16% |
10 Properties |
| 2010 | £98,209 | -39% |
21 Properties |
| 2009 | £136,232.14 | 13% |
7 Properties |
| 2008 | £118,111.11 | 7% |
9 Properties |
| 2007 | £109,763 | -10% |
19 Properties |
| 2006 | £120,544 | 24% |
32 Properties |
| 2005 | £91,290 | 8% |
24 Properties |
| 2004 | £83,636 | -2% |
29 Properties |
| 2003 | £85,522 | 33% |
24 Properties |
| 2002 | £57,012 | -0,2% |
36 Properties |
| 2001 | £57,102 | 15% |
34 Properties |
| 2000 | £48,418 | 26% |
36 Properties |
| 1999 | £35,788 | -24% |
19 Properties |
| 1998 | £44,546 | 5% |
16 Properties |
| 1997 | £42,381 | 14% |
22 Properties |
| 1996 | £36,256 | -23% |
29 Properties |
| 1995 | £44,699 | - |
18 Properties |
Property Price per Property Type in St Peters
Here you can find historic sold price data in order to help with your property search.
The average Property Paid Price for specific property types in the last three years are:
| Property Type | Average Sold Price | Sold Properties |
|---|---|---|
| Semi Detached House | £247,384.21 | 19 Semi Detached Houses |
| Terraced House | £190,514.20 | 44 Terraced Houses |
| Detached House | £332,222.22 | 9 Detached Houses |
| Flat | £160,375.00 | 6 Flats |

