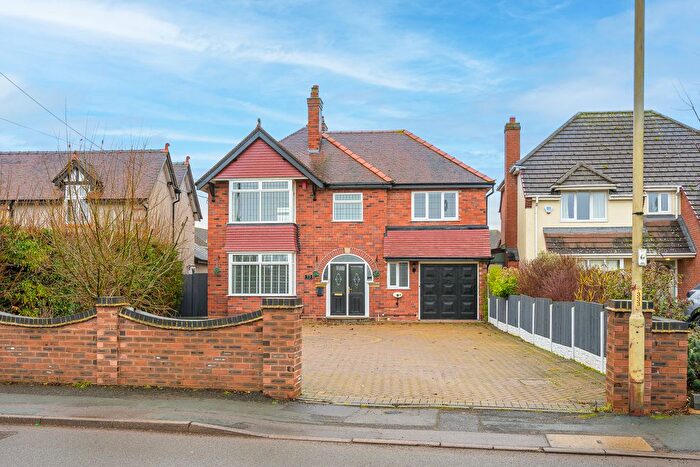
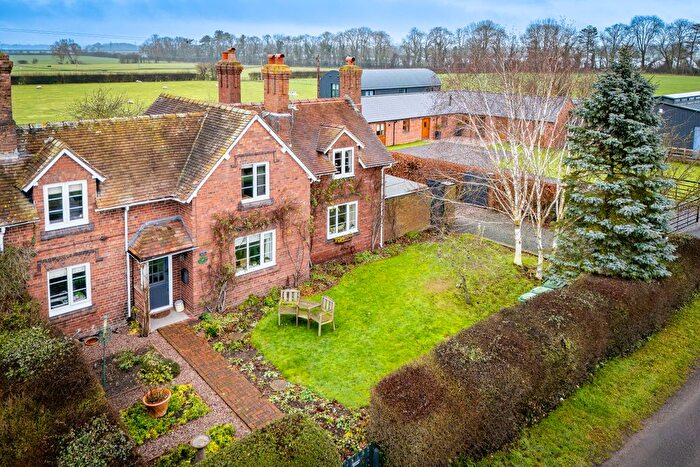
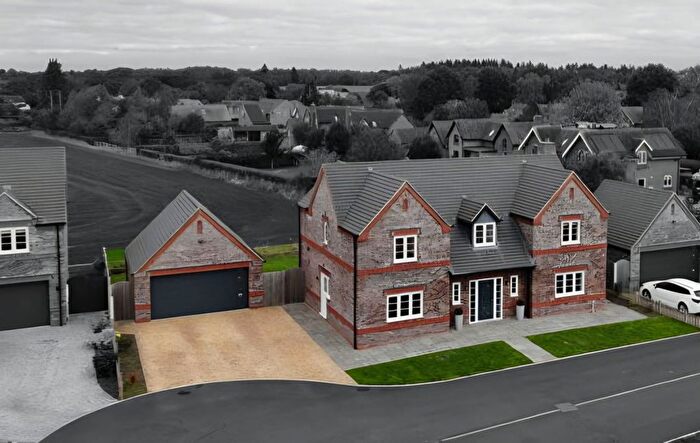
Houses for sale & to rent in Edgmond, Newport
House Prices in Edgmond
Properties in Edgmond have an average house price of £486,789.00 and had 85 Property Transactions within the last 3 years¹.
Edgmond is an area in Newport, Telford and Wrekin with 967 households², where the most expensive property was sold for £1,500,000.00.
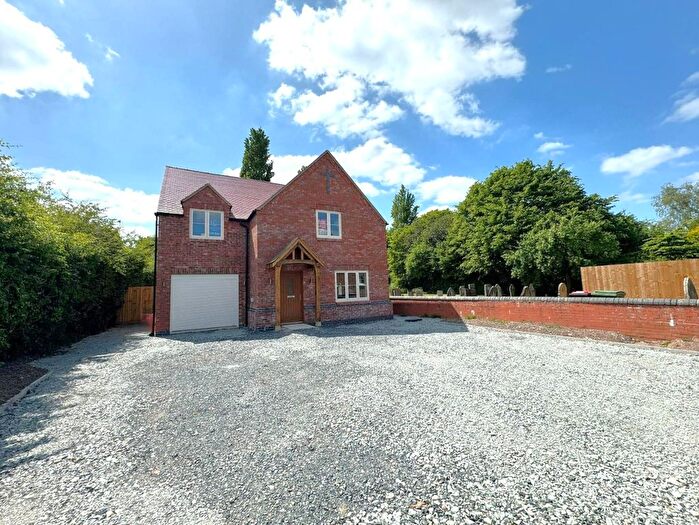
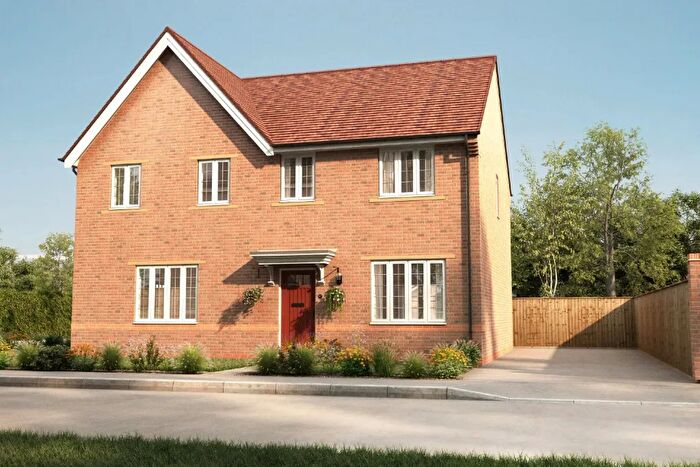
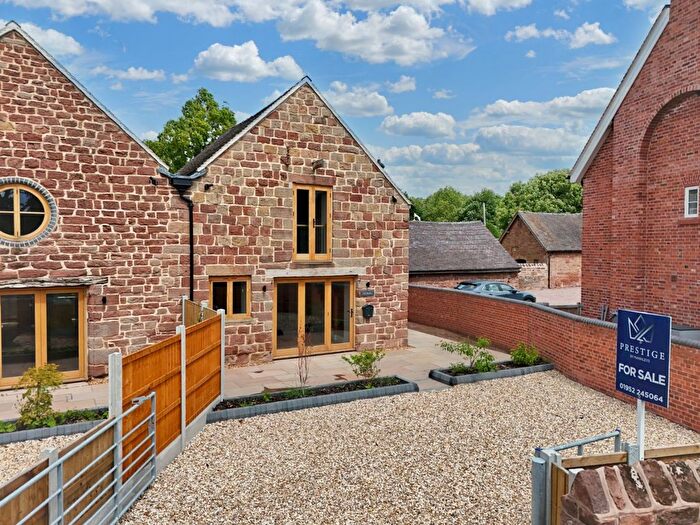
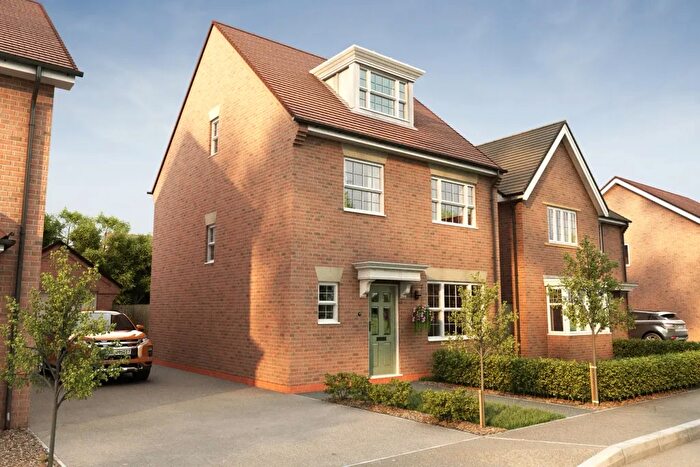
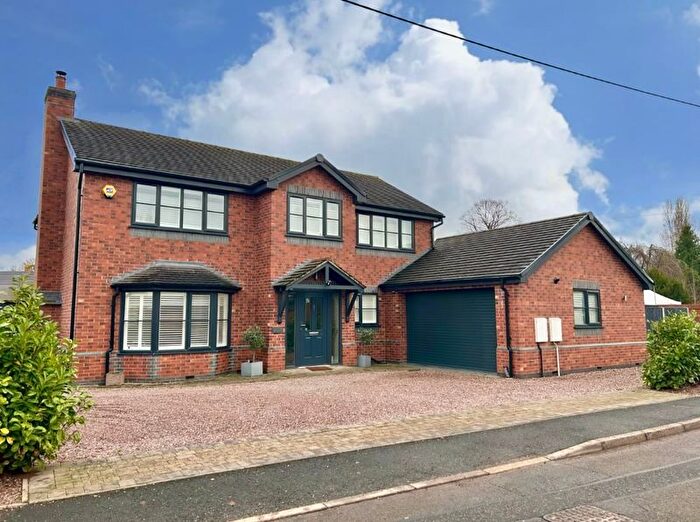
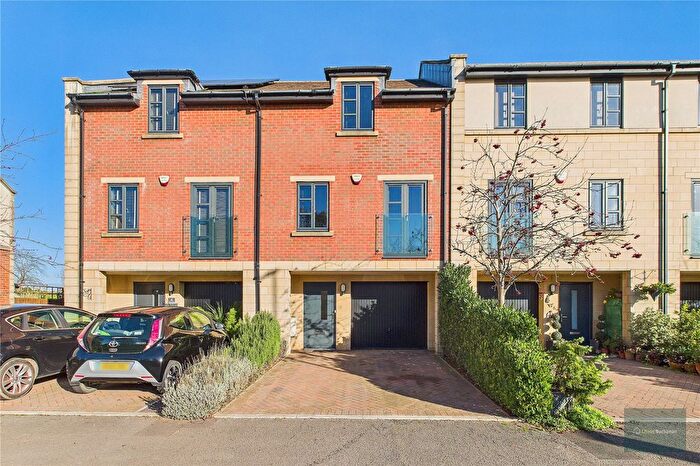
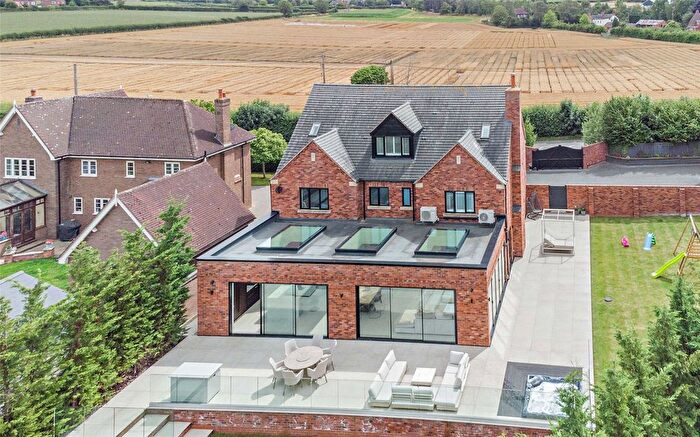
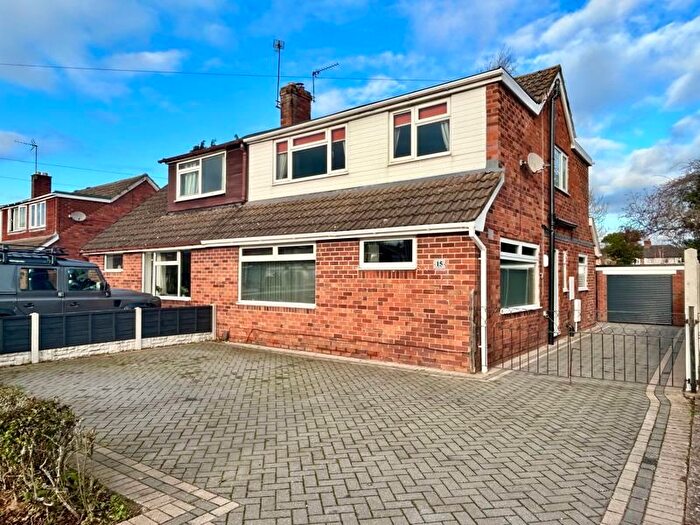
Properties for sale in Edgmond
Previously listed properties in Edgmond
Roads and Postcodes in Edgmond
Navigate through our locations to find the location of your next house in Edgmond, Newport for sale or to rent.
Transport near Edgmond
- FAQ
- Price Paid By Year
- Property Type Price
Frequently asked questions about Edgmond
What is the average price for a property for sale in Edgmond?
The average price for a property for sale in Edgmond is £486,789. This amount is 63% higher than the average price in Newport. There are 367 property listings for sale in Edgmond.
What streets have the most expensive properties for sale in Edgmond?
The streets with the most expensive properties for sale in Edgmond are Waterloo Road at an average of £975,000, Manor Road at an average of £850,000 and High Street at an average of £761,666.
What streets have the most affordable properties for sale in Edgmond?
The streets with the most affordable properties for sale in Edgmond are St Lukes Close at an average of £157,500, Playdale Estate at an average of £210,500 and Mentone Crescent at an average of £236,000.
Which train stations are available in or near Edgmond?
Some of the train stations available in or near Edgmond are Oakengates, Wellington and Telford Central.
Property Price Paid in Edgmond by Year
The average sold property price by year was:
| Year | Average Sold Price | Price Change |
Sold Properties
|
|---|---|---|---|
| 2025 | £465,874 | 12% |
13 Properties |
| 2024 | £410,545 | -21% |
22 Properties |
| 2023 | £497,023 | -10% |
21 Properties |
| 2022 | £546,594 | 22% |
29 Properties |
| 2021 | £426,655 | 16% |
48 Properties |
| 2020 | £358,565 | -3% |
38 Properties |
| 2019 | £370,999 | 23% |
30 Properties |
| 2018 | £286,724 | -10% |
29 Properties |
| 2017 | £315,289 | 7% |
34 Properties |
| 2016 | £292,886 | -10% |
22 Properties |
| 2015 | £323,518 | 3% |
27 Properties |
| 2014 | £314,229 | 7% |
21 Properties |
| 2013 | £290,986 | 3% |
23 Properties |
| 2012 | £282,609 | -9% |
20 Properties |
| 2011 | £308,500 | 12% |
19 Properties |
| 2010 | £272,442 | -22% |
26 Properties |
| 2009 | £333,105 | 17% |
19 Properties |
| 2008 | £276,713 | 7% |
21 Properties |
| 2007 | £258,506 | -9% |
37 Properties |
| 2006 | £282,299 | 9% |
38 Properties |
| 2005 | £257,073 | 3% |
29 Properties |
| 2004 | £249,798 | 4% |
33 Properties |
| 2003 | £240,127 | 17% |
35 Properties |
| 2002 | £200,371 | 16% |
38 Properties |
| 2001 | £167,406 | 24% |
44 Properties |
| 2000 | £127,054 | -6% |
40 Properties |
| 1999 | £135,194 | 18% |
57 Properties |
| 1998 | £111,025 | 17% |
37 Properties |
| 1997 | £92,624 | -5% |
42 Properties |
| 1996 | £96,895 | -12% |
45 Properties |
| 1995 | £108,387 | - |
33 Properties |
Property Price per Property Type in Edgmond
Here you can find historic sold price data in order to help with your property search.
The average Property Paid Price for specific property types in the last three years are:
| Property Type | Average Sold Price | Sold Properties |
|---|---|---|
| Semi Detached House | £297,453.00 | 32 Semi Detached Houses |
| Detached House | £614,321.00 | 47 Detached Houses |
| Terraced House | £497,583.00 | 6 Terraced Houses |

