Houses for sale & to rent in Newport North, Newport
House Prices in Newport North
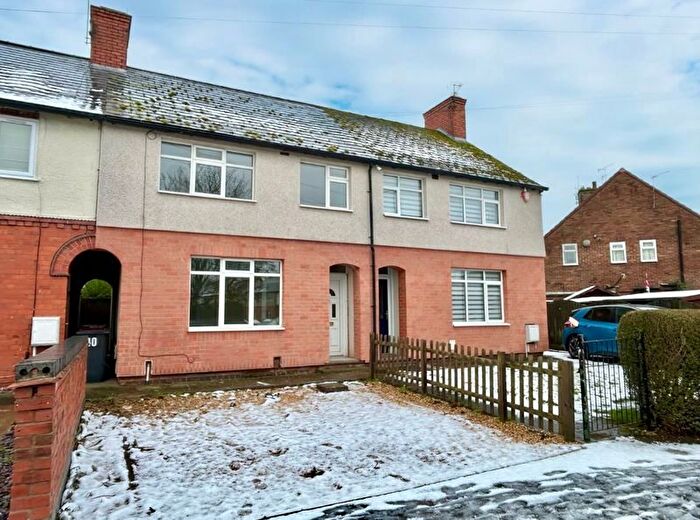
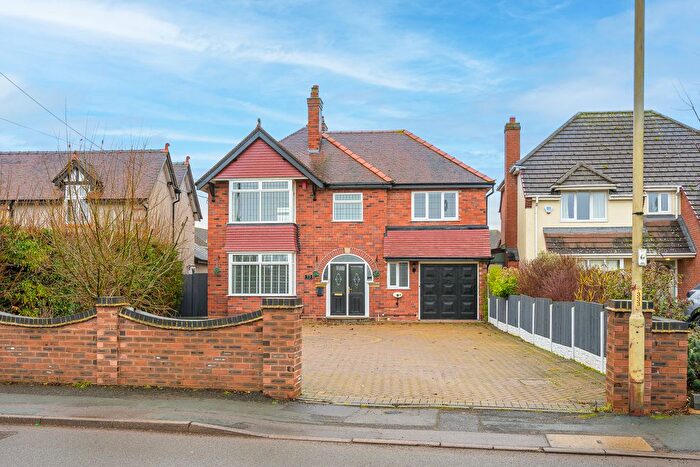
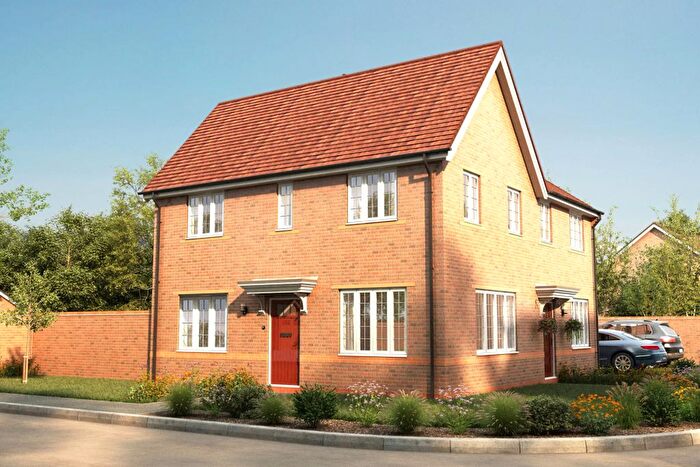
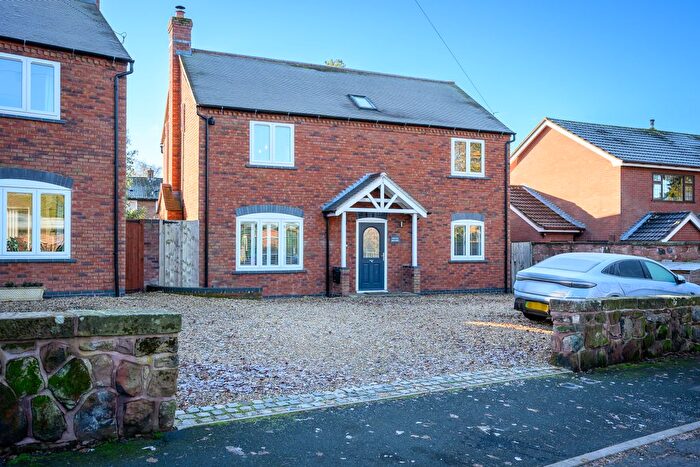
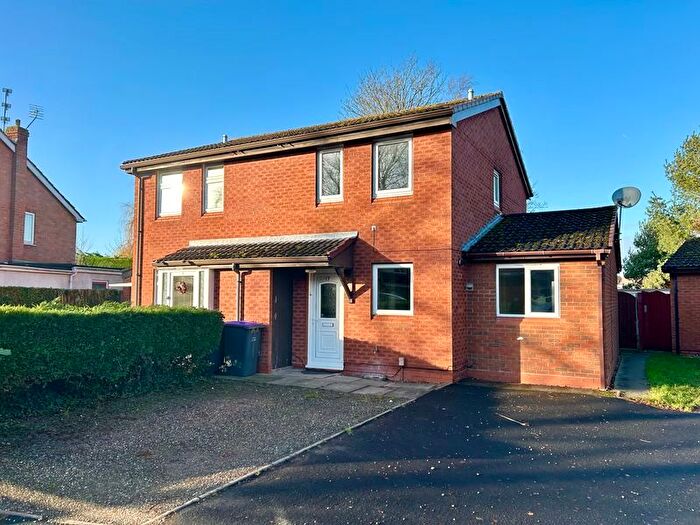
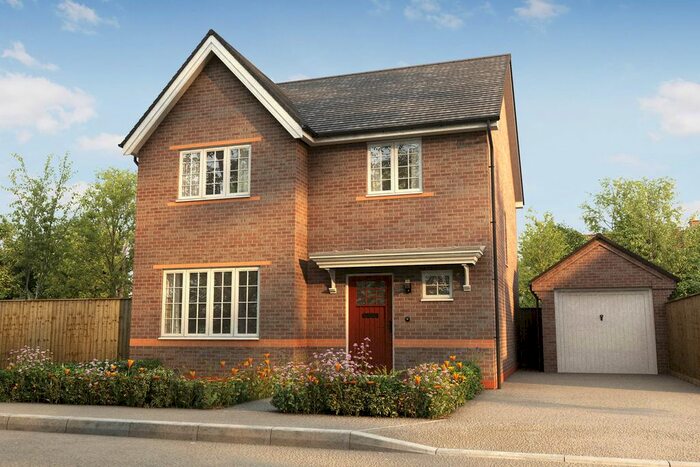
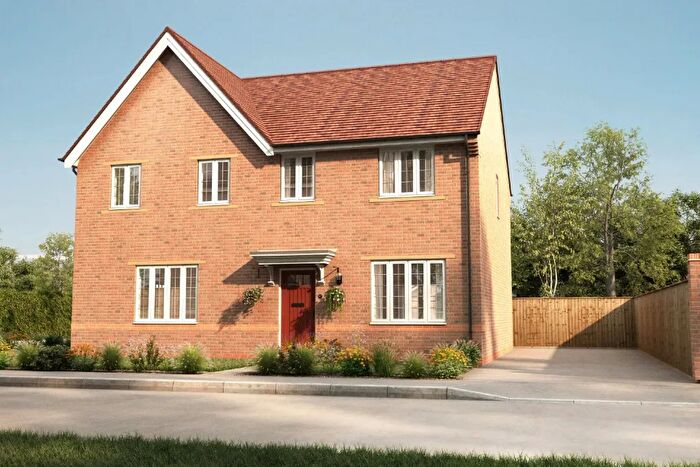
Properties in Newport North have an average house price of £288,158.00 and had 145 Property Transactions within the last 3 years¹.
Newport North is an area in Newport, Telford and Wrekin with 1,174 households², where the most expensive property was sold for £850,000.00.
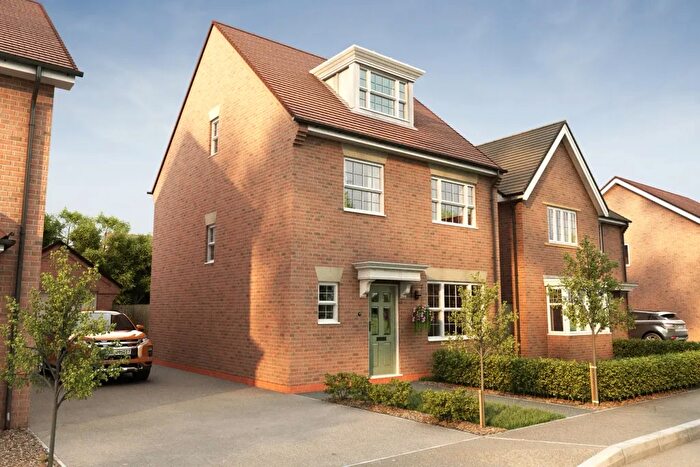
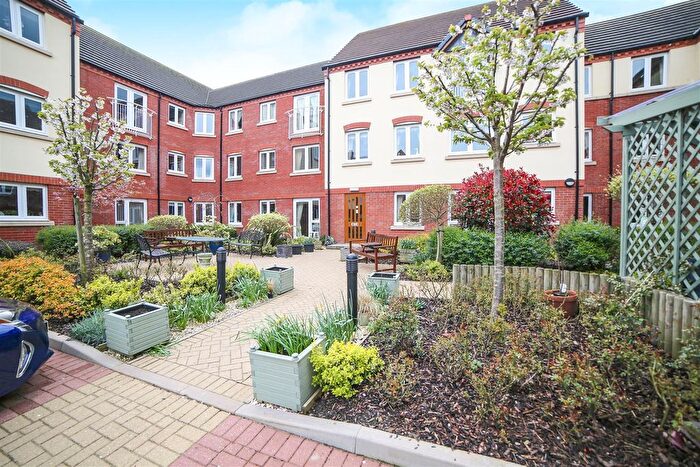
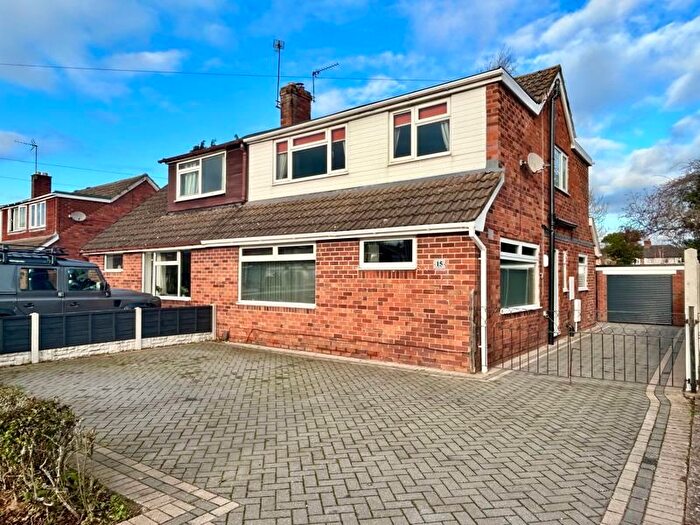
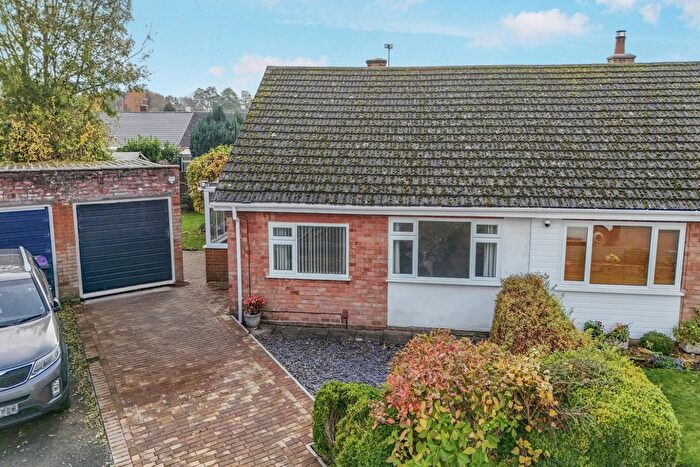
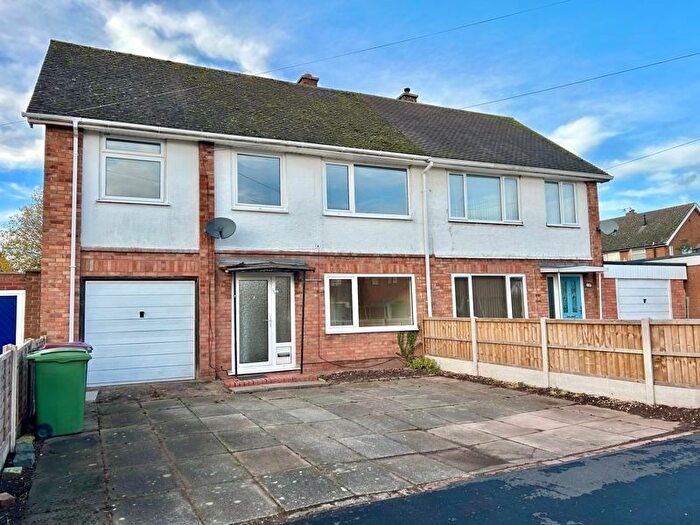
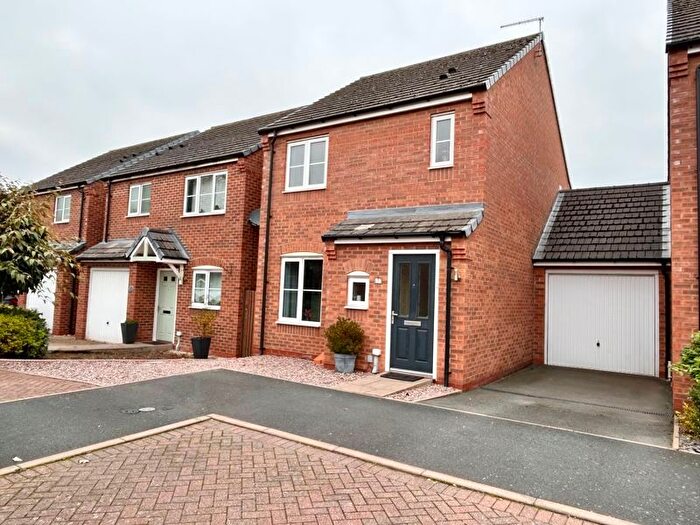
Properties for sale in Newport North
Previously listed properties in Newport North
Roads and Postcodes in Newport North
Navigate through our locations to find the location of your next house in Newport North, Newport for sale or to rent.
| Streets | Postcodes |
|---|---|
| Ashley Court | TF10 7GE |
| Avon Dale | TF10 7LP TF10 7LS |
| Beechfields Way | TF10 8QA |
| Bracken Way | TF10 7RL |
| Bridge Terrace | TF10 7JB |
| Brook View | TF10 7UB |
| Broomfield Place | TF10 7TS |
| Broomfield Road | TF10 7PF TF10 7PL TF10 7PN TF10 7PW |
| Buckland Walk | TF10 7NQ |
| Chancery Court | TF10 7GA |
| Chetwynd End | TF10 7JE TF10 7JH TF10 7JJ |
| Chetwynd Grove | TF10 7JN TF10 7JW |
| Chetwynd Road | TF10 7JZ |
| Coppice Drive | TF10 7HU |
| Deer Park Drive | TF10 7HB |
| Downfields | TF10 8QH |
| Fair Oak | TF10 7LR |
| Fallow Deer Lawn | TF10 7JF |
| Forton Glade | TF10 8BP |
| Forton Road | TF10 7JL TF10 7JP TF10 7JR TF10 7LW TF10 8BT TF10 8BU |
| Green Lane | TF10 7LA |
| Greenacres Way | TF10 7PH TF10 7PJ TF10 7PQ |
| Hallcroft Gardens | TF10 7PP TF10 7PR |
| Hartwood Close | TF10 7NZ |
| Harvest Close | TF10 7GB |
| Heron Way | TF10 8QF |
| Islington Close | TF10 7TT |
| Kestrel Close | TF10 8QE |
| Kingfisher Close | TF10 8QD |
| Masons Place | TF10 7JS TF10 7JT TF10 7JU TF10 7JX |
| Mere Close | TF10 7SL |
| Park End | TF10 7JG |
| Plough Lane | TF10 8BS |
| Roe Deer Green | TF10 7JQ |
| Salters Lane | TF10 7LB |
| Strine Way | TF10 7RJ |
| Sunny Gardens | TF10 8QG |
| Swanmere | TF10 8QB |
| Waterside Mews | TF10 7PA |
| TF10 8EG |
Transport near Newport North
- FAQ
- Price Paid By Year
- Property Type Price
Frequently asked questions about Newport North
What is the average price for a property for sale in Newport North?
The average price for a property for sale in Newport North is £288,158. This amount is 3% lower than the average price in Newport. There are 213 property listings for sale in Newport North.
What streets have the most expensive properties for sale in Newport North?
The streets with the most expensive properties for sale in Newport North are Forton Glade at an average of £660,000, Deer Park Drive at an average of £491,666 and Hartwood Close at an average of £452,500.
What streets have the most affordable properties for sale in Newport North?
The streets with the most affordable properties for sale in Newport North are Bridge Terrace at an average of £126,000, Waterside Mews at an average of £139,812 and Chancery Court at an average of £150,500.
Which train stations are available in or near Newport North?
Some of the train stations available in or near Newport North are Oakengates, Telford Central and Shifnal.
Property Price Paid in Newport North by Year
The average sold property price by year was:
| Year | Average Sold Price | Price Change |
Sold Properties
|
|---|---|---|---|
| 2025 | £308,604 | 12% |
24 Properties |
| 2024 | £271,071 | -14% |
28 Properties |
| 2023 | £308,557 | 14% |
48 Properties |
| 2022 | £266,127 | 2% |
45 Properties |
| 2021 | £261,902 | 5% |
66 Properties |
| 2020 | £249,897 | 4% |
43 Properties |
| 2019 | £239,578 | 10% |
50 Properties |
| 2018 | £216,480 | -6% |
38 Properties |
| 2017 | £229,060 | -0,1% |
33 Properties |
| 2016 | £229,366 | 3% |
55 Properties |
| 2015 | £222,721 | 3% |
43 Properties |
| 2014 | £215,491 | 10% |
47 Properties |
| 2013 | £194,834 | 0,4% |
51 Properties |
| 2012 | £194,107 | -6% |
42 Properties |
| 2011 | £206,511 | -2% |
35 Properties |
| 2010 | £211,549 | -3% |
56 Properties |
| 2009 | £218,836 | 14% |
34 Properties |
| 2008 | £187,473 | -11% |
36 Properties |
| 2007 | £207,601 | 5% |
79 Properties |
| 2006 | £197,053 | 13% |
89 Properties |
| 2005 | £171,068 | 4% |
50 Properties |
| 2004 | £163,411 | 2% |
77 Properties |
| 2003 | £160,481 | 16% |
93 Properties |
| 2002 | £134,198 | 24% |
100 Properties |
| 2001 | £102,587 | 14% |
68 Properties |
| 2000 | £88,162 | -3% |
83 Properties |
| 1999 | £90,859 | 4% |
101 Properties |
| 1998 | £86,836 | 23% |
112 Properties |
| 1997 | £67,129 | -14% |
124 Properties |
| 1996 | £76,545 | 4% |
70 Properties |
| 1995 | £73,212 | - |
69 Properties |
Property Price per Property Type in Newport North
Here you can find historic sold price data in order to help with your property search.
The average Property Paid Price for specific property types in the last three years are:
| Property Type | Average Sold Price | Sold Properties |
|---|---|---|
| Semi Detached House | £224,951.00 | 46 Semi Detached Houses |
| Detached House | £406,943.00 | 58 Detached Houses |
| Terraced House | £200,569.00 | 36 Terraced Houses |
| Flat | £122,400.00 | 5 Flats |

