Houses for sale & to rent in Newport West, Newport
House Prices in Newport West
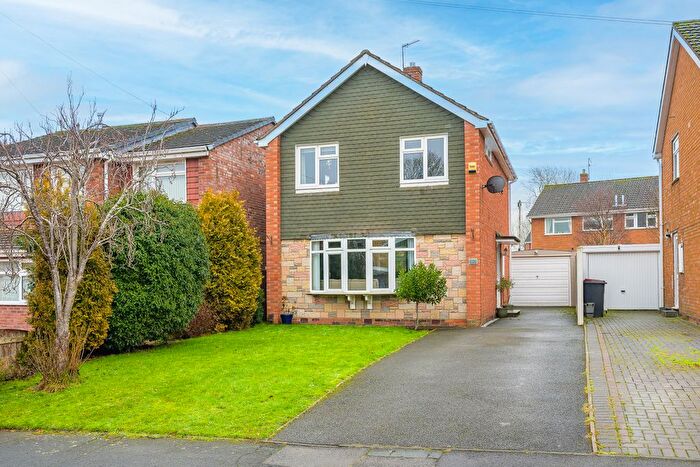
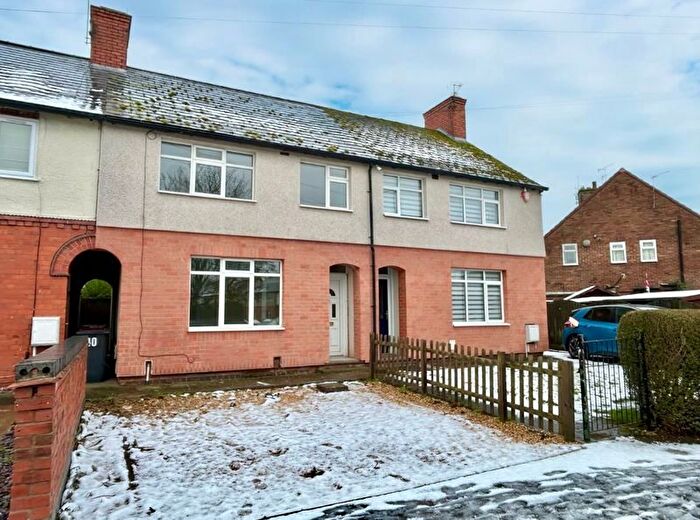
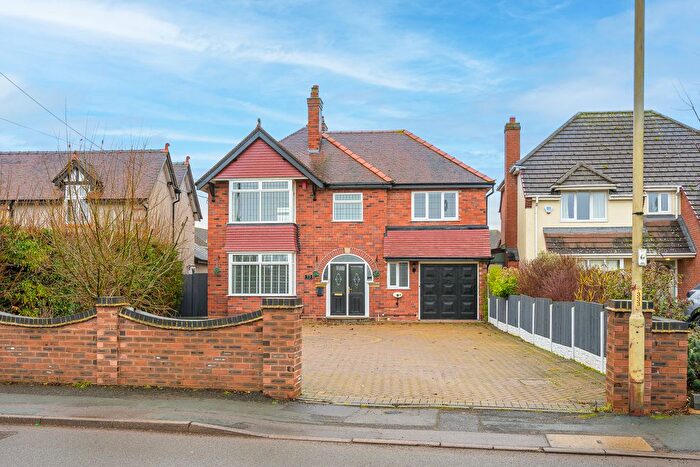
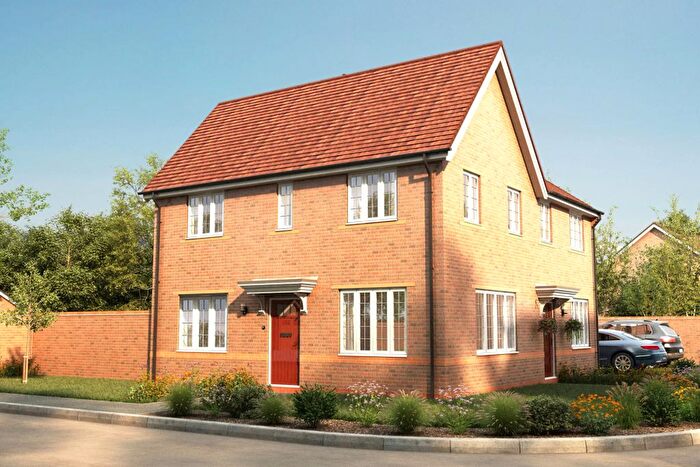
Properties in Newport West have an average house price of £220,432.00 and had 163 Property Transactions within the last 3 years¹.
Newport West is an area in Newport, Telford and Wrekin with 1,095 households², where the most expensive property was sold for £450,000.00.
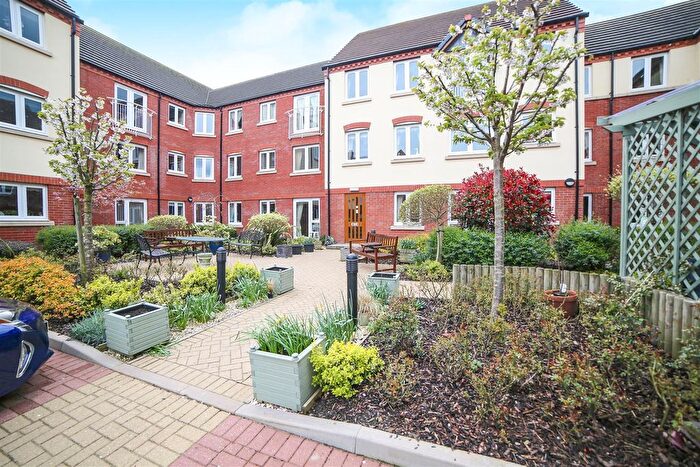
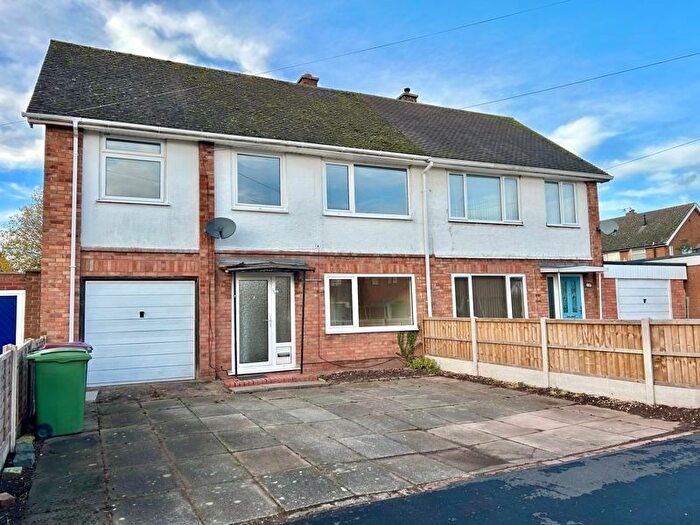
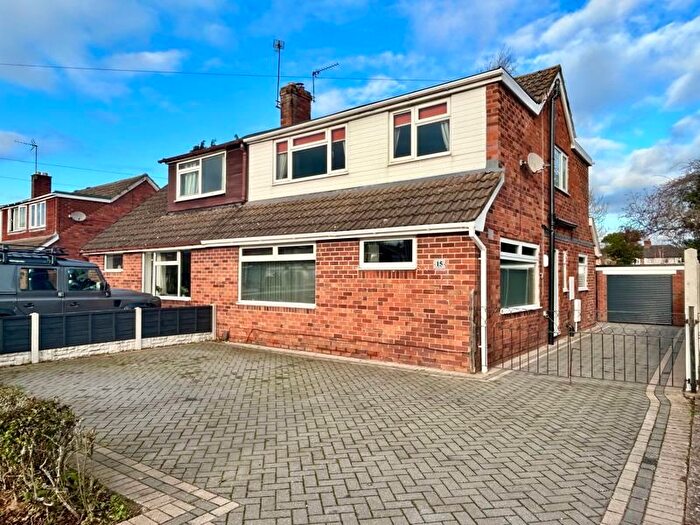
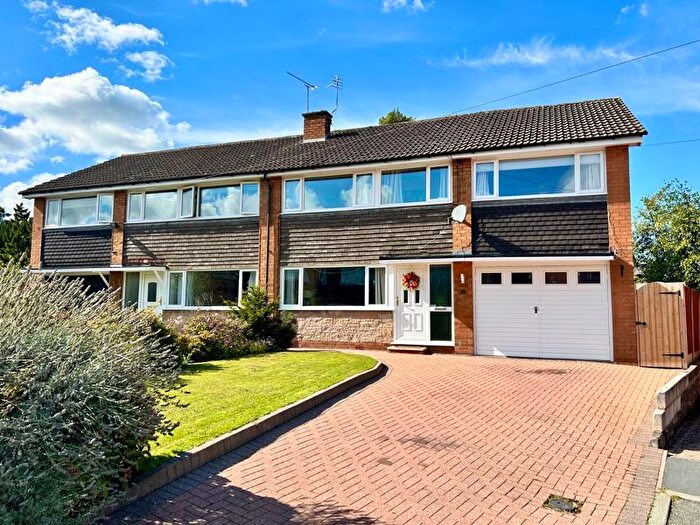
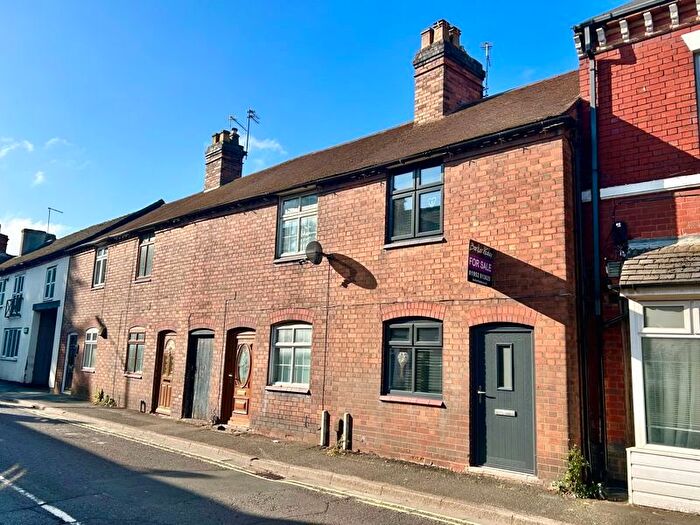
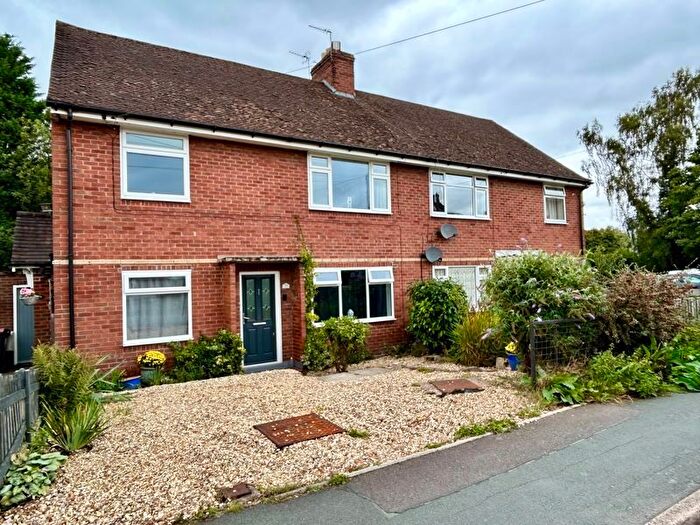
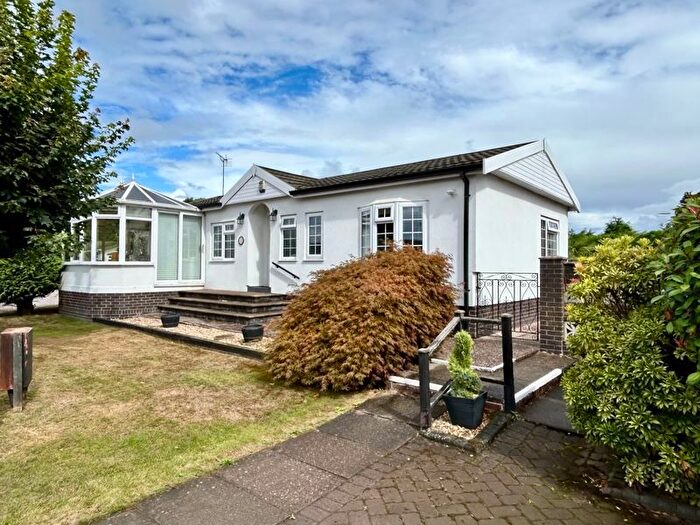
Properties for sale in Newport West
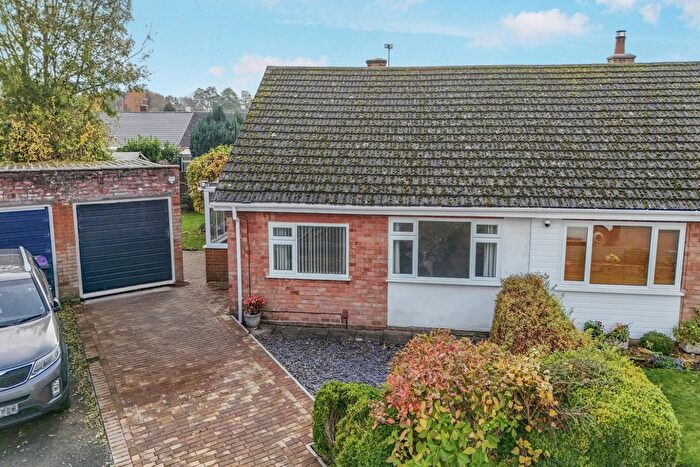
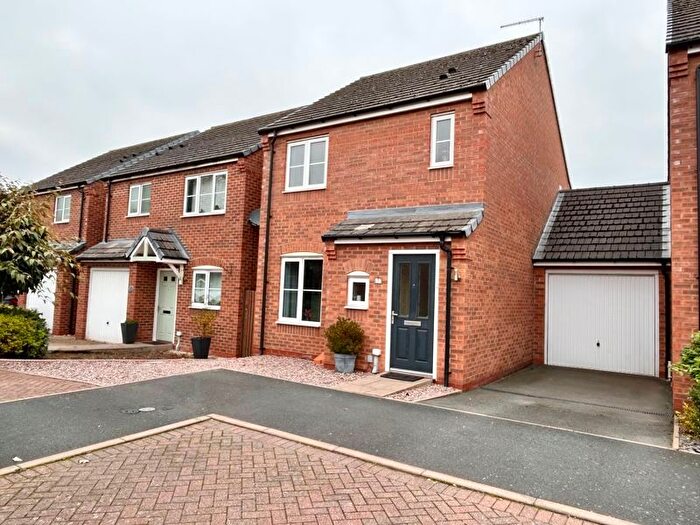
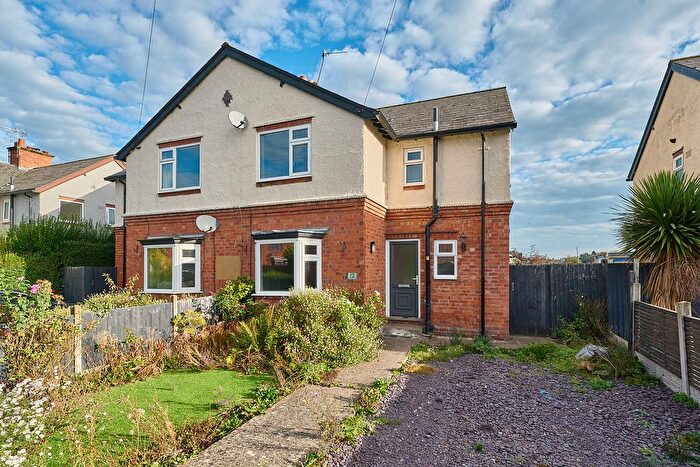
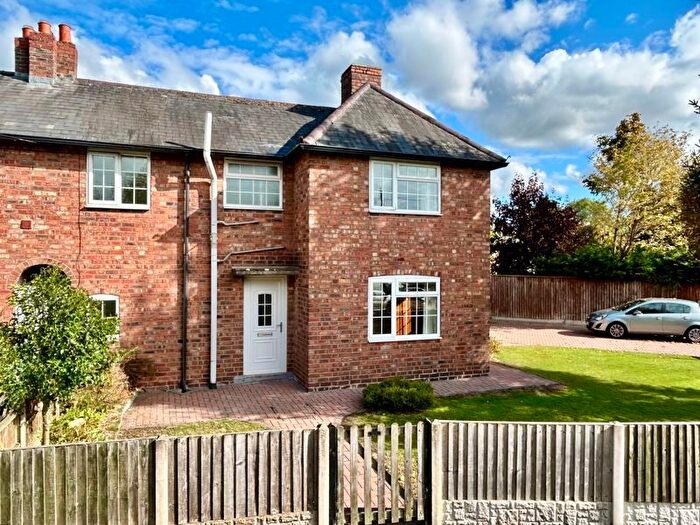
Previously listed properties in Newport West
Roads and Postcodes in Newport West
Navigate through our locations to find the location of your next house in Newport West, Newport for sale or to rent.
| Streets | Postcodes |
|---|---|
| Adams Crescent | TF10 7QJ |
| Alton Grove | TF10 7UF |
| Aston Drive | TF10 7UA |
| Audley Avenue | TF10 7BA |
| Audley Park | TF10 7GH |
| Audley Road | TF10 7DT |
| Avenue Road | TF10 7DZ |
| Beaumaris Road | TF10 7BN |
| Bellmans Yard | TF10 7AJ |
| Blackmere Close | TF10 7UT |
| Boughey Road | TF10 7PY TF10 7QA TF10 7QD TF10 7QF TF10 7QQ TF10 7QX TF10 7RX |
| Broadbent Court | TF10 7FE |
| Crown Mews | TF10 7AA |
| Dungarven Drive | TF10 7UR |
| Ellesmere Court | TF10 7SD |
| Farm Grove | TF10 7PX |
| Ford Road | TF10 7QG TF10 7TU TF10 7UH TF10 7UJ TF10 7UL TF10 7UN |
| Gilbert Close | TF10 7UU |
| Gravelly Drive | TF10 7QN TF10 7QS |
| Hawkstone Avenue | TF10 7SE |
| Heathwood Road | TF10 7QB |
| High Street | TF10 7AQ TF10 7AT TF10 7AY TF10 7BB TF10 7BH |
| Highland Road | TF10 7QE |
| Ingestre Close | TF10 7UP |
| Leigh Road | TF10 7QH |
| Longford Road | TF10 7PU |
| Moorfield Court | TF10 7QT |
| Moorland Road | TF10 7PZ |
| Sandiford Crescent | TF10 7QP TF10 7QR TF10 7QW |
| Shrewsbury Way | TF10 7UW |
| Smallwood Court | TF10 7NH |
| St Marys Street | TF10 7AB |
| Stafford Street | TF10 7LT TF10 7UD |
| Stretton Avenue | TF10 7SF |
| Talbot Close | TF10 7UQ |
| The Larches | TF10 7SH TF10 7SQ |
| The Smithfields | TF10 7SS |
| Underhill Close | TF10 7EB |
| Upper Bar | TF10 7AP TF10 7AW |
| Vauxhall Crescent | TF10 7PT |
| Vauxhall Terrace | TF10 7PS |
| Water Lane | TF10 7LD |
| Waterford Drive | TF10 7UG |
| Wellington Road | TF10 7HD TF10 7HE TF10 7HF TF10 7HY |
| Wenlock Drive | TF10 7HH |
| Wrekin Avenue | TF10 7HQ |
Transport near Newport West
- FAQ
- Price Paid By Year
- Property Type Price
Frequently asked questions about Newport West
What is the average price for a property for sale in Newport West?
The average price for a property for sale in Newport West is £220,432. This amount is 26% lower than the average price in Newport. There are 215 property listings for sale in Newport West.
What streets have the most expensive properties for sale in Newport West?
The streets with the most expensive properties for sale in Newport West are Talbot Close at an average of £380,000, Waterford Drive at an average of £327,500 and Wellington Road at an average of £326,090.
What streets have the most affordable properties for sale in Newport West?
The streets with the most affordable properties for sale in Newport West are Adams Crescent at an average of £95,250, Sandiford Crescent at an average of £97,937 and Underhill Close at an average of £121,125.
Which train stations are available in or near Newport West?
Some of the train stations available in or near Newport West are Oakengates, Telford Central and Shifnal.
Property Price Paid in Newport West by Year
The average sold property price by year was:
| Year | Average Sold Price | Price Change |
Sold Properties
|
|---|---|---|---|
| 2025 | £235,037 | -4% |
27 Properties |
| 2024 | £244,999 | 17% |
42 Properties |
| 2023 | £203,021 | -2% |
44 Properties |
| 2022 | £207,230 | 8% |
50 Properties |
| 2021 | £190,917 | -1% |
57 Properties |
| 2020 | £192,375 | 3% |
40 Properties |
| 2019 | £186,133 | 1% |
52 Properties |
| 2018 | £184,048 | 7% |
55 Properties |
| 2017 | £171,894 | -4% |
54 Properties |
| 2016 | £178,981 | 12% |
60 Properties |
| 2015 | £158,308 | -4% |
54 Properties |
| 2014 | £165,292 | -3% |
80 Properties |
| 2013 | £170,459 | 3% |
45 Properties |
| 2012 | £164,765 | 8% |
62 Properties |
| 2011 | £151,359 | 1% |
41 Properties |
| 2010 | £149,636 | -6% |
36 Properties |
| 2009 | £158,375 | 0,1% |
24 Properties |
| 2008 | £158,170 | 1% |
17 Properties |
| 2007 | £156,871 | -0,4% |
74 Properties |
| 2006 | £157,515 | 7% |
72 Properties |
| 2005 | £146,481 | 15% |
71 Properties |
| 2004 | £124,878 | -5% |
55 Properties |
| 2003 | £131,225 | 23% |
65 Properties |
| 2002 | £101,170 | 18% |
74 Properties |
| 2001 | £83,005 | 1% |
59 Properties |
| 2000 | £82,427 | 21% |
67 Properties |
| 1999 | £65,384 | 7% |
71 Properties |
| 1998 | £60,633 | 17% |
77 Properties |
| 1997 | £50,138 | -2% |
50 Properties |
| 1996 | £51,165 | -6% |
51 Properties |
| 1995 | £54,223 | - |
44 Properties |
Property Price per Property Type in Newport West
Here you can find historic sold price data in order to help with your property search.
The average Property Paid Price for specific property types in the last three years are:
| Property Type | Average Sold Price | Sold Properties |
|---|---|---|
| Semi Detached House | £231,530.00 | 47 Semi Detached Houses |
| Detached House | £296,868.00 | 46 Detached Houses |
| Terraced House | £190,752.00 | 34 Terraced Houses |
| Flat | £136,304.00 | 36 Flats |

