Houses for sale & to rent in Newport South, Newport
House Prices in Newport South
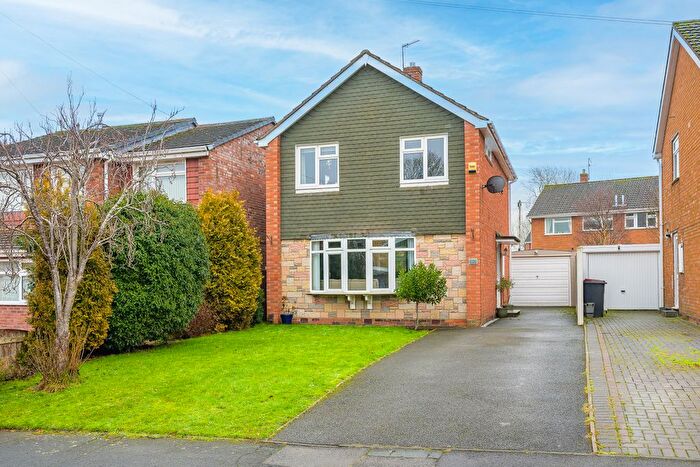
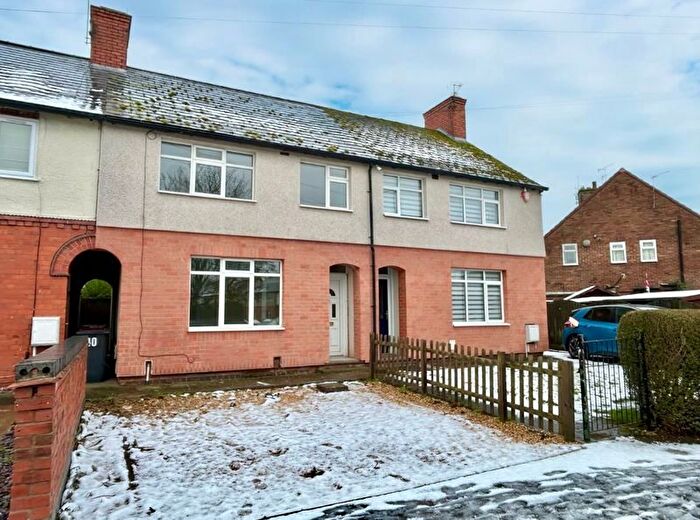
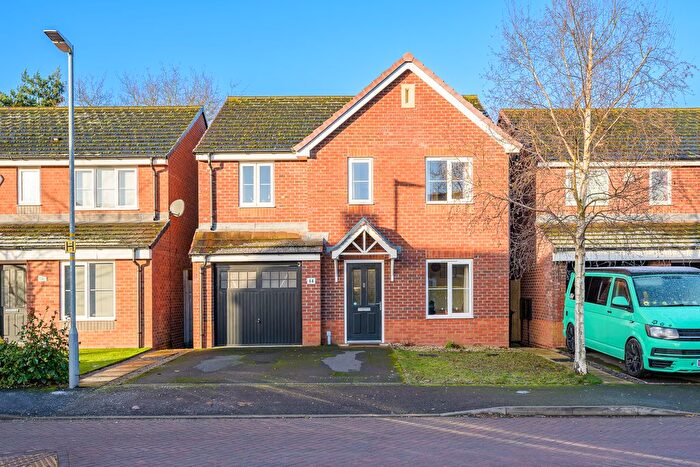
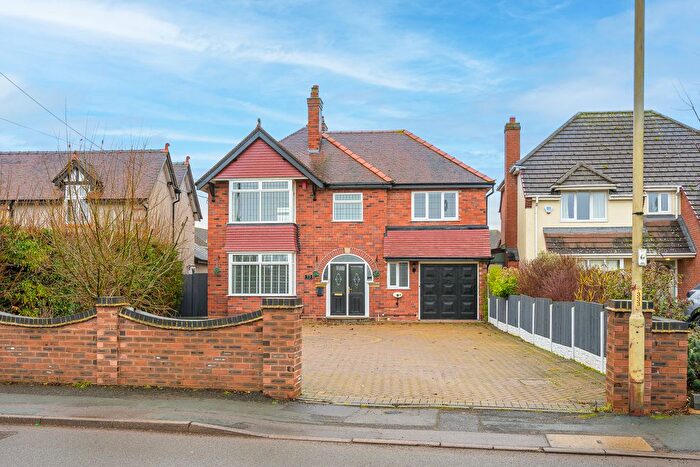
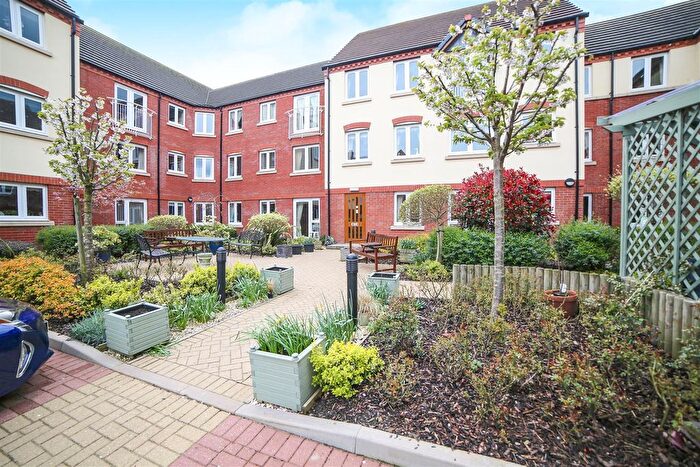
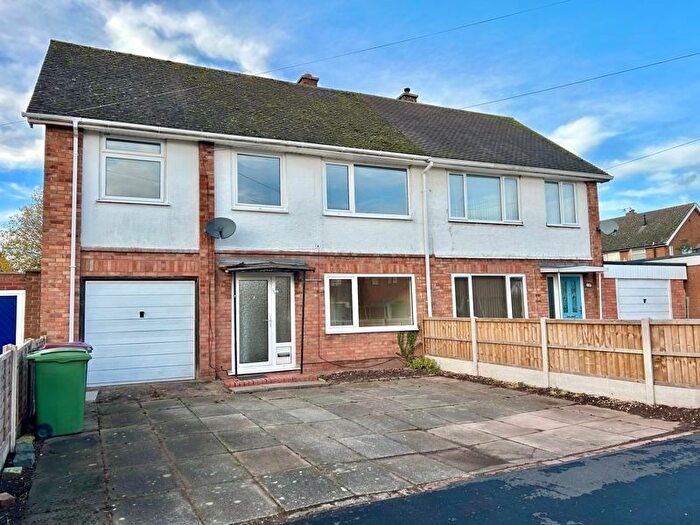
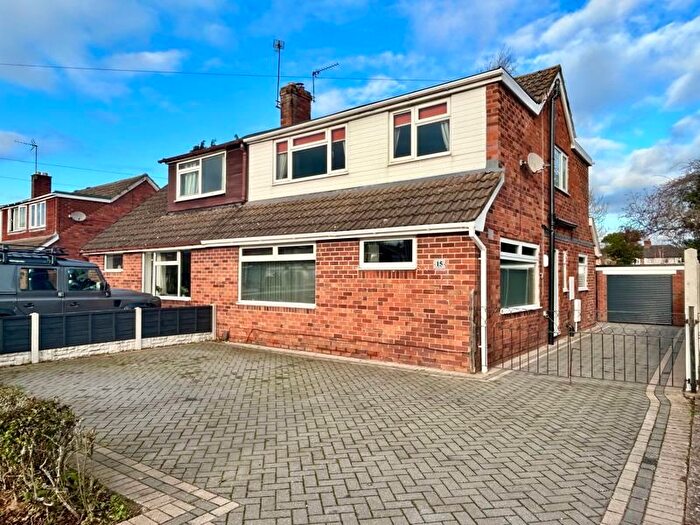
Properties in Newport South have an average house price of £257,006.00 and had 142 Property Transactions within the last 3 years¹.
Newport South is an area in Newport, Telford and Wrekin with 1,143 households², where the most expensive property was sold for £899,500.00.
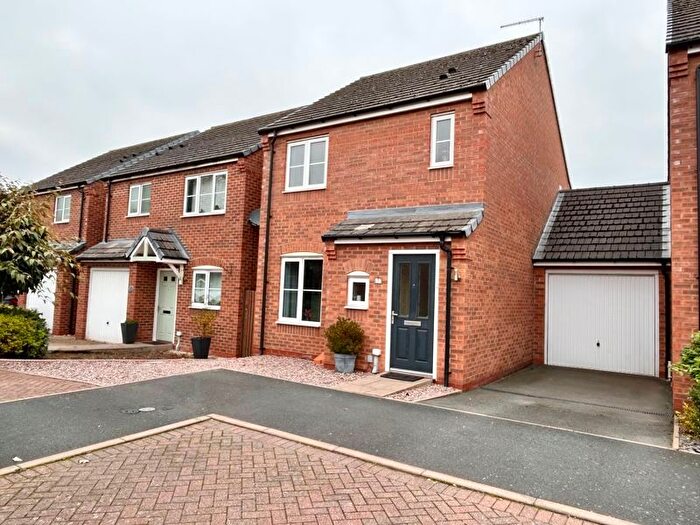
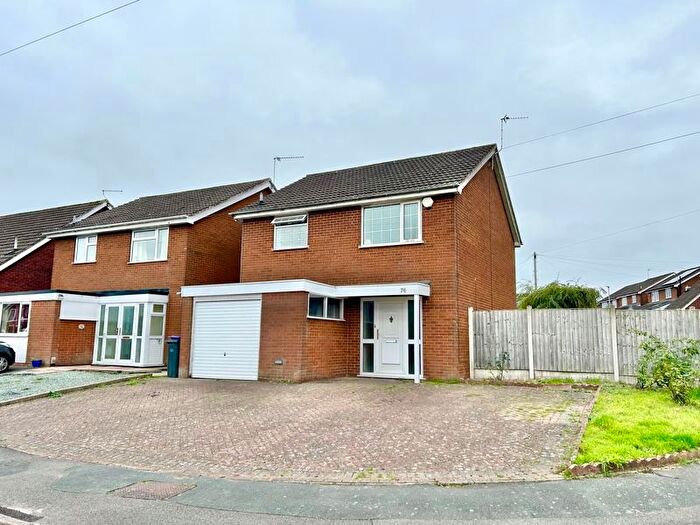
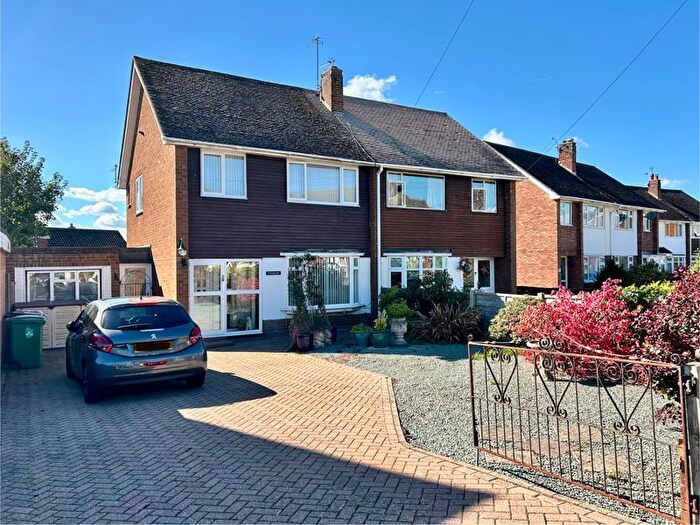
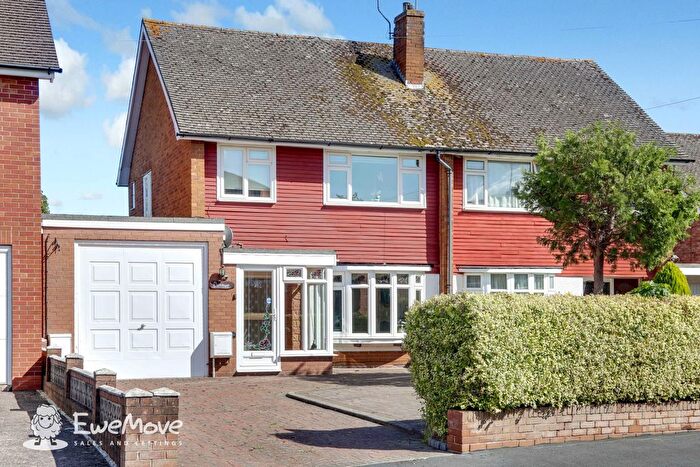
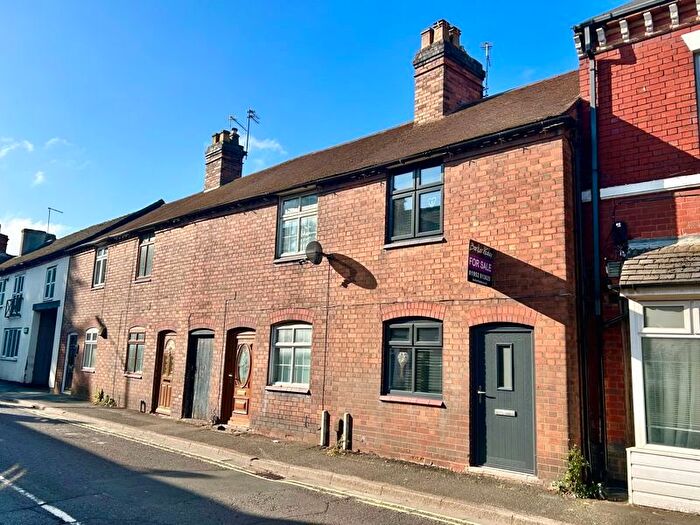
Properties for sale in Newport South
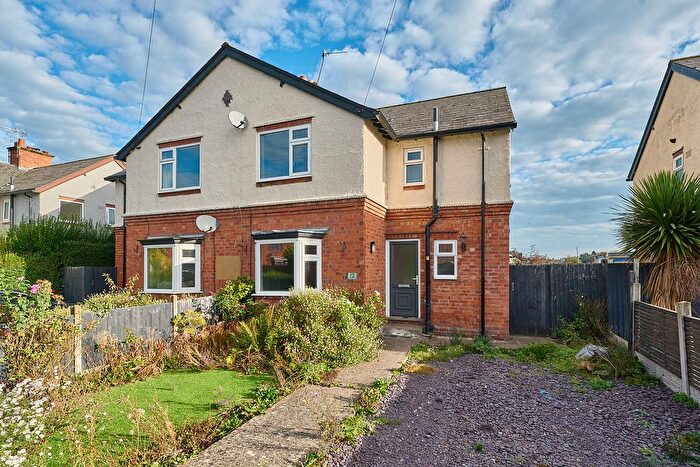
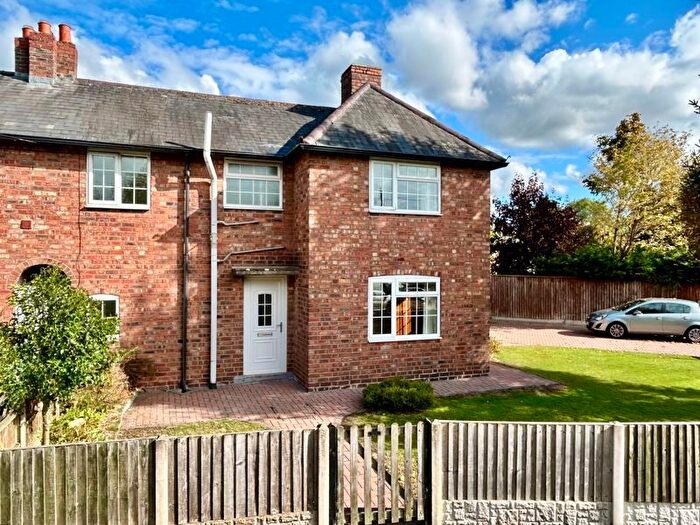
Previously listed properties in Newport South
Roads and Postcodes in Newport South
Navigate through our locations to find the location of your next house in Newport South, Newport for sale or to rent.
| Streets | Postcodes |
|---|---|
| Ashworth Way | TF10 7EG TF10 7RN TF10 7RW |
| Aspen Way | TF10 7EE |
| Audley Avenue | TF10 7DP TF10 7DS |
| Audley House Mews | TF10 7BP |
| Audley Road | TF10 7DN |
| Avenue Road | TF10 7EA |
| Avenue Road South | TF10 7DY |
| Barnmeadow Close | TF10 7NT |
| Barnmeadow Road | TF10 7NP TF10 7NR TF10 7NS TF10 7NU TF10 7NX |
| Beech Close | TF10 7ED |
| Broadway | TF10 7TP TF10 7TW |
| Brookside Avenue | TF10 7HN |
| Elm Close | TF10 7RS |
| Granville Avenue | TF10 7DX |
| Granville Close | TF10 7TR |
| Granville Road | TF10 7EQ |
| Granville Villas | TF10 7DU |
| High Meadows | TF10 7RY |
| Juniper Row | TF10 7RT |
| Meadow Road | TF10 7TG TF10 7TL |
| Meadow View Close | TF10 7NN |
| Meadow View Road | TF10 7NL TF10 7NW |
| Mulberry Close | TF10 9LX |
| Oak Avenue | TF10 7EF |
| Pen Y Bryn Way | TF10 7ER TF10 7ES |
| Pine Trees | TF10 7AS |
| Primrose Drive | TF10 9LY |
| Princess Gardens | TF10 7ET |
| Queens Drive | TF10 7EU |
| Richmond Close | TF10 9LZ |
| Rowan Drive | TF10 7RP |
| Shuker Close | TF10 7SG |
| Springfield Avenue | TF10 7HP TF10 7HW |
| Springfields | TF10 7EZ |
| Stafford Road | TF10 7QZ TF10 7RA |
| Station Court | TF10 7RZ |
| Station Road | TF10 7EN |
| Station Terrace | TF10 7EX |
| The Oaklands | TF10 7HA |
| Town Wells Mews | TF10 7BF |
| Upper Bar | TF10 7EH TF10 7EJ TF10 7GF |
| Wallshead Way | TF10 9LP TF10 9LS TF10 9LT TF10 9LU |
| Walnut Close | TF10 7RR |
| Wellington Road | TF10 7HJ TF10 7HX |
| Westfield Terrace | TF10 7EL |
Transport near Newport South
-
Oakengates Station
-
Telford Central Station
-
Shifnal Station
-
Wellington Station
-
Cosford Station
-
Albrighton Station
- FAQ
- Price Paid By Year
- Property Type Price
Frequently asked questions about Newport South
What is the average price for a property for sale in Newport South?
The average price for a property for sale in Newport South is £257,006. This amount is 14% lower than the average price in Newport. There are 242 property listings for sale in Newport South.
What streets have the most expensive properties for sale in Newport South?
The streets with the most expensive properties for sale in Newport South are Station Court at an average of £622,500, Station Road at an average of £435,166 and Stafford Road at an average of £427,500.
What streets have the most affordable properties for sale in Newport South?
The streets with the most affordable properties for sale in Newport South are Audley House Mews at an average of £113,409, Upper Bar at an average of £173,083 and Barnmeadow Close at an average of £180,000.
Which train stations are available in or near Newport South?
Some of the train stations available in or near Newport South are Oakengates, Telford Central and Shifnal.
Property Price Paid in Newport South by Year
The average sold property price by year was:
| Year | Average Sold Price | Price Change |
Sold Properties
|
|---|---|---|---|
| 2025 | £319,340 | 29% |
25 Properties |
| 2024 | £228,287 | -11% |
47 Properties |
| 2023 | £253,525 | -0,4% |
31 Properties |
| 2022 | £254,425 | 12% |
39 Properties |
| 2021 | £224,673 | 22% |
56 Properties |
| 2020 | £176,190 | -17% |
27 Properties |
| 2019 | £205,314 | -0,4% |
36 Properties |
| 2018 | £206,198 | -6% |
36 Properties |
| 2017 | £218,941 | 4% |
49 Properties |
| 2016 | £209,425 | 17% |
43 Properties |
| 2015 | £174,151 | -4% |
66 Properties |
| 2014 | £181,879 | -1% |
42 Properties |
| 2013 | £184,065 | 11% |
42 Properties |
| 2012 | £163,941 | 0,4% |
36 Properties |
| 2011 | £163,310 | -8% |
39 Properties |
| 2010 | £176,757 | -10% |
39 Properties |
| 2009 | £193,921 | 10% |
37 Properties |
| 2008 | £173,825 | -0,4% |
29 Properties |
| 2007 | £174,489 | 19% |
58 Properties |
| 2006 | £141,955 | -11% |
71 Properties |
| 2005 | £156,974 | 12% |
41 Properties |
| 2004 | £137,724 | 20% |
63 Properties |
| 2003 | £110,635 | 19% |
52 Properties |
| 2002 | £89,679 | 14% |
66 Properties |
| 2001 | £77,300 | 0,3% |
41 Properties |
| 2000 | £77,091 | 20% |
50 Properties |
| 1999 | £61,678 | -6% |
42 Properties |
| 1998 | £65,308 | 5% |
46 Properties |
| 1997 | £62,211 | 14% |
54 Properties |
| 1996 | £53,452 | 5% |
57 Properties |
| 1995 | £50,557 | - |
32 Properties |
Property Price per Property Type in Newport South
Here you can find historic sold price data in order to help with your property search.
The average Property Paid Price for specific property types in the last three years are:
| Property Type | Average Sold Price | Sold Properties |
|---|---|---|
| Semi Detached House | £277,141.00 | 46 Semi Detached Houses |
| Detached House | £343,964.00 | 42 Detached Houses |
| Terraced House | £200,544.00 | 37 Terraced Houses |
| Flat | £110,573.00 | 17 Flats |

