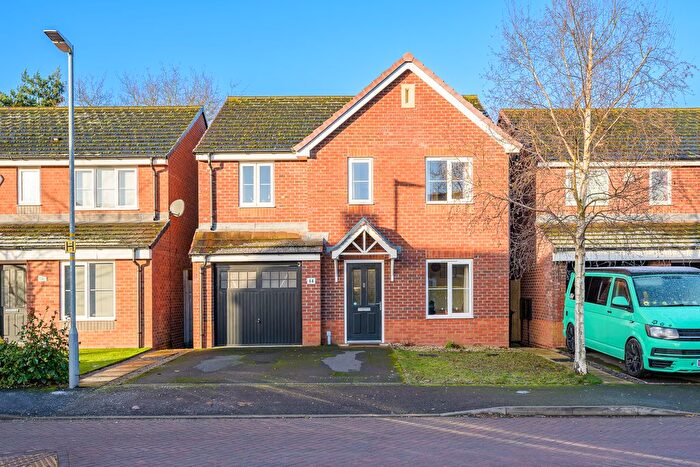
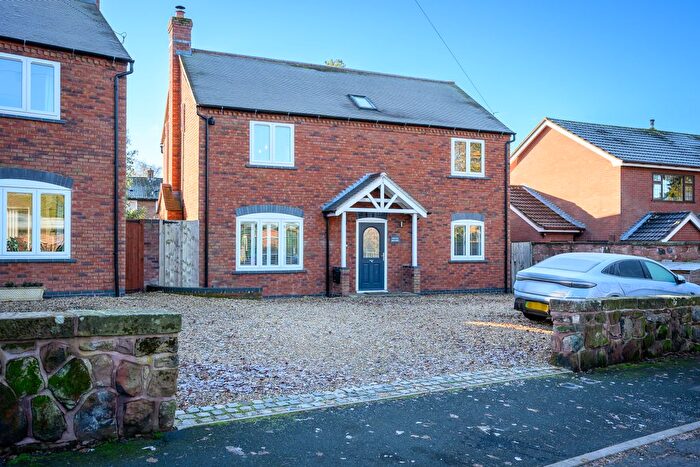
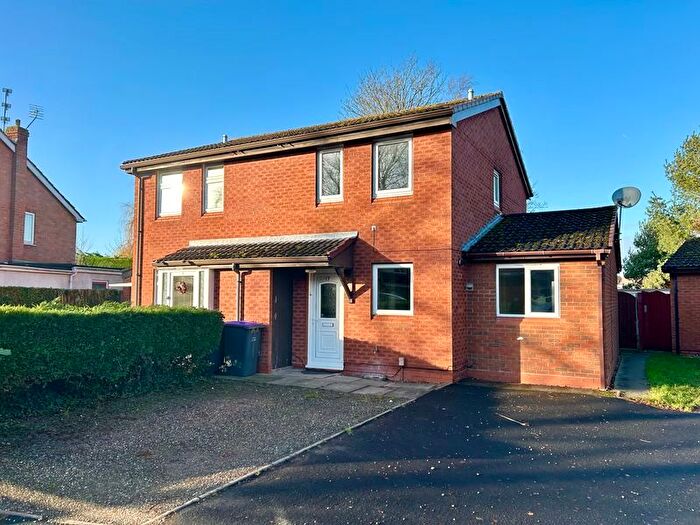
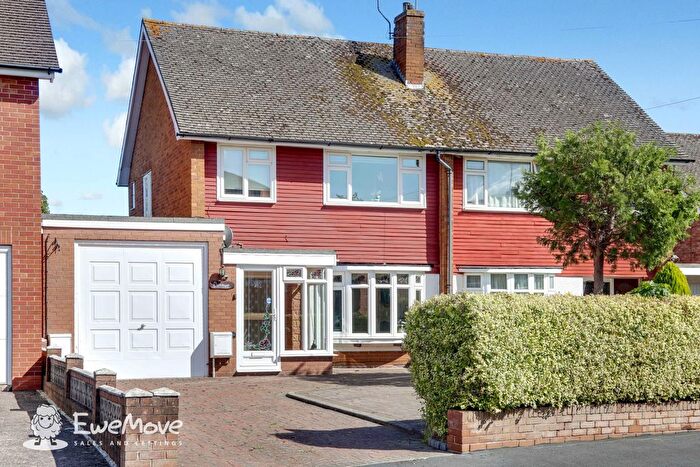
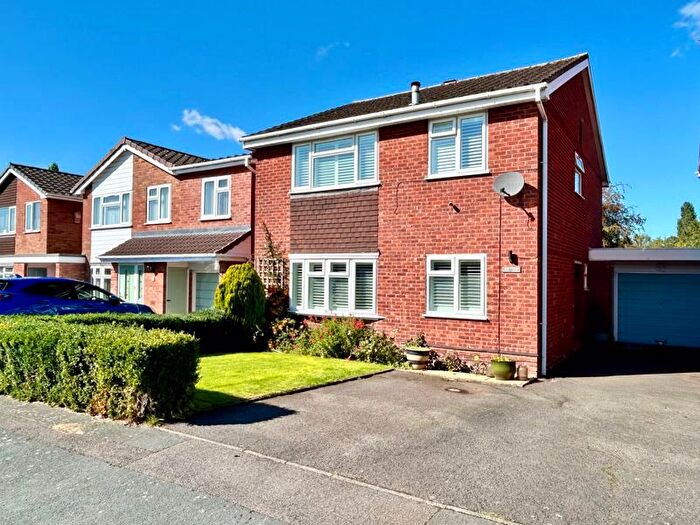
Houses for sale & to rent in Newport East, Newport
House Prices in Newport East
Properties in Newport East have an average house price of £263,017.00 and had 109 Property Transactions within the last 3 years¹.
Newport East is an area in Newport, Telford and Wrekin with 1,052 households², where the most expensive property was sold for £475,000.00.
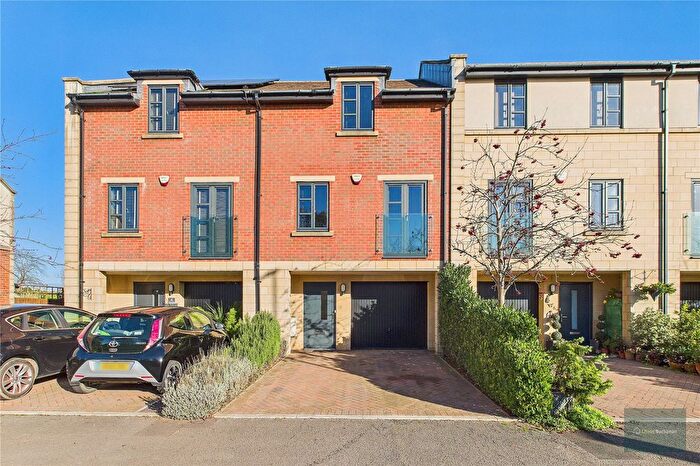
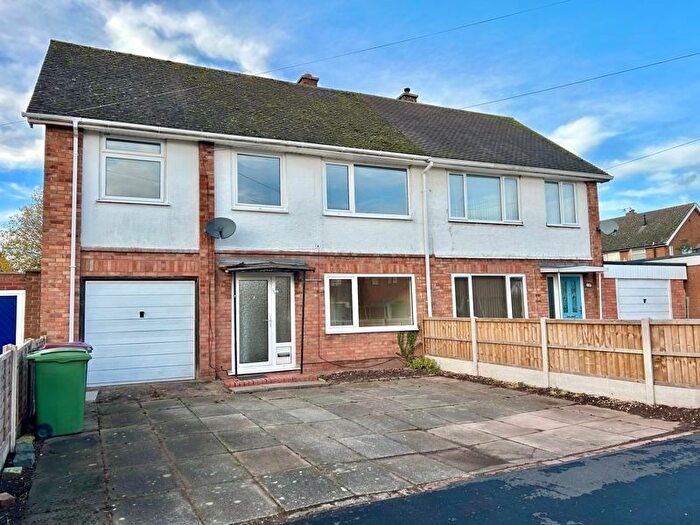
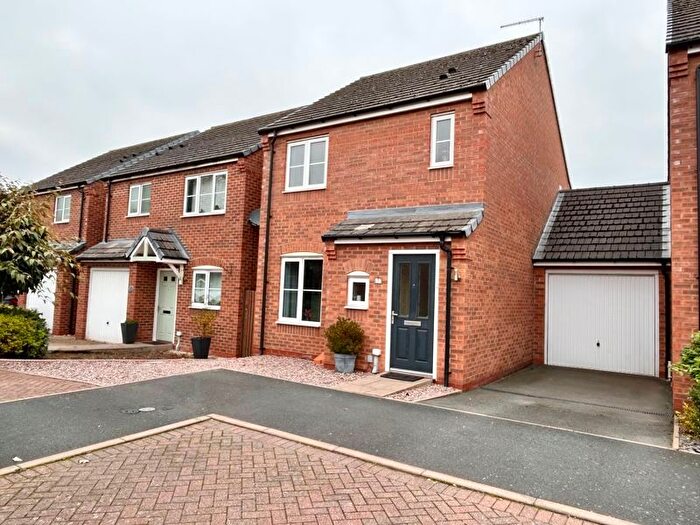
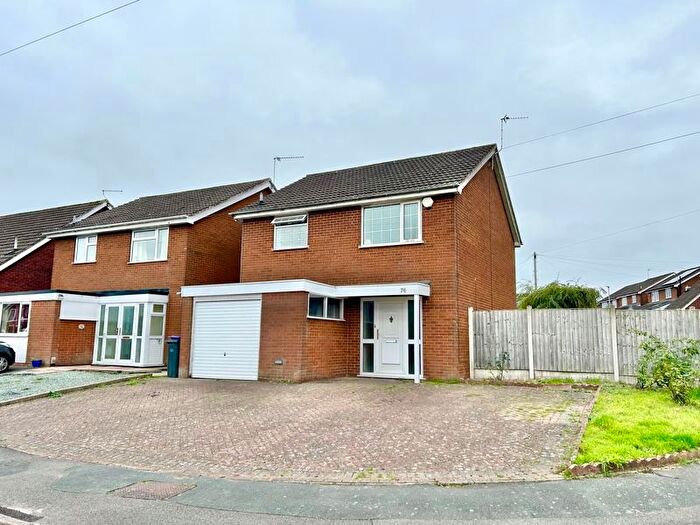
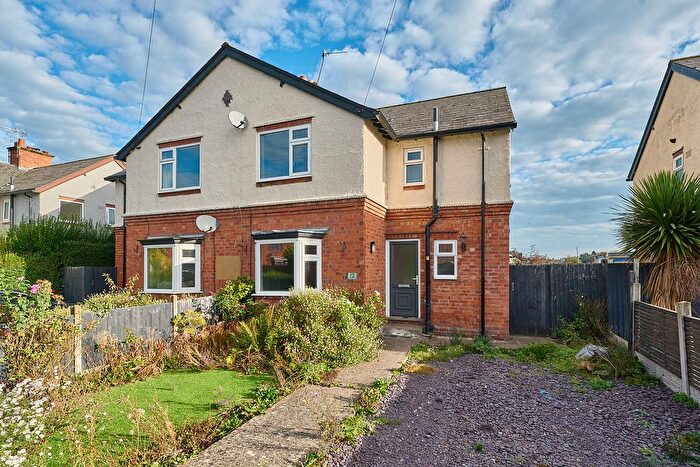
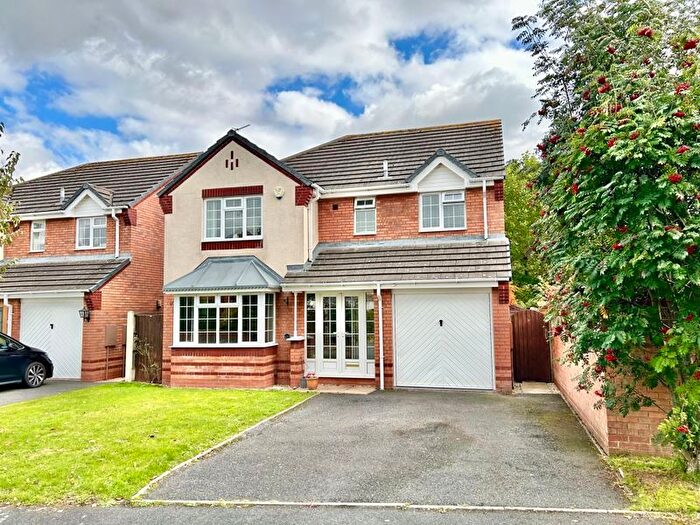
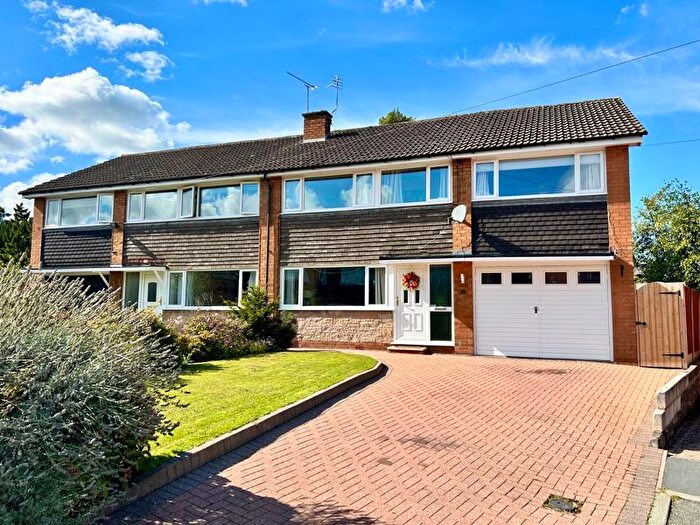
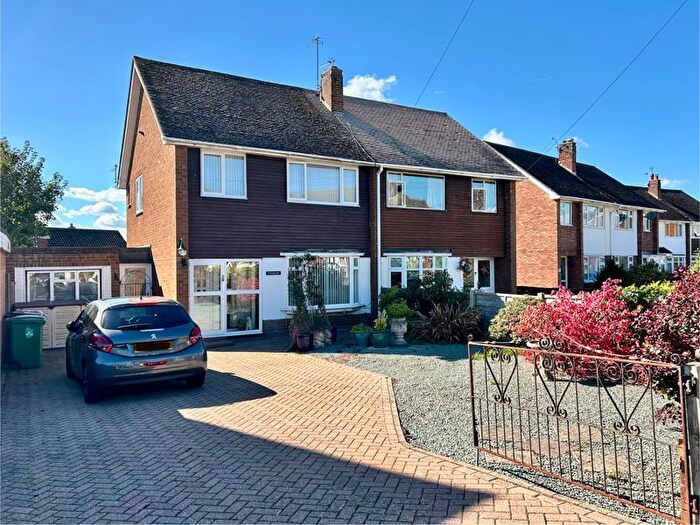
Properties for sale in Newport East
Previously listed properties in Newport East
Roads and Postcodes in Newport East
Navigate through our locations to find the location of your next house in Newport East, Newport for sale or to rent.
| Streets | Postcodes |
|---|---|
| Aqualate Close | TF10 7TF |
| Audley Road | TF10 7DL |
| Ben Jones Avenue | TF10 7XY |
| Broadway | TF10 7TN |
| Caldercrofts | TF10 7SP |
| Daniels Cross | TF10 7XJ |
| Drovers Way | TF10 7XN |
| Farriers Green | TF10 7XL |
| Fishers Lock | TF10 7BY TF10 7SR TF10 7ST TF10 7SU TF10 7SX TF10 7SY |
| Hampton Close | TF10 7RB |
| Hampton Drive | TF10 7RD TF10 7RE TF10 7RF TF10 7RH |
| Harcourt Drive | TF10 7SA |
| Henley Drive | TF10 7SB |
| Lapworth Way | TF10 7DG |
| Laurel Drive | TF10 7LY |
| Maynards Croft | TF10 7SZ TF10 7TA TF10 7TB |
| Meadow Road | TF10 7TH TF10 7TJ TF10 7TQ |
| Norbroom Court | TF10 7RQ |
| Norbroom Drive | TF10 7RG TF10 7TD TF10 7TE |
| Ploughmans Croft | TF10 7XP |
| Powell Place | TF10 7BS |
| Sandy Croft | TF10 7NG |
| Shepherds Court | TF10 7XW |
| Stafford Road | TF10 7LX TF10 7LZ TF10 7NA TF10 7QY |
| Summerhouse Grove | TF10 7DH TF10 7DQ |
| Tan Bank | TF10 7LJ TF10 7LL |
| The Horseshoes | TF10 7GG |
| Tomkinson Close | TF10 7XZ |
| Tudor Close | TF10 7TY |
| Victoria Park | TF10 7LH TF10 7LQ |
| Vineyard Court | TF10 7UY |
| Vineyard Drive | TF10 7DE TF10 7DF |
| Vineyard Road | TF10 7BZ TF10 7DA TF10 7DB TF10 7DD TF10 7HZ TF10 7LE TF10 7RU TF10 7SN TF10 7SW |
Transport near Newport East
- FAQ
- Price Paid By Year
- Property Type Price
Frequently asked questions about Newport East
What is the average price for a property for sale in Newport East?
The average price for a property for sale in Newport East is £263,017. This amount is 12% lower than the average price in Newport. There are 219 property listings for sale in Newport East.
What streets have the most expensive properties for sale in Newport East?
The streets with the most expensive properties for sale in Newport East are Maynards Croft at an average of £372,750, Drovers Way at an average of £322,000 and Stafford Road at an average of £321,600.
What streets have the most affordable properties for sale in Newport East?
The streets with the most affordable properties for sale in Newport East are Meadow Road at an average of £164,300, Shepherds Court at an average of £183,333 and Hampton Close at an average of £183,750.
Which train stations are available in or near Newport East?
Some of the train stations available in or near Newport East are Oakengates, Telford Central and Shifnal.
Property Price Paid in Newport East by Year
The average sold property price by year was:
| Year | Average Sold Price | Price Change |
Sold Properties
|
|---|---|---|---|
| 2025 | £280,961 | 8% |
13 Properties |
| 2024 | £257,578 | 3% |
19 Properties |
| 2023 | £248,908 | -8% |
29 Properties |
| 2022 | £268,834 | 9% |
48 Properties |
| 2021 | £243,403 | 12% |
52 Properties |
| 2020 | £213,874 | 9% |
36 Properties |
| 2019 | £194,080 | -5% |
46 Properties |
| 2018 | £203,233 | 4% |
52 Properties |
| 2017 | £195,490 | -4% |
48 Properties |
| 2016 | £202,604 | 13% |
57 Properties |
| 2015 | £175,464 | -15% |
58 Properties |
| 2014 | £200,948 | 14% |
46 Properties |
| 2013 | £172,184 | -0,2% |
42 Properties |
| 2012 | £172,515 | -11% |
29 Properties |
| 2011 | £192,203 | 10% |
27 Properties |
| 2010 | £173,130 | 9% |
23 Properties |
| 2009 | £157,416 | -10% |
18 Properties |
| 2008 | £172,426 | -12% |
23 Properties |
| 2007 | £193,834 | 11% |
49 Properties |
| 2006 | £172,674 | 12% |
54 Properties |
| 2005 | £151,728 | -12% |
39 Properties |
| 2004 | £170,188 | 25% |
49 Properties |
| 2003 | £127,937 | 16% |
50 Properties |
| 2002 | £106,846 | -3% |
55 Properties |
| 2001 | £109,593 | 31% |
90 Properties |
| 2000 | £75,976 | 12% |
46 Properties |
| 1999 | £66,794 | -1% |
58 Properties |
| 1998 | £67,508 | 6% |
61 Properties |
| 1997 | £63,202 | 11% |
53 Properties |
| 1996 | £56,368 | -8% |
73 Properties |
| 1995 | £60,735 | - |
36 Properties |
Property Price per Property Type in Newport East
Here you can find historic sold price data in order to help with your property search.
The average Property Paid Price for specific property types in the last three years are:
| Property Type | Average Sold Price | Sold Properties |
|---|---|---|
| Semi Detached House | £218,766.00 | 28 Semi Detached Houses |
| Detached House | £320,191.00 | 54 Detached Houses |
| Terraced House | £198,525.00 | 25 Terraced Houses |
| Flat | £145,000.00 | 2 Flats |

