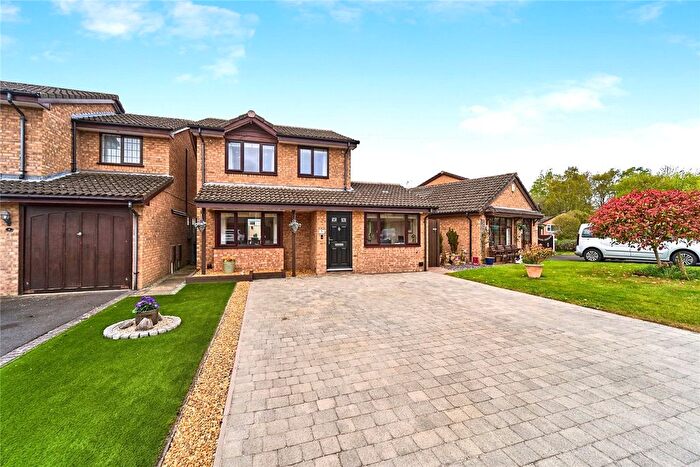
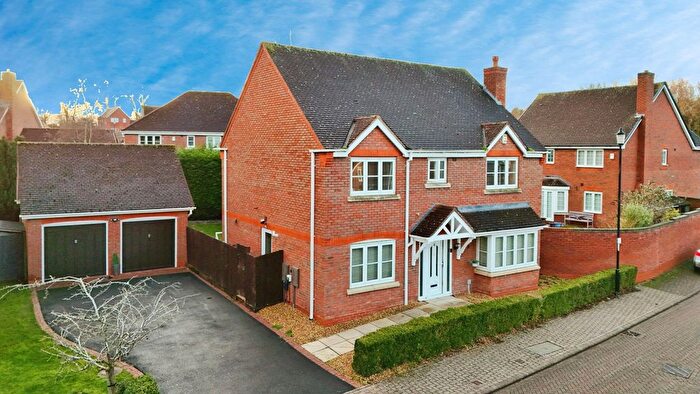
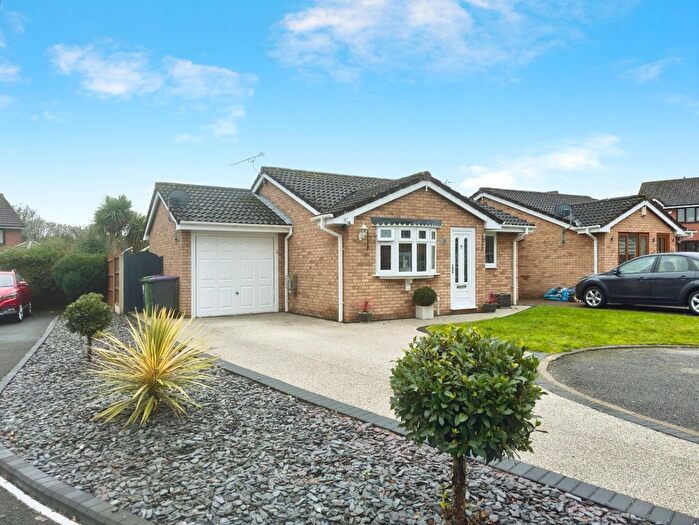
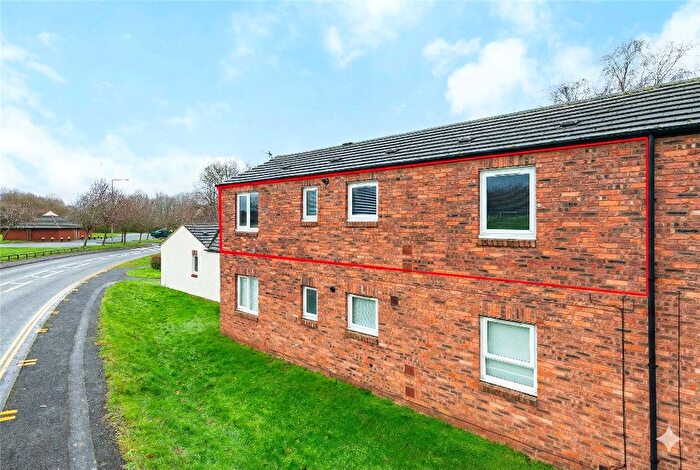
Houses for sale & to rent in Apley Castle, Telford
House Prices in Apley Castle
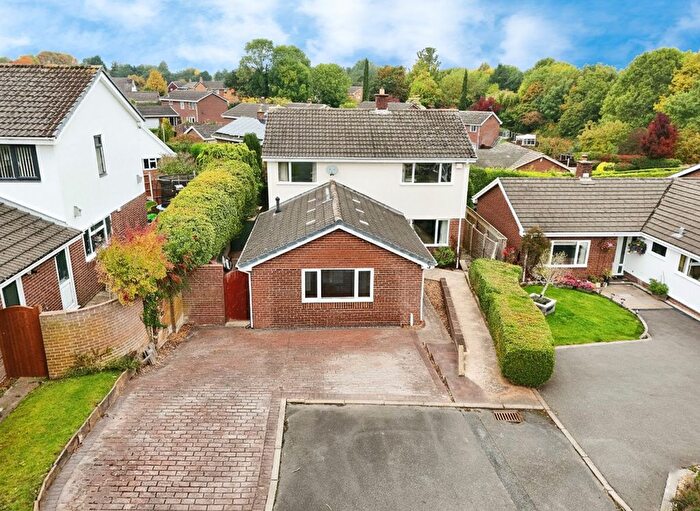
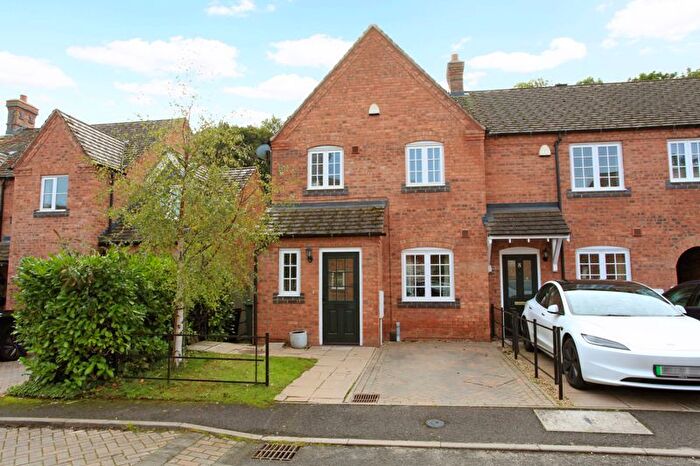
Properties in Apley Castle have an average house price of £312,801.00 and had 106 Property Transactions within the last 3 years¹.
Apley Castle is an area in Telford, Telford and Wrekin with 1,108 households², where the most expensive property was sold for £633,000.00.
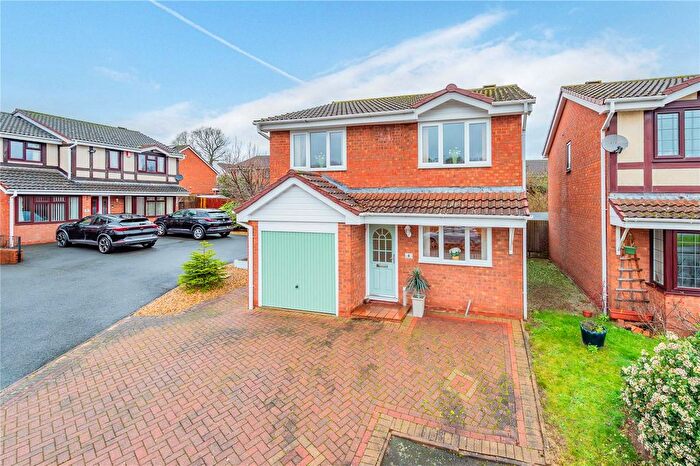
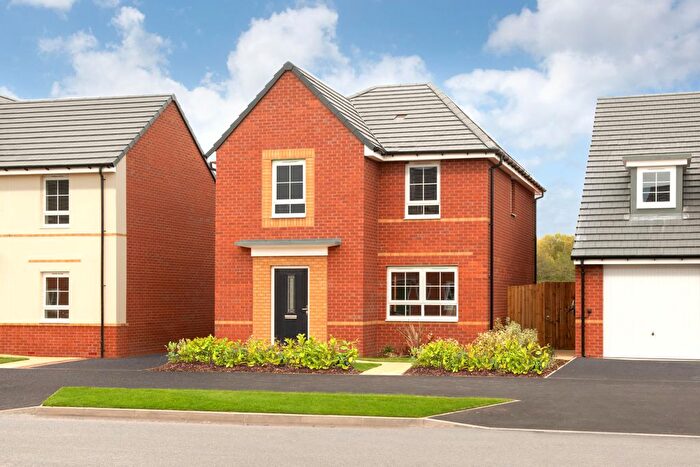
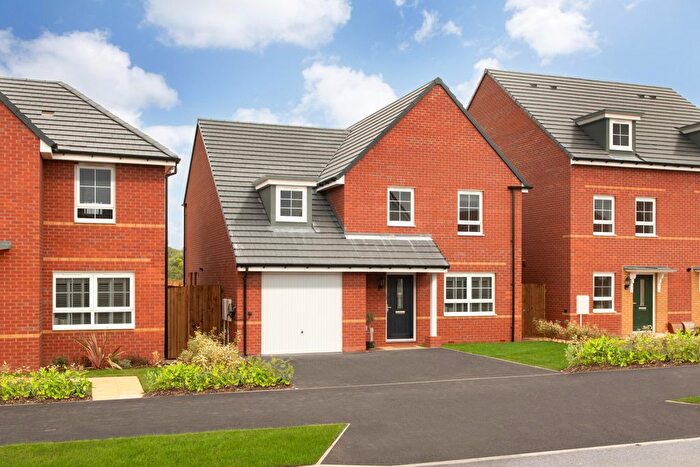
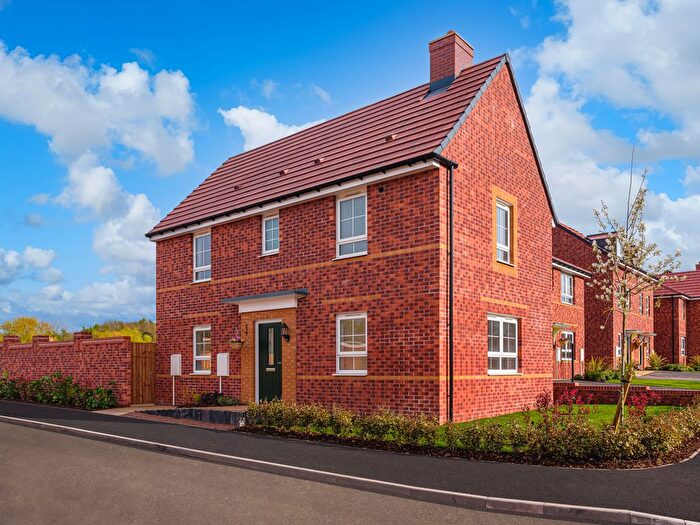
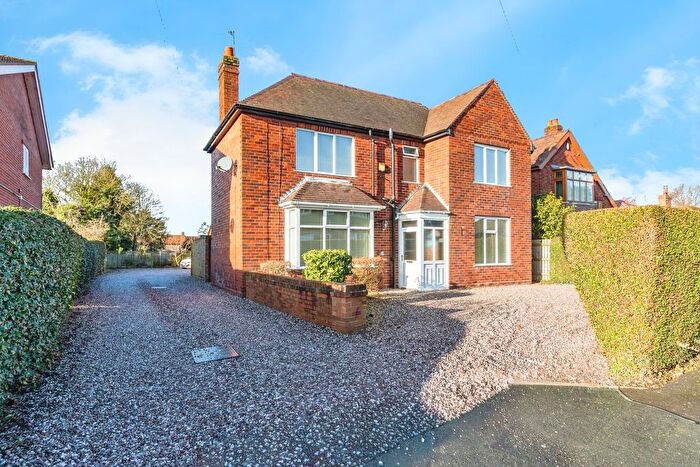
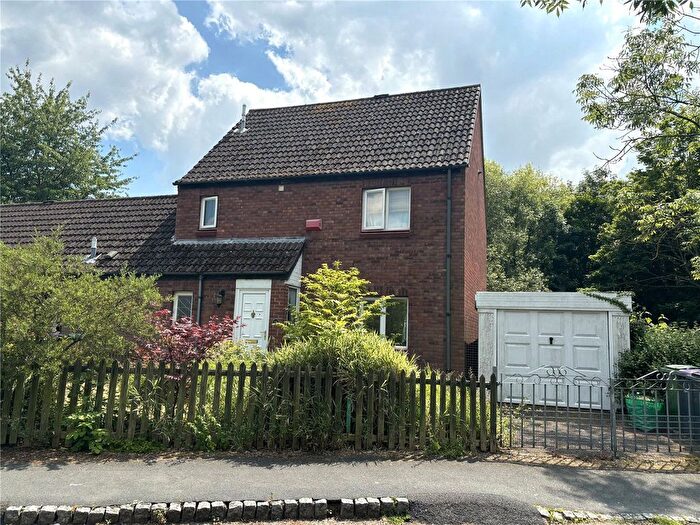
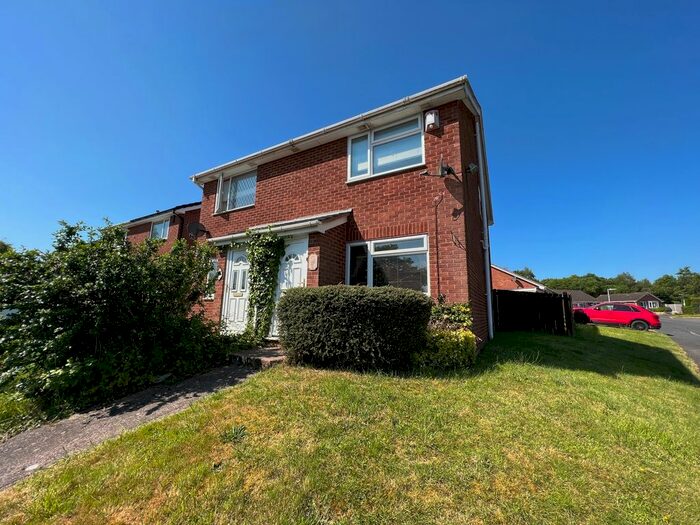
Properties for sale in Apley Castle
Roads and Postcodes in Apley Castle
Navigate through our locations to find the location of your next house in Apley Castle, Telford for sale or to rent.
| Streets | Postcodes |
|---|---|
| Albacore Road | TF1 6YD |
| Apley Castle | TF1 6DD TF1 6RH TF1 6WL |
| Apley Cottages | TF6 6DD |
| Auster Close | TF1 6YA |
| Bader Close | TF1 6YB |
| Barnes Wallis Drive | TF1 6XT |
| Beaufort Close | TF1 6XU |
| Blenheim Road | TF1 6YE |
| Brambling Close | TF1 6AP |
| Brandon Grove | TF1 6YR |
| Castle Gardens | TF1 6AE |
| Cavell Close | TF1 6DB |
| Chichester Drive | TF1 6YS TF1 6YT |
| Curie Croft | TF1 6DP |
| Dalby Close | TF1 6FJ |
| Dover Drive | TF1 6TF |
| Eider Drive | TF1 6TJ |
| Firecrest Drive | TF1 6FZ |
| Fleming Court | TF1 6DR |
| Fulmar Drive | TF1 6AR |
| Gatehouse Close | TF1 6RG |
| Gloucester Court | TF1 6YX |
| Goldcrest Grove | TF1 6TA |
| Goshawk Drive | TF1 6NJ |
| Grainger Drive | TF1 6UL |
| Greenfinch Close | TF1 6FY |
| Heatherdale | TF1 6YP TF1 6YW |
| Ice House Close | TF1 6RJ |
| Jay Drive | TF1 6FU |
| Kestrel Court | TF1 6FN |
| Kingfisher Way | TF1 6FW TF1 6WG |
| Manchester Drive | TF1 6XY |
| Merganser Close | TF1 6SG |
| Merlin Coppice | TF1 6TB |
| Montgomery Mews | TF1 6YU |
| Nightingale Way | TF1 6DT |
| Nuthatch Crescent | TF1 6AQ |
| Osprey Grove | TF1 6ND |
| Partridge Close | TF1 6WF |
| Pasteur Drive | TF1 6PQ |
| Peregrine Way | TF1 6TH TF1 6QL |
| Pintail Drive | TF1 6US TF1 6AT |
| Pool Farm Avenue | TF1 6FQ |
| Raven Meadow | TF1 6AW |
| Redwing Close | TF1 6FX |
| Royal Oak Drive | TF1 6SS |
| Sandpiper Close | TF1 6WH |
| Saxon Court | TF1 6YN |
| Shellduck Drive | TF1 6GA |
| Shoveller Drive | TF1 6GQ |
| Songthrush Close | TF1 6GF |
| Sparrowhawk Way | TF1 6NH |
| Stonechat Close | TF1 6WQ |
| Sulby Drive | TF1 6FP |
| Sunderland Drive | TF1 6XX |
| Teresa Way | TF1 6PG |
| Waxwing Meadow | TF1 6AS |
| Whinchat Close | TF1 6WJ |
| Wigeon Grove | TF1 6GZ |
| TF1 6DA |
Transport near Apley Castle
- FAQ
- Price Paid By Year
- Property Type Price
Frequently asked questions about Apley Castle
What is the average price for a property for sale in Apley Castle?
The average price for a property for sale in Apley Castle is £312,801. This amount is 44% higher than the average price in Telford. There are 435 property listings for sale in Apley Castle.
What streets have the most expensive properties for sale in Apley Castle?
The streets with the most expensive properties for sale in Apley Castle are Peregrine Way at an average of £619,333, Goldcrest Grove at an average of £531,000 and Eider Drive at an average of £481,599.
What streets have the most affordable properties for sale in Apley Castle?
The streets with the most affordable properties for sale in Apley Castle are Nightingale Way at an average of £140,381, Sunderland Drive at an average of £203,750 and Saxon Court at an average of £204,600.
Which train stations are available in or near Apley Castle?
Some of the train stations available in or near Apley Castle are Wellington, Oakengates and Telford Central.
Property Price Paid in Apley Castle by Year
The average sold property price by year was:
| Year | Average Sold Price | Price Change |
Sold Properties
|
|---|---|---|---|
| 2025 | £322,812 | -6% |
24 Properties |
| 2024 | £343,013 | 18% |
37 Properties |
| 2023 | £282,622 | -3% |
45 Properties |
| 2022 | £290,656 | -3% |
32 Properties |
| 2021 | £300,278 | 4% |
69 Properties |
| 2020 | £287,783 | 2% |
61 Properties |
| 2019 | £282,407 | 16% |
56 Properties |
| 2018 | £236,475 | -3% |
43 Properties |
| 2017 | £244,366 | 11% |
57 Properties |
| 2016 | £216,443 | 7% |
49 Properties |
| 2015 | £201,159 | -4% |
53 Properties |
| 2014 | £208,539 | 8% |
51 Properties |
| 2013 | £191,819 | -1% |
60 Properties |
| 2012 | £194,097 | 10% |
38 Properties |
| 2011 | £174,437 | -17% |
33 Properties |
| 2010 | £204,359 | -1% |
31 Properties |
| 2009 | £206,700 | 7% |
35 Properties |
| 2008 | £191,843 | -9% |
29 Properties |
| 2007 | £209,114 | -5% |
57 Properties |
| 2006 | £219,372 | 2% |
57 Properties |
| 2005 | £214,802 | 7% |
82 Properties |
| 2004 | £200,308 | 1% |
91 Properties |
| 2003 | £198,093 | 30% |
85 Properties |
| 2002 | £139,363 | 12% |
90 Properties |
| 2001 | £123,277 | -2% |
108 Properties |
| 2000 | £125,662 | 19% |
130 Properties |
| 1999 | £102,183 | 17% |
126 Properties |
| 1998 | £85,153 | 14% |
78 Properties |
| 1997 | £73,555 | 6% |
98 Properties |
| 1996 | £68,925 | -6% |
108 Properties |
| 1995 | £73,264 | - |
55 Properties |
Property Price per Property Type in Apley Castle
Here you can find historic sold price data in order to help with your property search.
The average Property Paid Price for specific property types in the last three years are:
| Property Type | Average Sold Price | Sold Properties |
|---|---|---|
| Semi Detached House | £217,815.00 | 19 Semi Detached Houses |
| Detached House | £365,350.00 | 72 Detached Houses |
| Terraced House | £194,615.00 | 13 Terraced Houses |
| Flat | £91,625.00 | 2 Flats |

