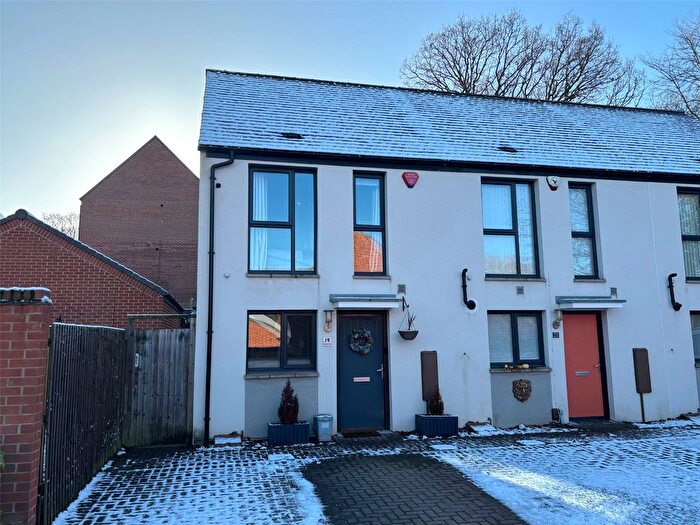
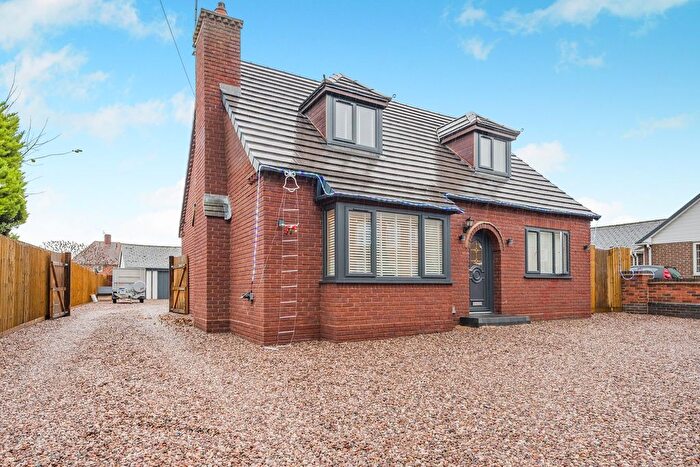
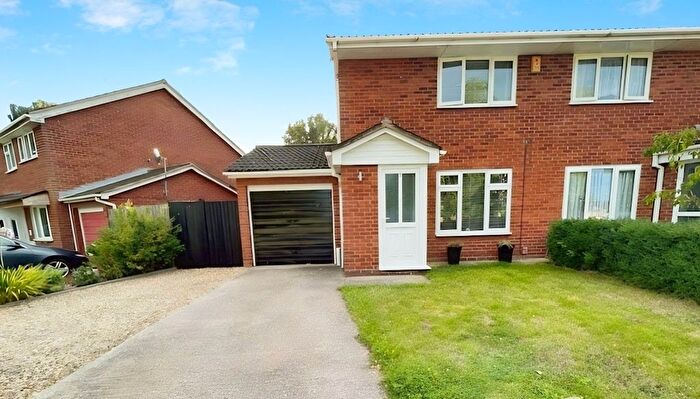
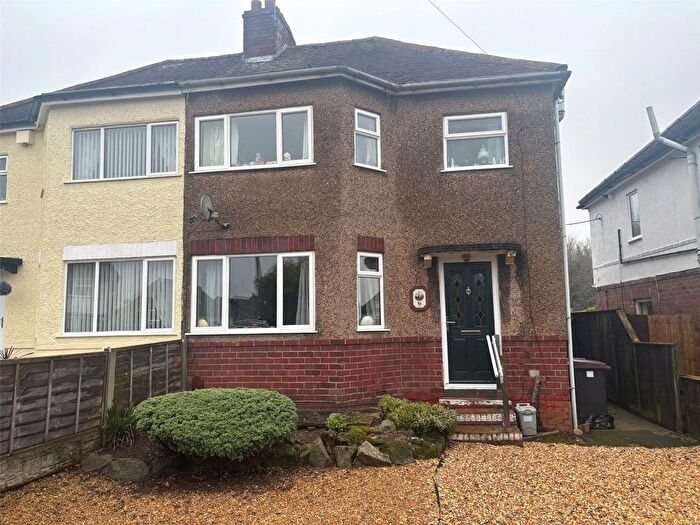
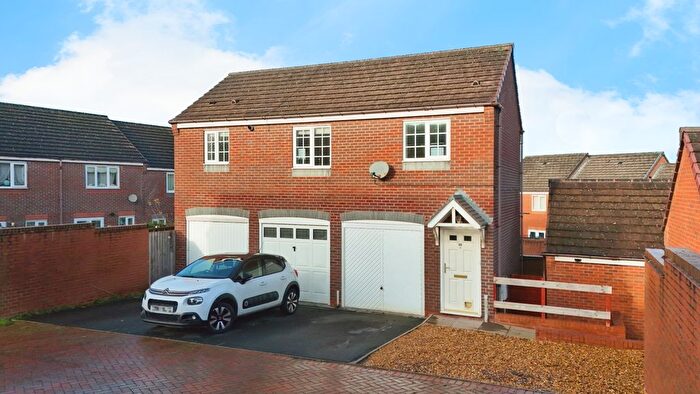
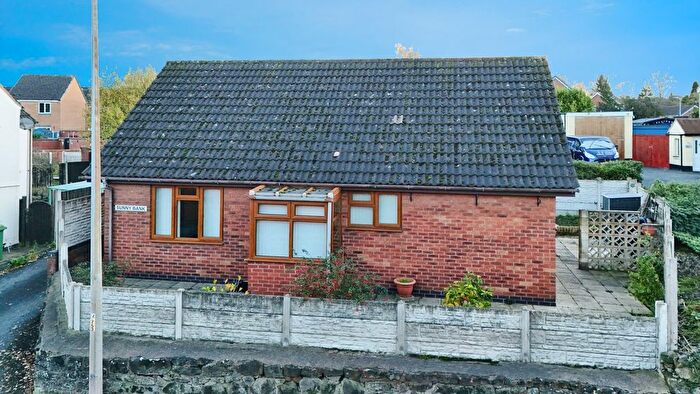
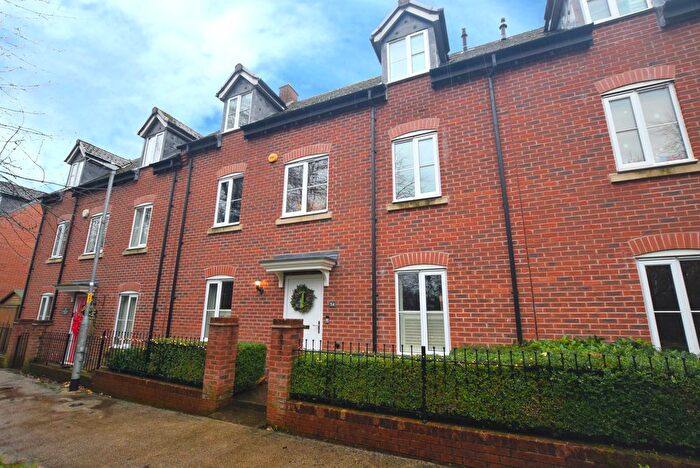
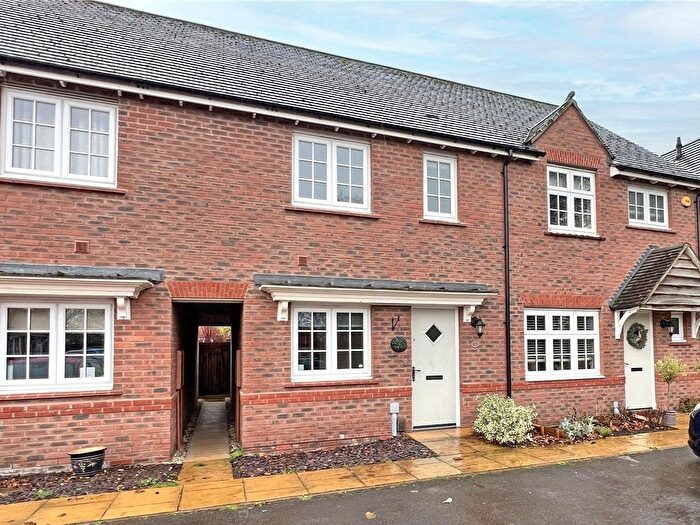
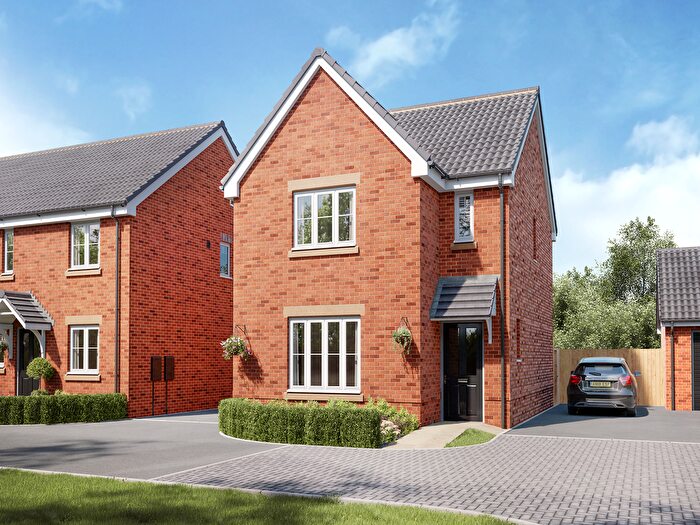
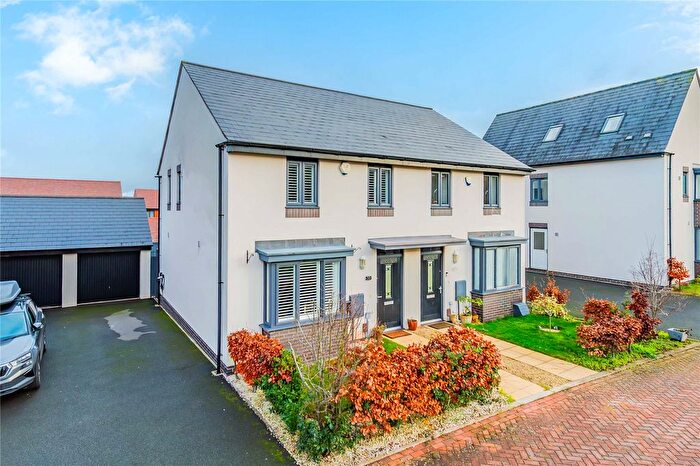
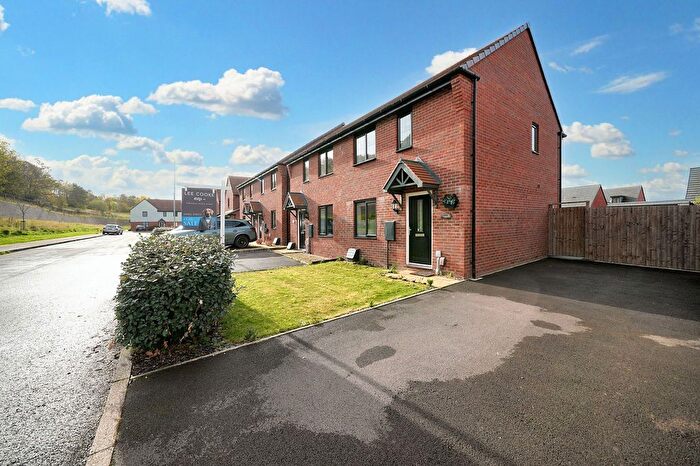
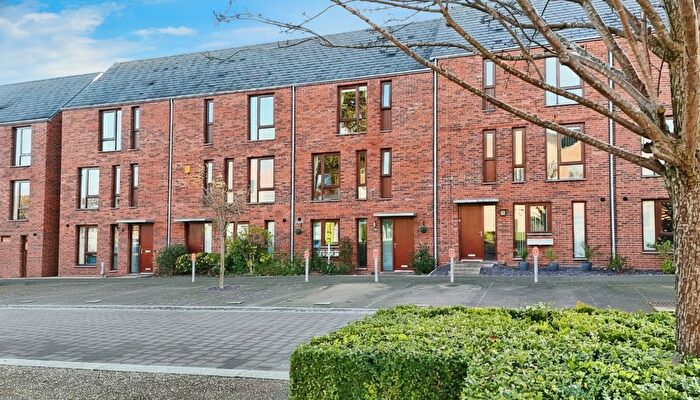
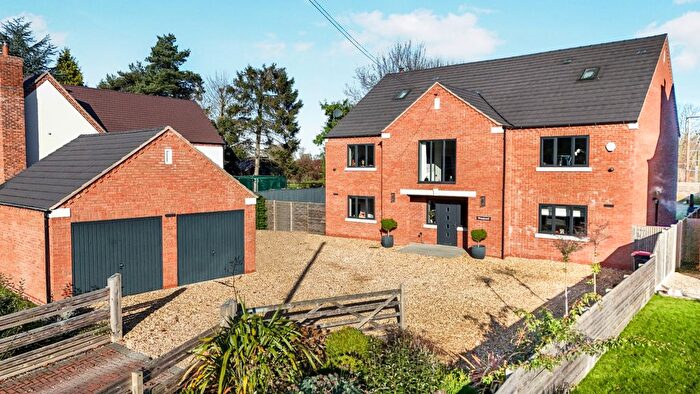
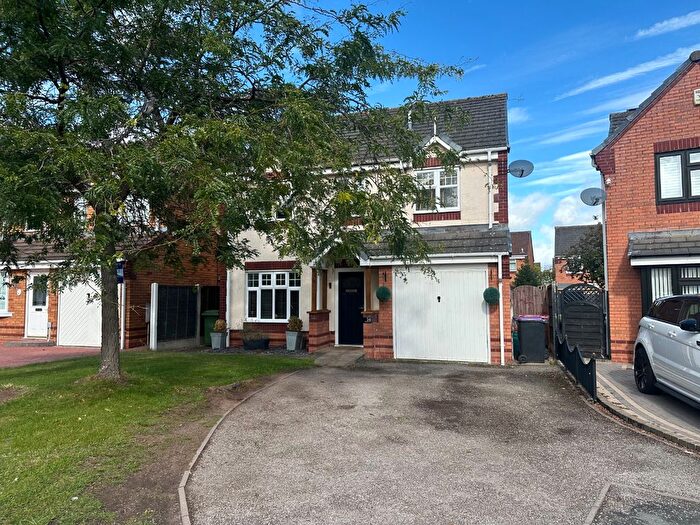
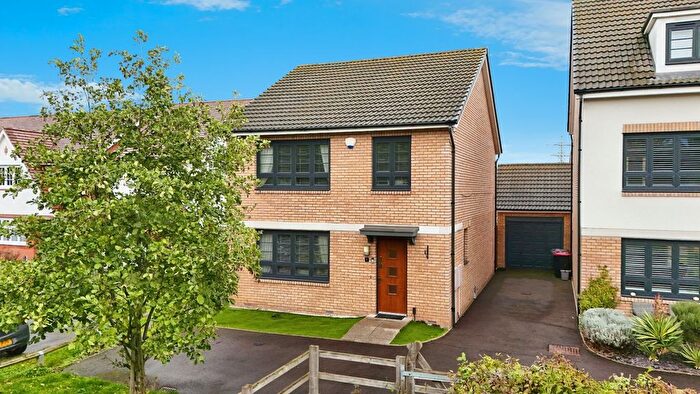
Houses for sale & to rent in Hadley And Leegomery, Telford
House Prices in Hadley And Leegomery
Properties in Hadley And Leegomery have an average house price of £203,287.00 and had 463 Property Transactions within the last 3 years¹.
Hadley And Leegomery is an area in Telford, Telford and Wrekin with 4,212 households², where the most expensive property was sold for £1,055,000.00.
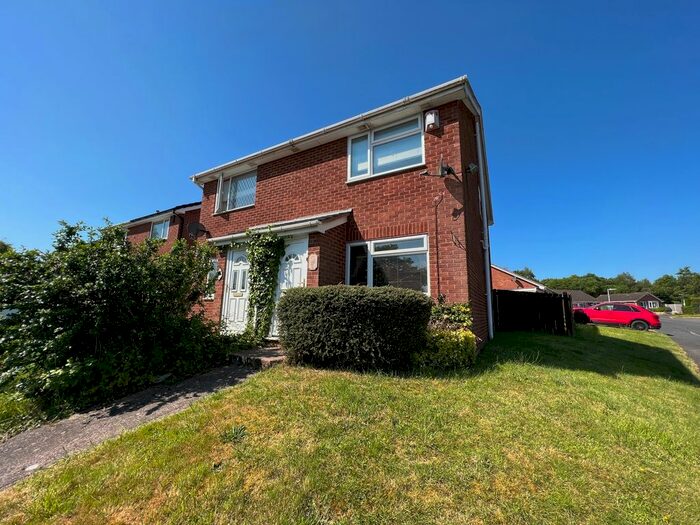
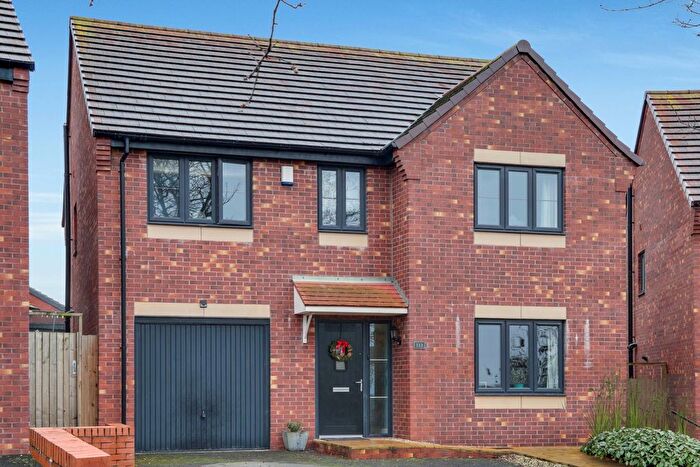
Properties for sale in Hadley And Leegomery
Roads and Postcodes in Hadley And Leegomery
Navigate through our locations to find the location of your next house in Hadley And Leegomery, Telford for sale or to rent.
| Streets | Postcodes |
|---|---|
| Acacia Drive | TF1 6XH TF1 6XJ TF1 6XL TF1 6XN |
| Aintree Close | TF1 6UY TF1 6UZ |
| Anson Drive | TF1 6XP TF1 6XW |
| Ashford Close | TF1 5LH |
| Ayr Close | TF1 6UN |
| Berberis Road | TF1 6XE TF1 6XF |
| Bevan Close | TF1 5HT |
| Beveley Road | TF2 6SD |
| Brecknock Court | TF1 6UQ |
| Bricklin Mews | TF1 5LU |
| Britannia Way | TF1 5PE |
| Brookdale | TF1 6LP TF1 6LW |
| Cactus Drive | TF1 6XA |
| Caldera Road | TF1 5LT |
| Carlisle Close | TF1 6YZ |
| Carmarthen Green | TF1 6UF |
| Castle Acre Road | TF1 6QZ |
| Castle Houses | TF1 6RB |
| Castle Lane | TF1 6RD |
| Castle Street | TF1 5GH TF1 5RA |
| Catterick Close | TF1 6UU |
| Chapel Row | TF6 6DP |
| Cheltenham Court | TF1 6UX |
| Chepstow Drive | TF1 6UP TF1 6UW |
| Chestnut Terrace | TF1 5SR |
| Chockleys Drive | TF1 6TR TF1 6TS TF1 6TT |
| Chockleys Meadow | TF1 6TL TF1 6TN TF1 6TP TF1 6TW |
| Church Street | TF1 5RH TF1 5RQ TF1 5RS TF1 5SA |
| Clematis Drive | TF1 6XB |
| Crescent Road | TF1 5JU TF1 5JX TF1 5JY TF1 5LE TF1 5LF TF1 5LG TF1 5LQ |
| Cumberland Mews | TF1 6UG |
| Curlew Drive | TF1 6WD |
| Cyril Hayward Court | TF1 5NB |
| Dove Close | TF1 5RE |
| Dover Drive | TF1 6TD |
| Dunlin Close | TF1 6WA |
| Elim Court | TF1 6LN |
| Epsom Court | TF1 6UR |
| Far Vallens | TF1 5SD TF1 5SE TF1 5SF |
| Gladstone House | TF1 5NF |
| Gladstone Street | TF1 5NP TF1 5NW |
| Granville Terrace | TF1 5SB |
| Grovefields | TF1 6YL |
| Hadley Gardens | TF1 6QH TF1 6QQ |
| Hadley Lodge Road | TF1 5RX |
| Hadley Park Road | TF1 6PN TF1 6PS TF1 6PW TF1 6QA TF1 6QB TF1 6QE TF1 6QF TF1 6QG |
| Halifax Drive | TF1 6XR TF1 6XS |
| Hall Dene | TF1 5JW |
| Haybridge Avenue | TF1 5JP TF1 5JR TF1 5JS TF1 5JT |
| Haybridge Road | TF1 5JJ TF1 5JL TF1 5LR TF1 6JE TF1 6JJ TF1 6JL TF1 6LR TF1 6LT |
| Hedingham Road | TF1 6ZT |
| High Street | TF1 5NG TF1 5NL |
| Honeysuckle Close | TF1 6RA |
| Horton Lane | TF6 6DT |
| Hurleybrook Way | TF1 6TU TF1 6TX TF1 6TY TF1 6TZ TF1 6UA TF1 6UB |
| Japonica Drive | TF1 6XD |
| Kearton Terrace | TF1 5RU TF1 5RZ |
| Leegomery Cottages | TF1 6QN |
| Leicester Way | TF1 6UT |
| Longthorpe Drive | TF1 6SN |
| Lucerne Close | TF1 6PH |
| Mafeking Road | TF1 5LA TF1 5LB TF1 5LD |
| Manor Road | TF1 5PL TF1 5PN |
| Manse Road | TF1 5NH TF1 5NJ |
| Marlborough Road | TF1 5LJ TF1 5LN |
| Mercia Drive | TF1 6YF TF1 6YG TF1 6YH TF1 6YJ TF1 6YQ |
| Millstream Way | TF1 6QP TF1 6QR TF1 6QS TF1 6QT |
| Near Vallens | TF1 5SH |
| Oakworth Close | TF1 5DP TF1 5DR |
| Okehampton Road | TF1 6ZS |
| Parish Drive | TF1 5AP |
| Park Court | TF1 6AD |
| Parkdale | TF1 6PE TF1 6PF |
| Pool Meadow | TF1 5RJ TF1 5RL TF1 5RN TF1 5RR |
| Porchester Close | TF1 6ZU |
| Radnor Court | TF1 6UE |
| Redlands Road | TF1 5LP TF1 5LW |
| Regal Court | TF1 5JG |
| Ripley Close | TF1 6YY |
| Riven Road | TF1 5LL |
| Rutland Green | TF1 6UD |
| Sandal Close | TF1 6ZY |
| Sankey Drive | TF1 6PJ |
| South View | TF1 6SX |
| Spruce Drive | TF1 6XG |
| Summer House Drive | TF1 6JN |
| Sunningdale | TF1 5NR TF1 5NS TF1 5NT TF1 5NY |
| The Grove | TF1 6PT |
| The Nettlefolds | TF1 5PF TF1 5PG |
| Trench Lock | TF1 5SP TF1 5SU |
| Turnstone Drive | TF1 6WB |
| Union Court | TF1 5SJ |
| Union Street | TF1 5RF TF1 5RG |
| Victoria Court | TF1 5FL |
| Warwick Way | TF1 6JZ |
| Waterloo Close | TF1 5SL |
| Waterloo Road | TF1 5NX |
| Westmorland Mews | TF1 6UH |
| Wheatley Crescent | TF1 6PZ |
| Whimbrel Close | TF1 6WE |
| Woodpecker Close | TF1 6NQ |
| TF1 5RT TF1 6QJ TF6 6DR TF6 6DS TF6 6DW |
Transport near Hadley And Leegomery
- FAQ
- Price Paid By Year
- Property Type Price
Frequently asked questions about Hadley And Leegomery
What is the average price for a property for sale in Hadley And Leegomery?
The average price for a property for sale in Hadley And Leegomery is £203,287. This amount is 6% lower than the average price in Telford. There are 1,550 property listings for sale in Hadley And Leegomery.
What streets have the most expensive properties for sale in Hadley And Leegomery?
The streets with the most expensive properties for sale in Hadley And Leegomery are Horton Lane at an average of £729,800, Carlisle Close at an average of £361,250 and Woodpecker Close at an average of £343,333.
What streets have the most affordable properties for sale in Hadley And Leegomery?
The streets with the most affordable properties for sale in Hadley And Leegomery are Cheltenham Court at an average of £95,783, Hurleybrook Way at an average of £110,687 and Chepstow Drive at an average of £113,650.
Which train stations are available in or near Hadley And Leegomery?
Some of the train stations available in or near Hadley And Leegomery are Wellington, Oakengates and Telford Central.
Property Price Paid in Hadley And Leegomery by Year
The average sold property price by year was:
| Year | Average Sold Price | Price Change |
Sold Properties
|
|---|---|---|---|
| 2025 | £226,702 | 14% |
66 Properties |
| 2024 | £194,811 | -4% |
130 Properties |
| 2023 | £202,619 | 1% |
120 Properties |
| 2022 | £200,815 | 9% |
147 Properties |
| 2021 | £182,507 | 9% |
143 Properties |
| 2020 | £165,838 | 15% |
113 Properties |
| 2019 | £140,994 | 2% |
169 Properties |
| 2018 | £137,488 | 5% |
138 Properties |
| 2017 | £130,393 | -5% |
149 Properties |
| 2016 | £137,397 | -2% |
168 Properties |
| 2015 | £139,638 | 6% |
142 Properties |
| 2014 | £131,573 | 6% |
136 Properties |
| 2013 | £123,809 | -1% |
99 Properties |
| 2012 | £125,276 | -2% |
99 Properties |
| 2011 | £127,272 | -10% |
141 Properties |
| 2010 | £139,484 | 6% |
108 Properties |
| 2009 | £130,659 | 0,1% |
91 Properties |
| 2008 | £130,550 | -6% |
108 Properties |
| 2007 | £138,555 | 7% |
231 Properties |
| 2006 | £129,267 | -4% |
272 Properties |
| 2005 | £134,958 | 8% |
214 Properties |
| 2004 | £124,150 | 20% |
319 Properties |
| 2003 | £99,315 | 19% |
260 Properties |
| 2002 | £80,494 | 22% |
223 Properties |
| 2001 | £62,553 | -7% |
222 Properties |
| 2000 | £67,049 | 4% |
251 Properties |
| 1999 | £64,139 | 13% |
279 Properties |
| 1998 | £55,486 | 29% |
197 Properties |
| 1997 | £39,347 | -3% |
126 Properties |
| 1996 | £40,371 | 11% |
155 Properties |
| 1995 | £35,773 | - |
96 Properties |
Property Price per Property Type in Hadley And Leegomery
Here you can find historic sold price data in order to help with your property search.
The average Property Paid Price for specific property types in the last three years are:
| Property Type | Average Sold Price | Sold Properties |
|---|---|---|
| Flat | £91,480.00 | 46 Flats |
| Semi Detached House | £184,772.00 | 159 Semi Detached Houses |
| Detached House | £317,349.00 | 131 Detached Houses |
| Terraced House | £149,310.00 | 127 Terraced Houses |

