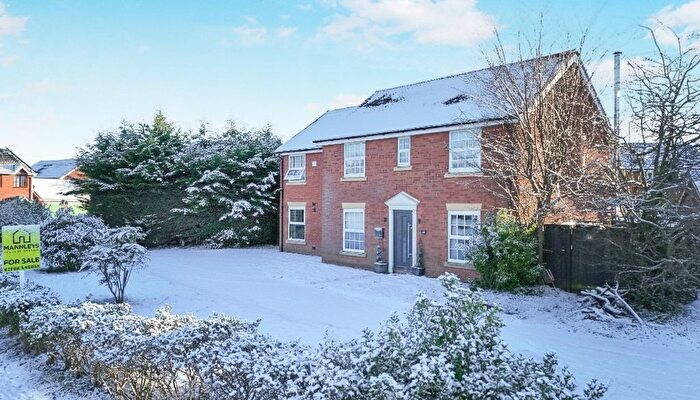
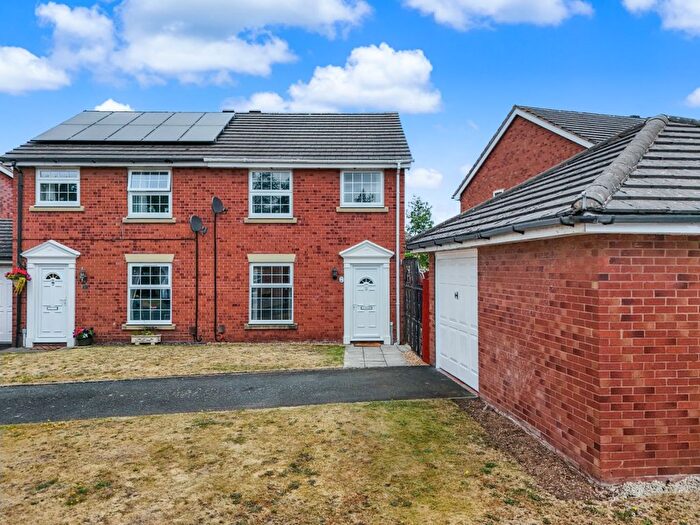
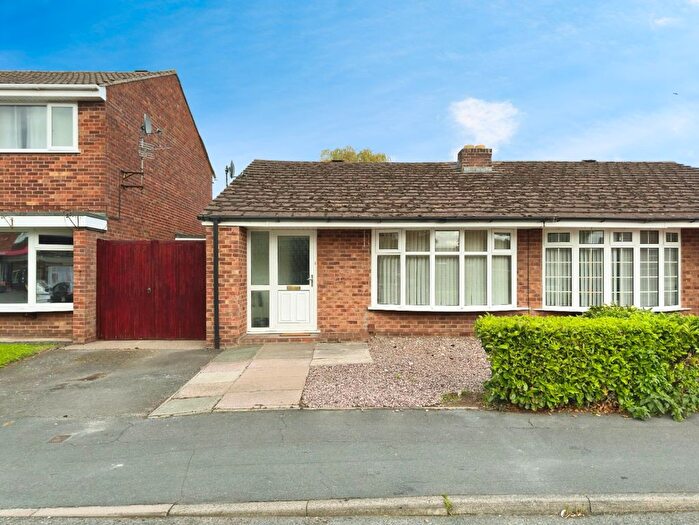
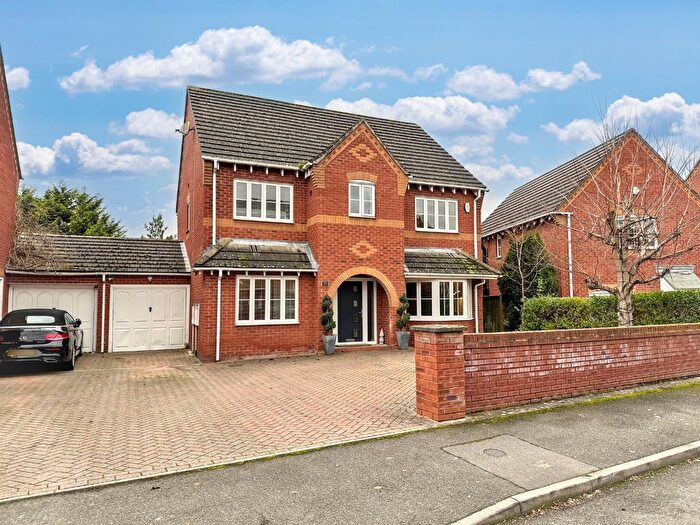
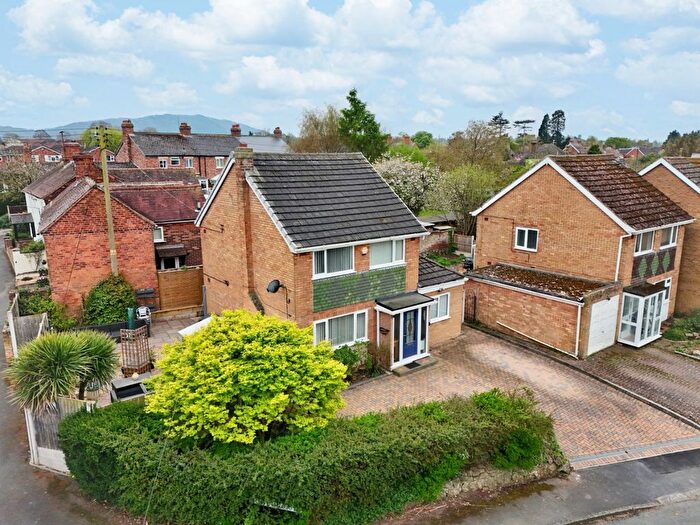
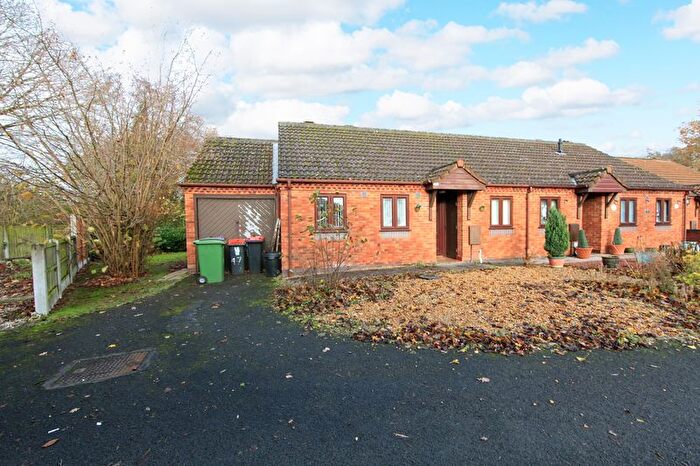
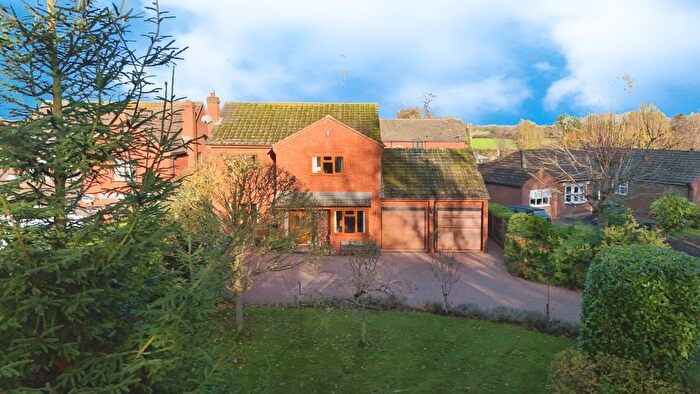
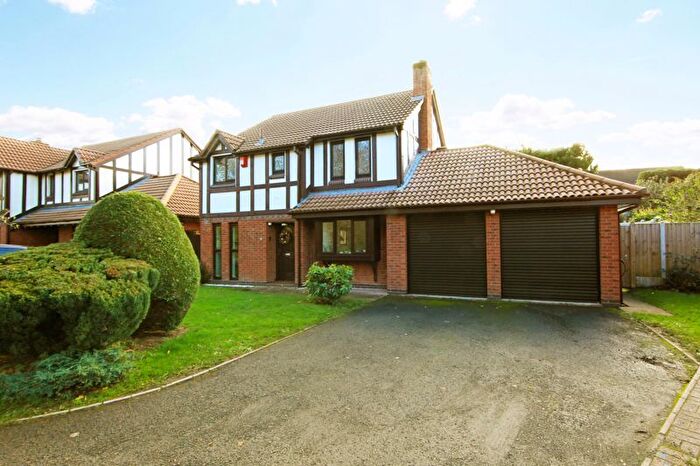
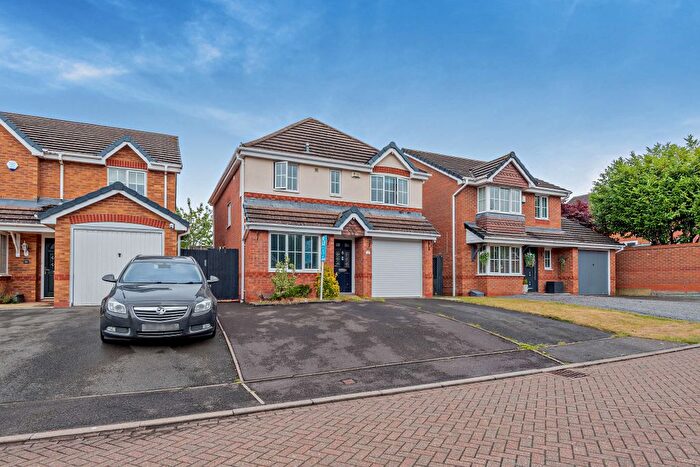
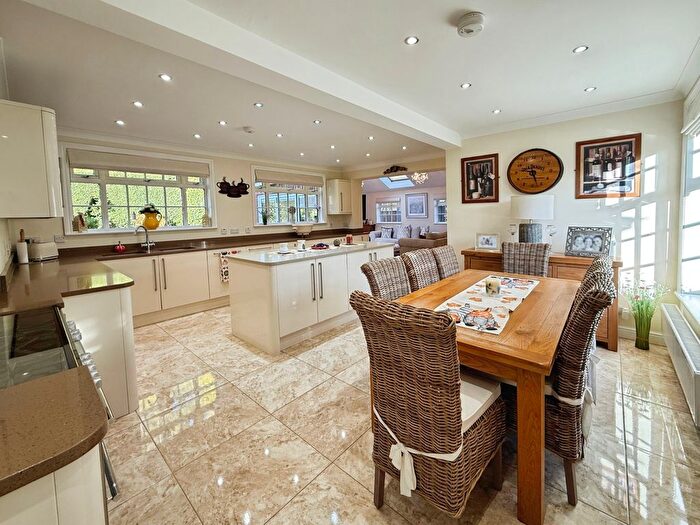
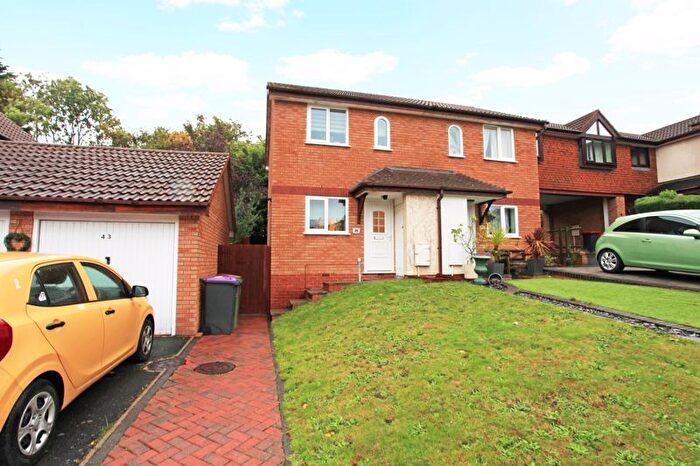
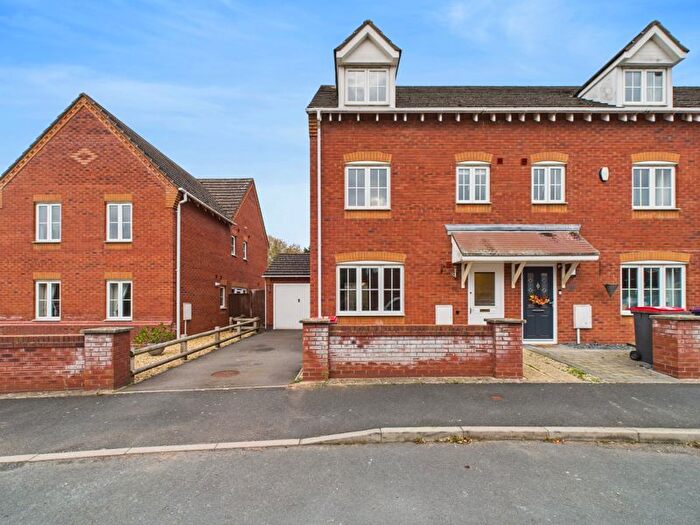
Houses for sale & to rent in Shawbirch, Telford
House Prices in Shawbirch
Properties in Shawbirch have an average house price of £258,194.00 and had 139 Property Transactions within the last 3 years¹.
Shawbirch is an area in Telford, Telford and Wrekin with 1,186 households², where the most expensive property was sold for £650,000.00.
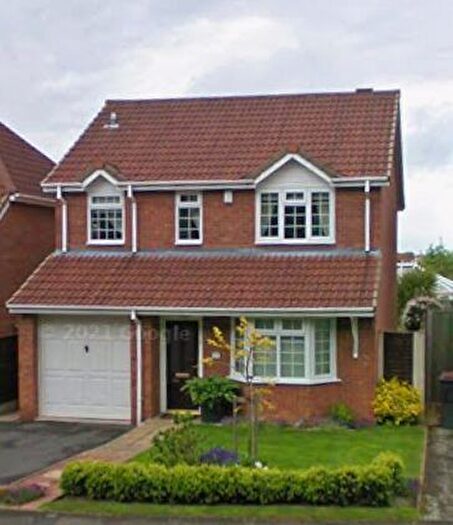
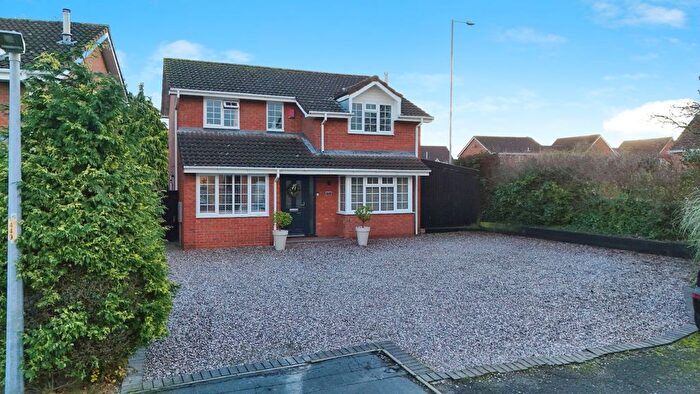
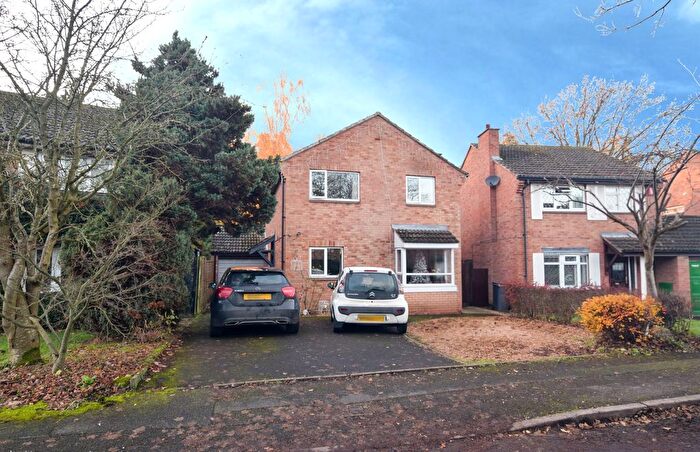
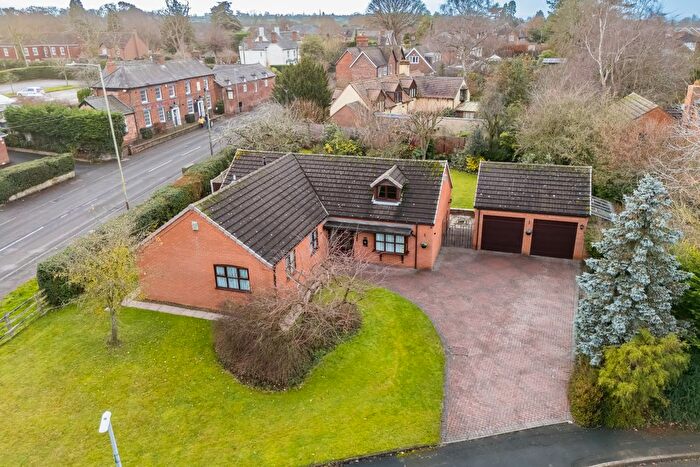
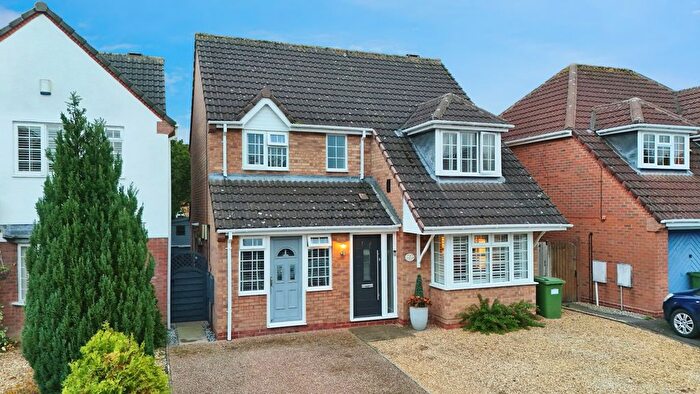
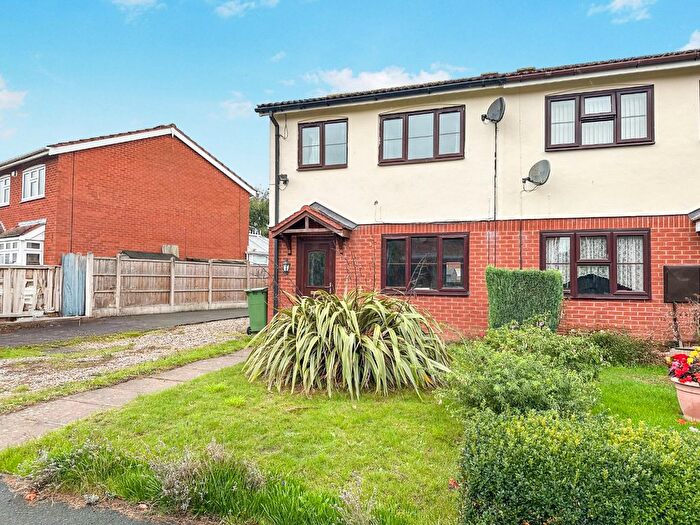
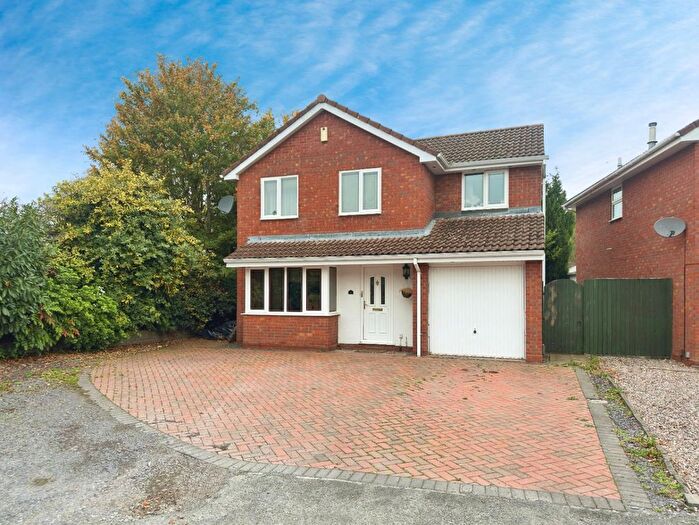
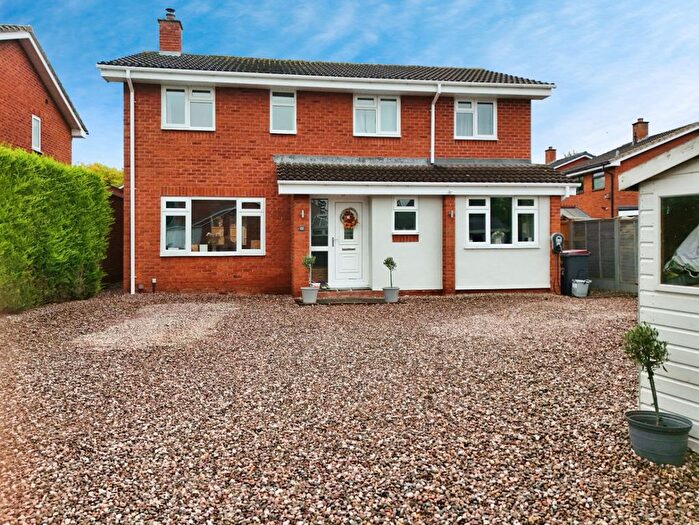
Properties for sale in Shawbirch
Previously listed properties in Shawbirch
Roads and Postcodes in Shawbirch
Navigate through our locations to find the location of your next house in Shawbirch, Telford for sale or to rent.
| Streets | Postcodes |
|---|---|
| Acorn Mews | TF5 0JA |
| Acorn Way | TF5 0LW |
| Allertons Meadow | TF5 0NW |
| Arrow Road | TF5 0LF |
| Aspen Way | TF5 0LH |
| Blackthorn Grove | TF5 0LL |
| Brockford Glade | TF1 3PX |
| Brockwood Copse | TF1 3QS |
| Brook Meadow | TF5 0NP |
| Butts Road | TF5 0NH |
| Coachman Meadow | TF1 3PG |
| Constable Drive | TF5 0PJ |
| Cote Road | TF5 0NQ |
| Crowdale Road | TF5 0NJ |
| Fallow Road | TF5 0LS |
| Forest Close | TF5 0LA |
| Foxs Covert | TF5 0LP |
| Gainsborough Way | TF5 0PS |
| Glade Way | TF5 0LD TF5 0LQ |
| Gosling Park | TF5 0PT |
| Guisbourne Avenue | TF5 0LG |
| Harrington Heath | TF5 0LE |
| Hopkins Heath | TF5 0LU TF5 0LX TF5 0LY TF5 0LZ |
| Horsechestnut Drive | TF5 0LN |
| Leeses Close | TF5 0NN |
| Linnet Gate | TF1 3QB |
| Lower Park Drive | TF1 3PY |
| Lowry Close | TF5 0PR |
| Marsh Meadow Close | TF1 3PZ |
| Mccormick Drive | TF1 3LZ |
| Mere Grove | TF5 0NR |
| Moat Close | TF1 3QL |
| Mole Way | TF5 0JZ |
| Monet Close | TF5 0PP |
| New River Close | TF1 3QJ |
| Oakfield Road | TF5 0NA TF5 0NB TF5 0ND TF5 0NG TF5 0LT |
| Picasso Close | TF5 0PN |
| Plover Gate | TF1 3QD |
| Quail Gate | TF1 3QE |
| Rembrandt Drive | TF5 0PL |
| Shawbirch Cross Roads | TF1 3QA |
| Shawbirch Road | TF5 0AA |
| Sherwood Close | TF5 0LB |
| Spafield Close | TF5 0NL |
| Span Meadow | TF5 0NE TF5 0NF |
| St Marks Close | TF1 3LA |
| Stile Rise | TF5 0LR |
| Swan Gate | TF1 3QF |
| Swift Gate | TF1 3QG |
| Tee Lake Boulevard | TF1 3QH |
| Wych Elm Drive | TF5 0LJ |
Transport near Shawbirch
- FAQ
- Price Paid By Year
- Property Type Price
Frequently asked questions about Shawbirch
What is the average price for a property for sale in Shawbirch?
The average price for a property for sale in Shawbirch is £258,194. This amount is 20% higher than the average price in Telford. There are 485 property listings for sale in Shawbirch.
What streets have the most expensive properties for sale in Shawbirch?
The streets with the most expensive properties for sale in Shawbirch are Tee Lake Boulevard at an average of £433,750, Blackthorn Grove at an average of £386,500 and Crowdale Road at an average of £361,000.
What streets have the most affordable properties for sale in Shawbirch?
The streets with the most affordable properties for sale in Shawbirch are Swift Gate at an average of £156,500, Oakfield Road at an average of £165,755 and Guisbourne Avenue at an average of £184,500.
Which train stations are available in or near Shawbirch?
Some of the train stations available in or near Shawbirch are Wellington, Oakengates and Telford Central.
Property Price Paid in Shawbirch by Year
The average sold property price by year was:
| Year | Average Sold Price | Price Change |
Sold Properties
|
|---|---|---|---|
| 2025 | £237,320 | -11% |
25 Properties |
| 2024 | £263,394 | -7% |
43 Properties |
| 2023 | £281,390 | 12% |
32 Properties |
| 2022 | £246,809 | 1% |
39 Properties |
| 2021 | £245,085 | 9% |
38 Properties |
| 2020 | £223,587 | 6% |
37 Properties |
| 2019 | £210,458 | 11% |
36 Properties |
| 2018 | £188,212 | -4% |
48 Properties |
| 2017 | £195,671 | 8% |
43 Properties |
| 2016 | £180,415 | -0,1% |
49 Properties |
| 2015 | £180,613 | 6% |
56 Properties |
| 2014 | £169,353 | -0,2% |
48 Properties |
| 2013 | £169,612 | 12% |
36 Properties |
| 2012 | £149,072 | -6% |
24 Properties |
| 2011 | £157,595 | 7% |
21 Properties |
| 2010 | £146,749 | -13% |
24 Properties |
| 2009 | £166,228 | 6% |
28 Properties |
| 2008 | £155,595 | -13% |
36 Properties |
| 2007 | £175,288 | 9% |
66 Properties |
| 2006 | £159,410 | 8% |
87 Properties |
| 2005 | £145,970 | -7% |
80 Properties |
| 2004 | £156,300 | 14% |
83 Properties |
| 2003 | £135,096 | 20% |
92 Properties |
| 2002 | £108,445 | 20% |
85 Properties |
| 2001 | £86,711 | 3% |
103 Properties |
| 2000 | £84,233 | 16% |
133 Properties |
| 1999 | £70,542 | 2% |
131 Properties |
| 1998 | £68,819 | 1% |
96 Properties |
| 1997 | £68,441 | 8% |
115 Properties |
| 1996 | £63,006 | 9% |
120 Properties |
| 1995 | £57,623 | - |
74 Properties |
Property Price per Property Type in Shawbirch
Here you can find historic sold price data in order to help with your property search.
The average Property Paid Price for specific property types in the last three years are:
| Property Type | Average Sold Price | Sold Properties |
|---|---|---|
| Semi Detached House | £196,657.00 | 35 Semi Detached Houses |
| Detached House | £321,013.00 | 73 Detached Houses |
| Terraced House | £179,744.00 | 31 Terraced Houses |

