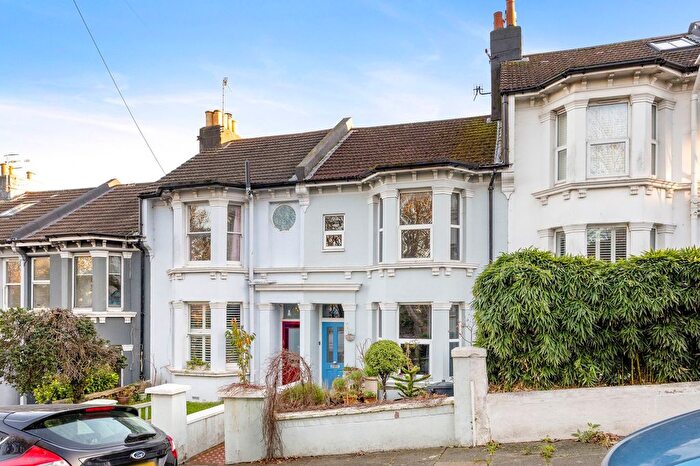
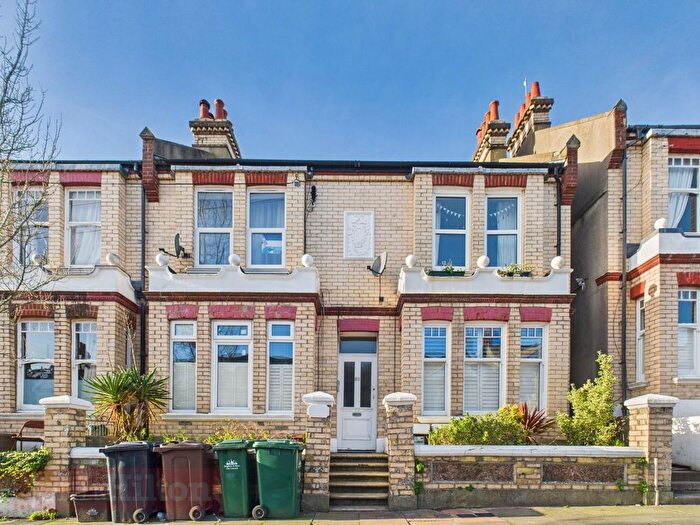
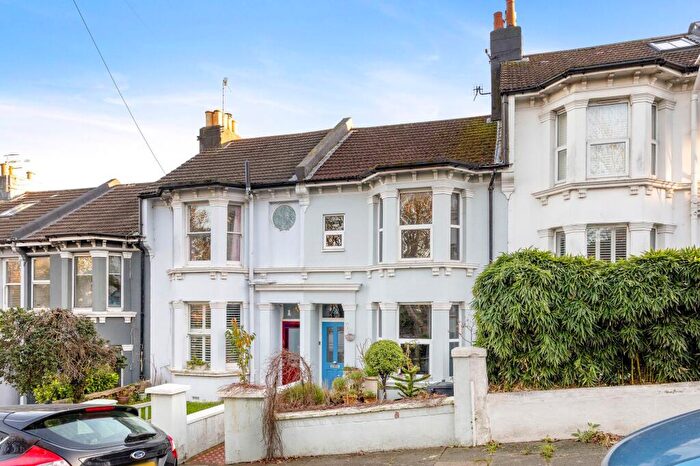
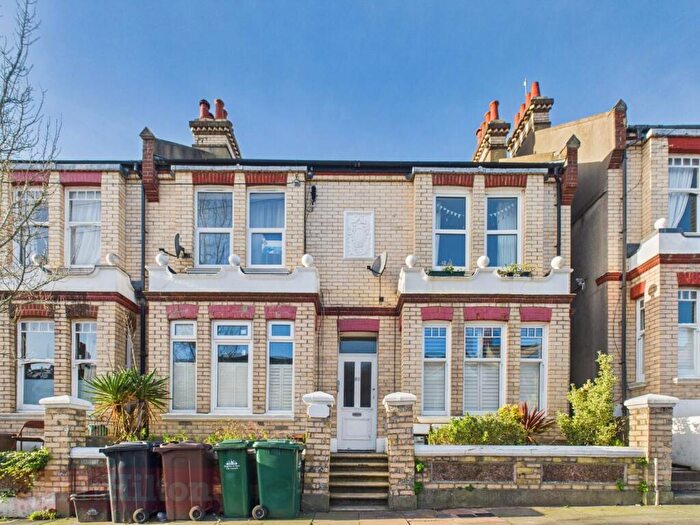
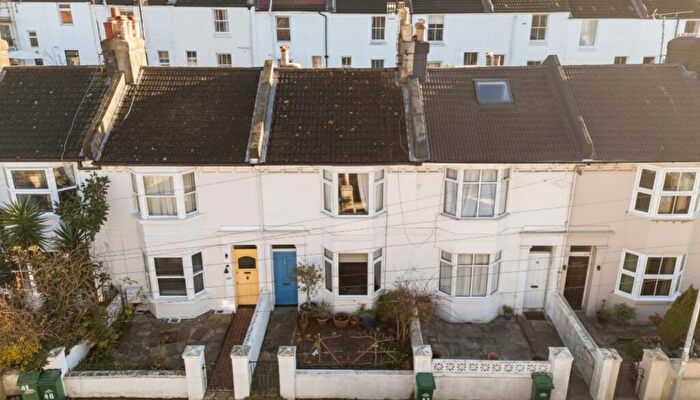
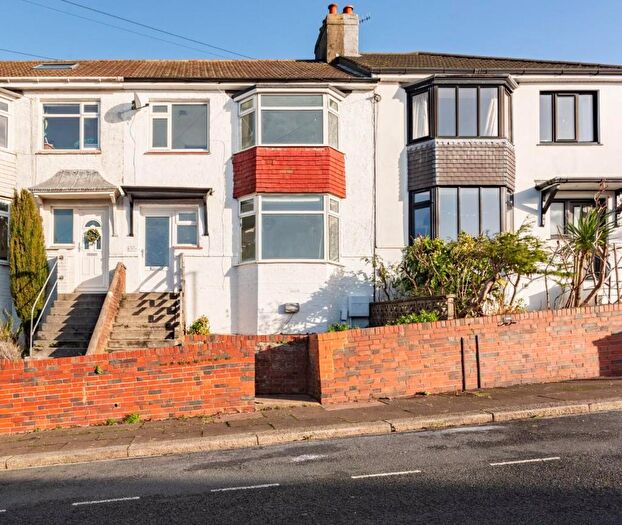
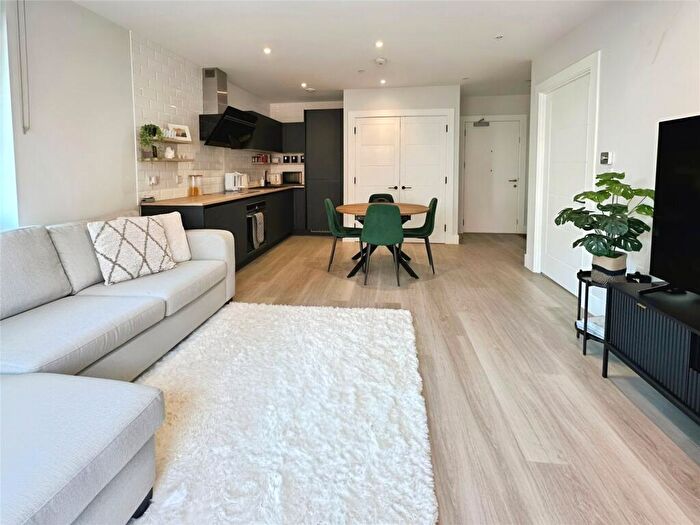
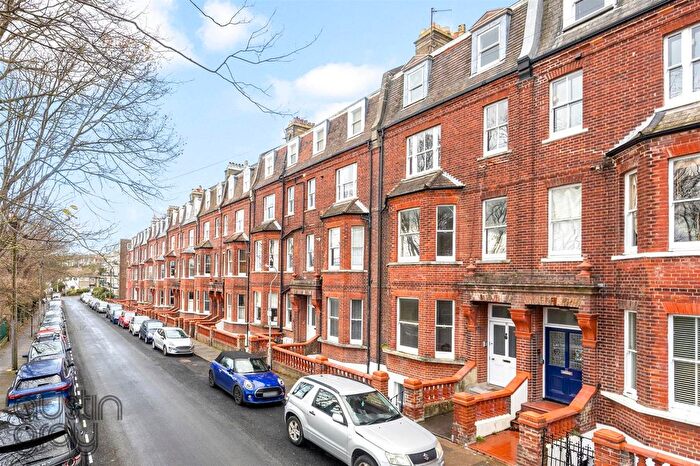
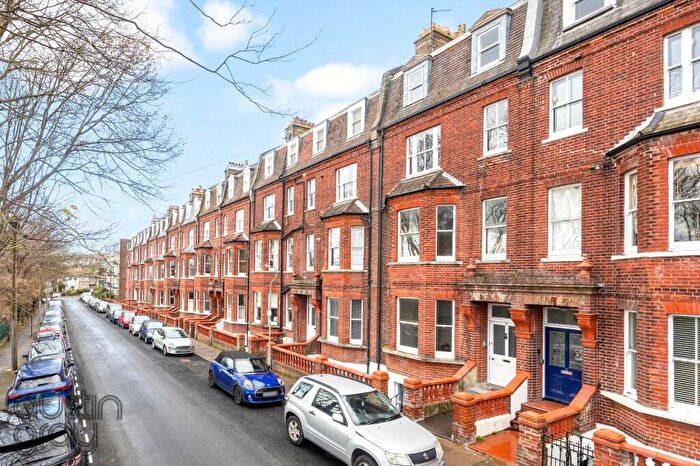
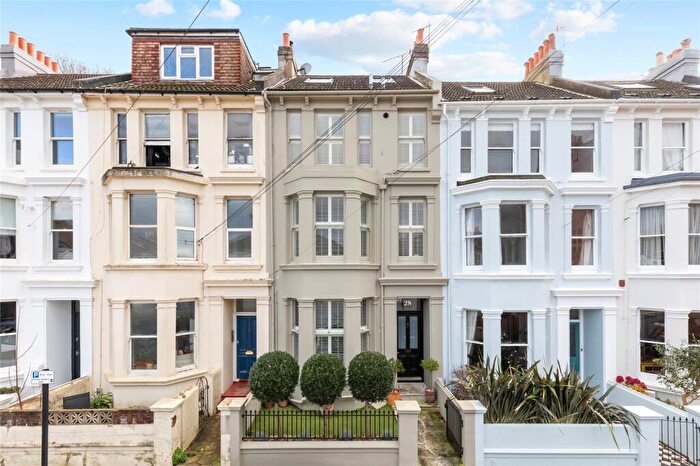
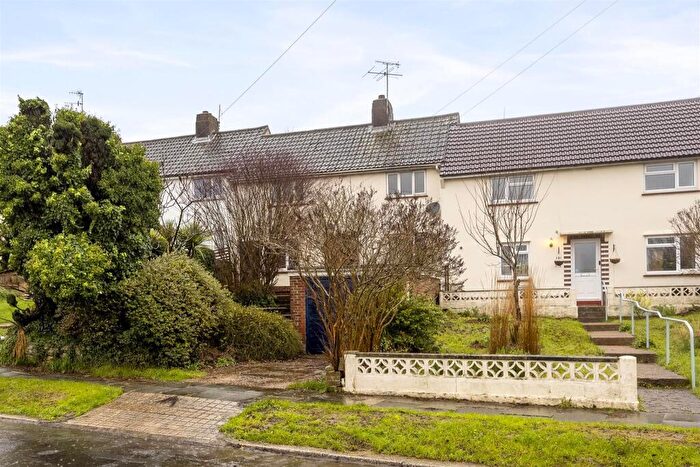
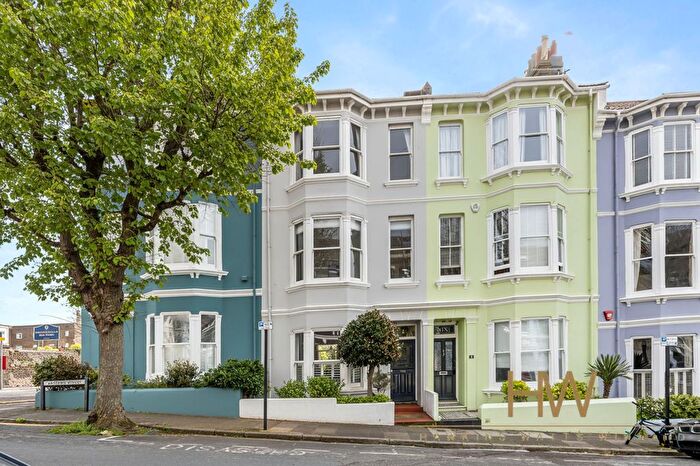
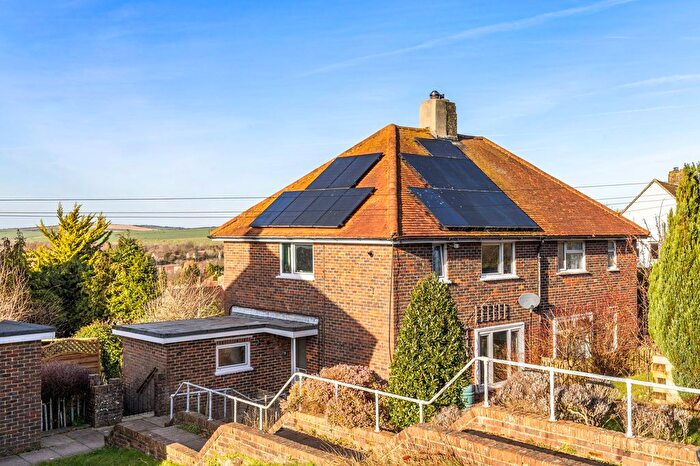
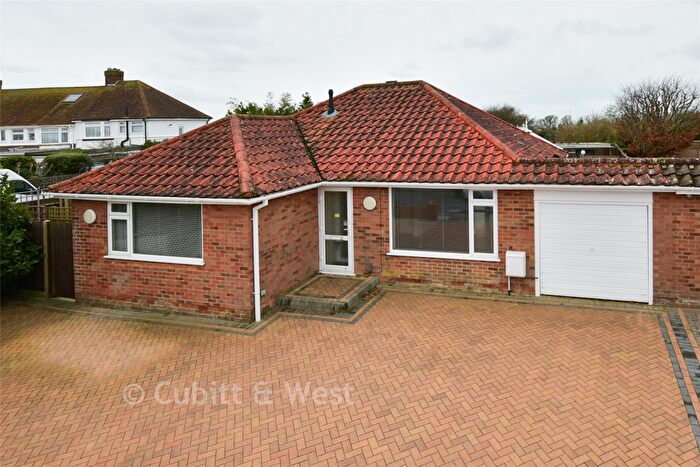
Houses for sale & to rent in Moulsecoomb And Bevendean, Brighton
House Prices in Moulsecoomb And Bevendean
Properties in Moulsecoomb And Bevendean have an average house price of £372,331.00 and had 530 Property Transactions within the last 3 years¹.
Moulsecoomb And Bevendean is an area in Brighton, The City of Brighton and Hove with 5,824 households², where the most expensive property was sold for £1,100,000.00.
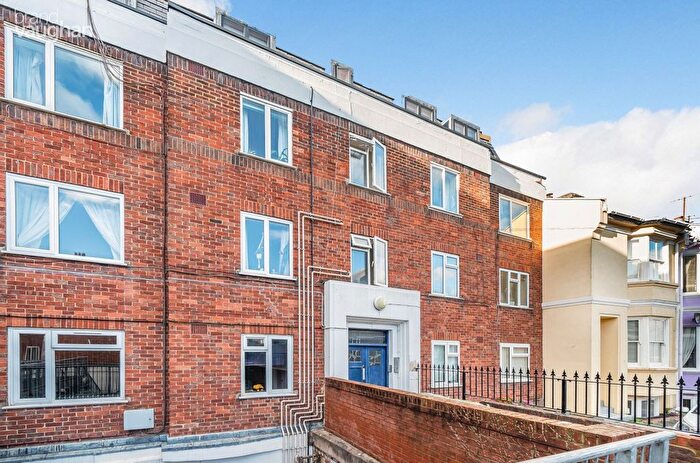
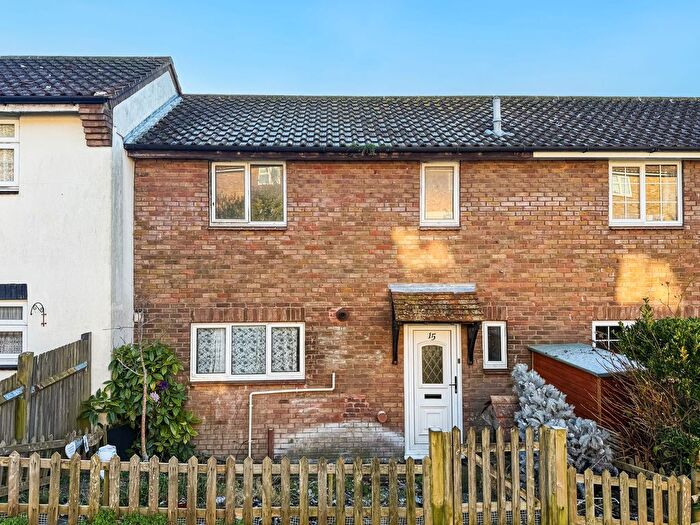
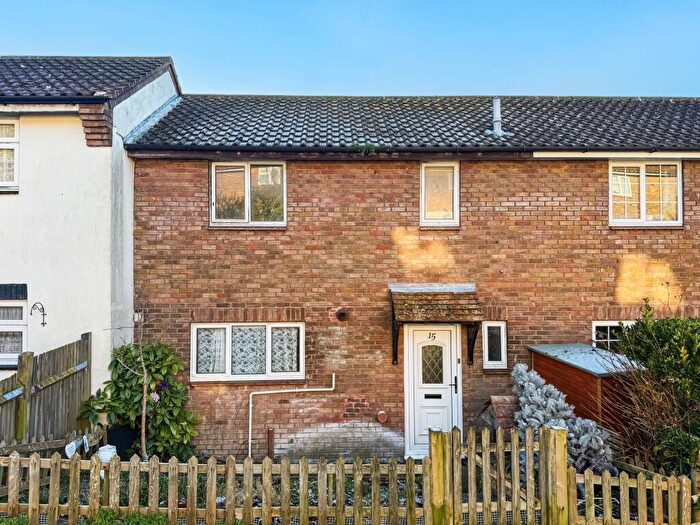
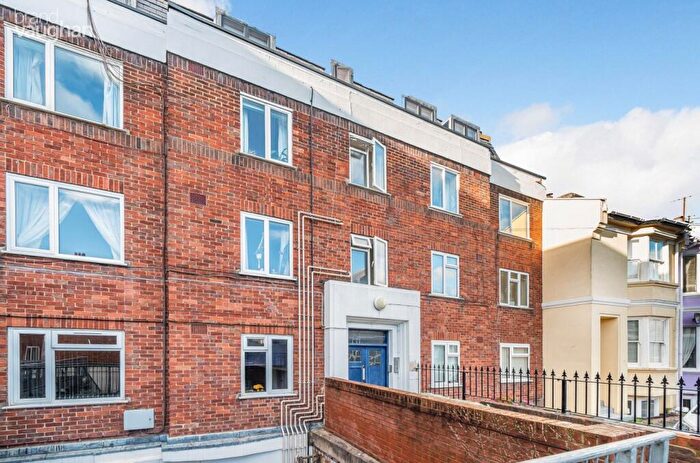
Properties for sale in Moulsecoomb And Bevendean
Roads and Postcodes in Moulsecoomb And Bevendean
Navigate through our locations to find the location of your next house in Moulsecoomb And Bevendean, Brighton for sale or to rent.
| Streets | Postcodes |
|---|---|
| Appledore Road | BN2 4PS BN2 4PT |
| Ashurst Road | BN2 4PH BN2 4PJ |
| Auckland Drive | BN2 4JD BN2 4JF BN2 4JG BN2 4JS |
| Baden Road | BN2 4DP |
| Bakery Mews | BN2 4NZ |
| Bamford Close | BN2 4LJ |
| Barcombe Road | BN1 9JP BN1 9JQ BN1 9JR |
| Bear Road | BN2 4DB BN2 4DD BN2 4DZ |
| Beechgrove | BN2 4TN |
| Belle Vue Cottages | BN2 6AA |
| Bevendean Crescent | BN2 4RA BN2 4RB BN2 4RD BN2 4RE |
| Bevendean Road | BN2 4DE BN2 4FN BN2 4DU |
| Birdham Place | BN2 4RZ |
| Birdham Road | BN2 4RF BN2 4RR BN2 4RX BN2 4RY |
| Birling Close | BN2 4DH |
| Bodiam Avenue | BN2 4LN BN2 4LQ |
| Bodiam Close | BN2 4LP |
| Bolney Road | BN2 4PP |
| Borrow King Close | BN2 4BW |
| Broadfields | BN2 4QF |
| Buller Road | BN2 4BH BN2 4BJ |
| Canfield Close | BN2 4DJ |
| Canfield Road | BN2 4DN |
| Carlyle Avenue | BN2 4DR |
| Chailey Road | BN1 9JE BN1 9JF |
| Colbourne Avenue | BN2 4GE |
| Coombe Road | BN2 4EA BN2 4EB BN2 4ED BN2 4EE BN2 4EQ BN2 4FL |
| Coombe Terrace | BN2 4AD |
| Crayford Road | BN2 4DQ |
| Dartmouth Close | BN2 4HZ |
| Dartmouth Crescent | BN2 4HY |
| Dawlish Close | BN2 4NB |
| Dennis Hobden Close | BN2 4BZ |
| Dewe Road | BN2 4BD BN2 4BE |
| Durham Close | BN2 4LY |
| Eastbourne Road | BN2 4DL |
| Eastergate Road | BN2 4QL |
| Egginton Close | BN2 4QH |
| Egginton Road | BN2 4PL |
| Ewhurst Road | BN2 4AJ BN2 4AL |
| Fairway Business Centre | BN2 4JZ |
| Fitch Drive | BN2 4HX |
| Fitzherbert Drive | BN2 4AZ BN2 4BT |
| Friston Close | BN2 4PU |
| Ghyllside | BN2 4NA |
| Goodwood Way | BN2 4PW |
| Halland Road | BN2 4PF BN2 4PG |
| Hawthorn Bank | BN2 4QA |
| Heath Hill Avenue | BN2 4FH BN2 4LS BN2 4JP |
| Highway Close | BN2 4FZ |
| Hillside | BN2 4TA BN2 4TE BN2 4TF |
| Hillside Way | BN2 4TR |
| Hodshrove Lane | BN2 4SB BN2 4SE |
| Hodshrove Place | BN2 4SA |
| Hodshrove Road | BN2 4RS BN2 4RT BN2 4RU BN2 4RW |
| Hogs Edge | BN2 4NQ |
| Hornby Place | BN2 4JT |
| Hornby Road | BN2 4JH BN2 4JL |
| Jevington Drive | BN2 4DG |
| Jubilee Court | BN2 4TS |
| Kenilworth Close | BN2 4LF |
| Kimberley Road | BN2 4EN BN2 4EP |
| Knepp Close | BN2 4LD |
| Ladysmith Road | BN2 4EF BN2 4EG BN2 4EH BN2 4EJ |
| Lewes Road | BN2 4AE BN2 4AT |
| Leybourne Close | BN2 4LU |
| Leybourne Parade | BN2 4LW |
| Leybourne Road | BN2 4LT |
| Lower Bevendean Avenue | BN2 4FE |
| Lucraft Road | BN2 4PN |
| Ludlow Rise | BN2 4JJ |
| Mafeking Road | BN2 4EL |
| Manton Road | BN2 4FB |
| Martha Gunn Road | BN2 4BX |
| Meadowview | BN2 4NE BN2 4NF |
| Medmerry Hill | BN2 4TP BN2 4TQ |
| Milner Road | BN2 4BP BN2 4BQ BN2 4BR BN2 4BS |
| Moulsecoomb Way | BN2 4PD BN2 4PE BN2 4PZ BN2 4NP BN2 4PB BN2 4QJ |
| Natal Road | BN2 4BN |
| Nesbitt Road | BN2 4BL |
| Newick Road | BN1 9JG BN1 9JH BN1 9JJ BN1 9JL BN1 9JY |
| Norwich Close | BN2 4LH |
| Norwich Crescent | BN2 4LX |
| Norwich Drive | BN2 4LA BN2 4LB BN2 4LE BN2 4LG BN2 4LL |
| Nyetimber Hill | BN2 4TL |
| Pelham Terrace | BN2 4AF |
| Plymouth Avenue | BN2 4JA BN2 4JB |
| Race Hill | BN2 6AB |
| Railway Cottages | BN2 4PX |
| Redvers Road | BN2 4BF BN2 4BG |
| Riley Road | BN2 4AG BN2 4AH |
| Ringmer Close | BN1 9HY |
| Ringmer Drive | BN1 9HW BN1 9HX |
| Ringmer Road | BN1 9JA |
| Robin Davis Close | BN2 4BU |
| Selba Drive | BN2 4RG |
| Shortgate Road | BN2 4PR |
| Southall Avenue | BN2 4BA BN2 4BB |
| Staplefield Drive | BN2 4RH BN2 4RJ BN2 4RL BN2 4RN BN2 4RP |
| Station Approach | BN1 9SD |
| Stonecross Road | BN2 4PQ |
| Sullington Close | BN2 4PY |
| Taunton Grove | BN2 4JQ |
| Taunton Place | BN2 4JR |
| Taunton Road | BN2 4JN |
| Tenantry Road | BN2 4BY |
| The Avenue | BN2 4FA BN2 4FD BN2 4GF BN2 4GG |
| The Crescent | BN2 4TB BN2 4TD |
| The Highway | BN2 4GB BN2 4GD BN2 4PA |
| The Hyde | BN2 4JE BN2 4JU |
| Torcross Close | BN2 4ND |
| Upper Bevendean Avenue | BN2 4FF BN2 4FG |
| Walmer Close | BN2 4LZ |
| Walmer Crescent | BN2 4LR |
| Westergate Road | BN2 4QN |
| Wheatfield Way | BN2 4RQ |
| Widdicombe Way | BN2 4TG BN2 4TH BN2 4TJ |
| Willingdon Road | BN2 4DF |
Transport near Moulsecoomb And Bevendean
-
Moulsecoomb Station
-
London Road Brighton Station
-
Falmer Station
-
Brighton Station
-
Preston Park Station
-
Hove Station
- FAQ
- Price Paid By Year
- Property Type Price
Frequently asked questions about Moulsecoomb And Bevendean
What is the average price for a property for sale in Moulsecoomb And Bevendean?
The average price for a property for sale in Moulsecoomb And Bevendean is £372,331. This amount is 20% lower than the average price in Brighton. There are 5,577 property listings for sale in Moulsecoomb And Bevendean.
What streets have the most expensive properties for sale in Moulsecoomb And Bevendean?
The streets with the most expensive properties for sale in Moulsecoomb And Bevendean are Halland Road at an average of £715,500, Bevendean Road at an average of £497,916 and Eastbourne Road at an average of £483,857.
What streets have the most affordable properties for sale in Moulsecoomb And Bevendean?
The streets with the most affordable properties for sale in Moulsecoomb And Bevendean are Hillside Way at an average of £221,500, Bolney Road at an average of £252,500 and Shortgate Road at an average of £275,000.
Which train stations are available in or near Moulsecoomb And Bevendean?
Some of the train stations available in or near Moulsecoomb And Bevendean are Moulsecoomb, London Road Brighton and Falmer.
Property Price Paid in Moulsecoomb And Bevendean by Year
The average sold property price by year was:
| Year | Average Sold Price | Price Change |
Sold Properties
|
|---|---|---|---|
| 2025 | £384,992 | 6% |
79 Properties |
| 2024 | £363,734 | 1% |
161 Properties |
| 2023 | £361,384 | -5% |
108 Properties |
| 2022 | £380,936 | 8% |
182 Properties |
| 2021 | £348,894 | 9% |
188 Properties |
| 2020 | £318,457 | -3% |
125 Properties |
| 2019 | £329,361 | 4% |
150 Properties |
| 2018 | £316,503 | 4% |
168 Properties |
| 2017 | £303,413 | 6% |
144 Properties |
| 2016 | £285,325 | 6% |
230 Properties |
| 2015 | £268,853 | 11% |
206 Properties |
| 2014 | £240,313 | 11% |
200 Properties |
| 2013 | £214,250 | -0,1% |
147 Properties |
| 2012 | £214,554 | 5% |
151 Properties |
| 2011 | £203,370 | -1% |
144 Properties |
| 2010 | £205,588 | 15% |
150 Properties |
| 2009 | £173,986 | -13% |
120 Properties |
| 2008 | £195,837 | -5% |
126 Properties |
| 2007 | £206,515 | 12% |
309 Properties |
| 2006 | £181,806 | 3% |
269 Properties |
| 2005 | £175,934 | 6% |
223 Properties |
| 2004 | £166,103 | 11% |
282 Properties |
| 2003 | £148,270 | 16% |
254 Properties |
| 2002 | £125,068 | 19% |
279 Properties |
| 2001 | £101,895 | 15% |
299 Properties |
| 2000 | £86,999 | 24% |
238 Properties |
| 1999 | £66,494 | 12% |
278 Properties |
| 1998 | £58,506 | 10% |
211 Properties |
| 1997 | £52,933 | 12% |
223 Properties |
| 1996 | £46,482 | 5% |
193 Properties |
| 1995 | £44,123 | - |
161 Properties |
Property Price per Property Type in Moulsecoomb And Bevendean
Here you can find historic sold price data in order to help with your property search.
The average Property Paid Price for specific property types in the last three years are:
| Property Type | Average Sold Price | Sold Properties |
|---|---|---|
| Flat | £263,940.00 | 89 Flats |
| Semi Detached House | £387,522.00 | 199 Semi Detached Houses |
| Detached House | £491,375.00 | 8 Detached Houses |
| Terraced House | £396,568.00 | 234 Terraced Houses |

