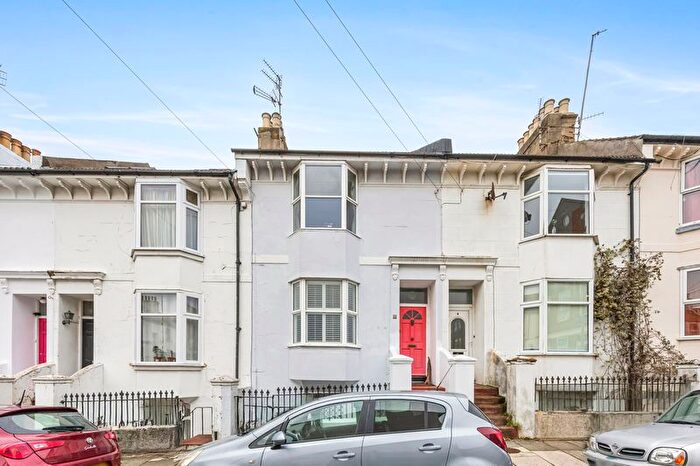
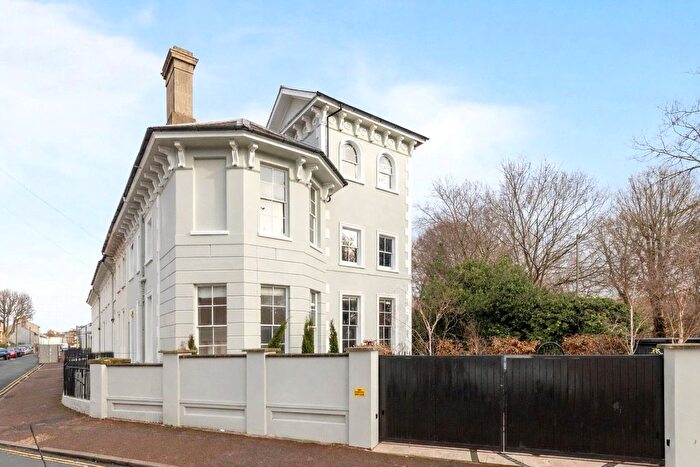
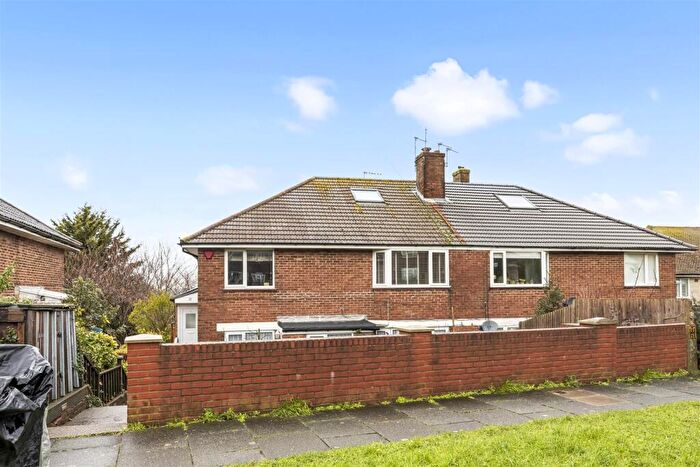
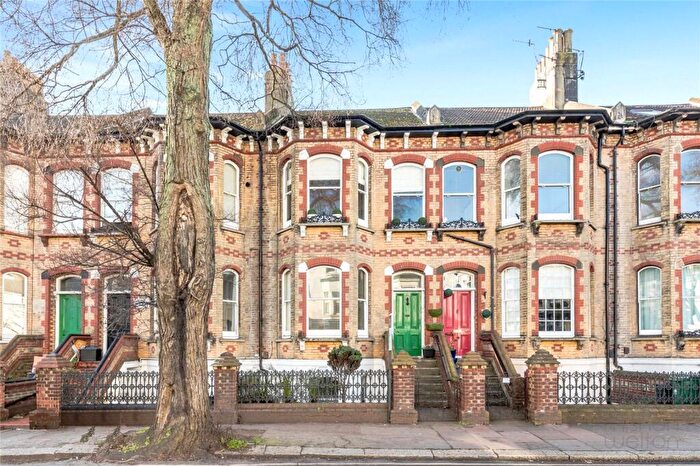
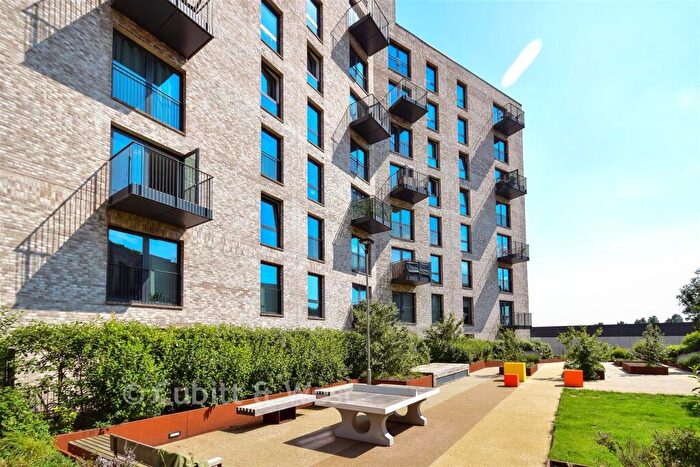
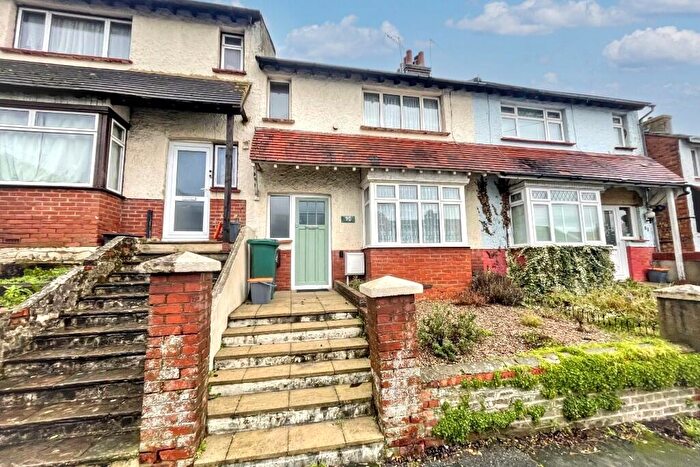
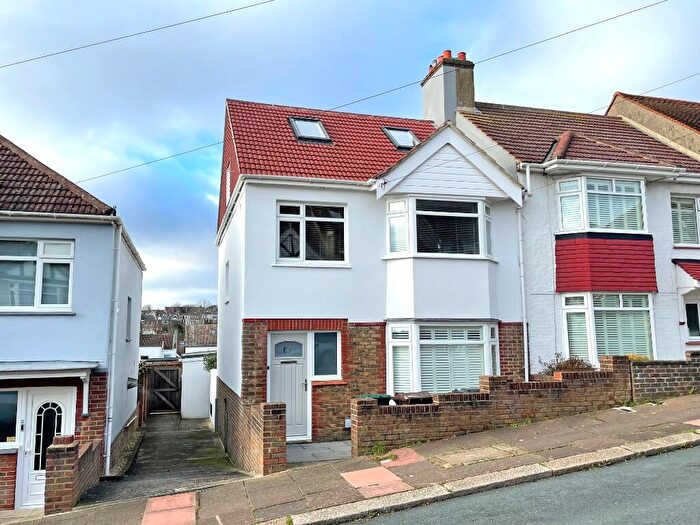
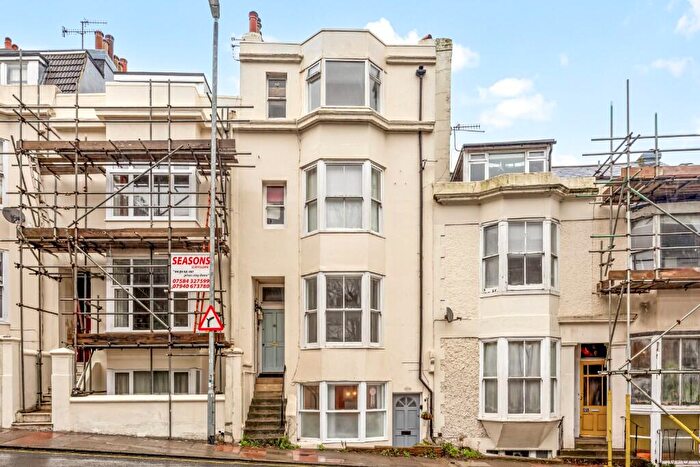
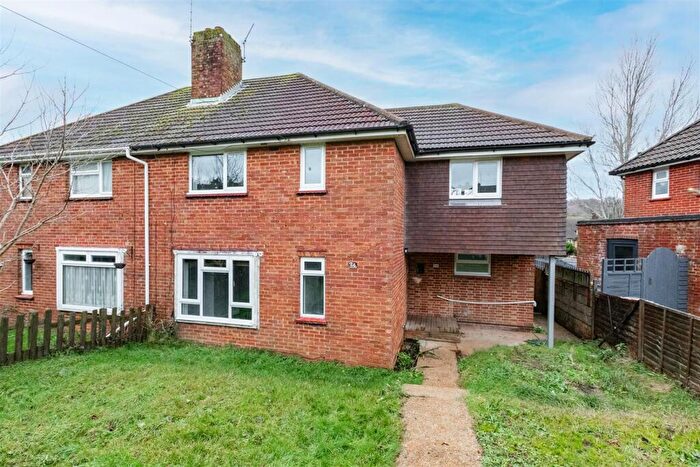
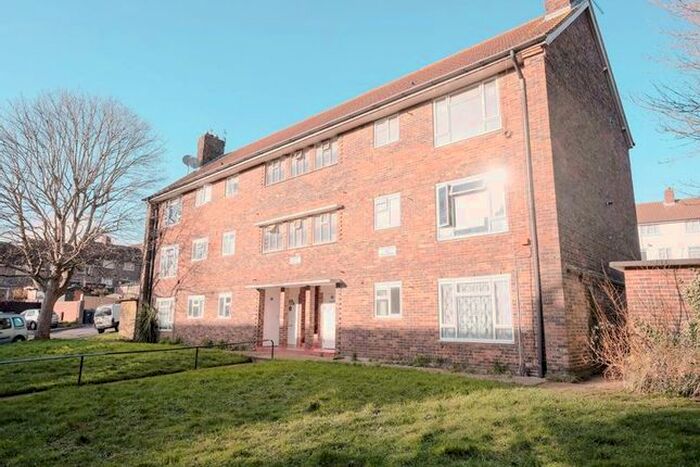
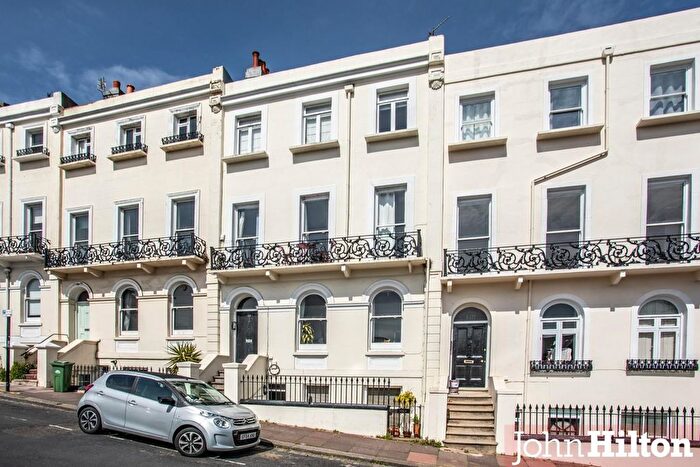
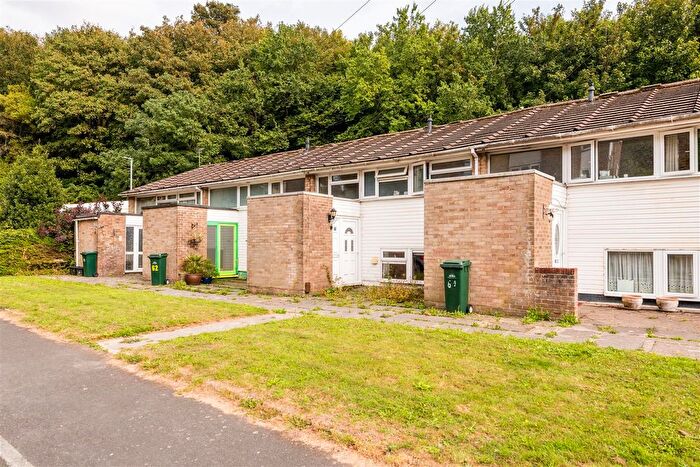
Houses for sale & to rent in Hollingdean And Stanmer, Brighton
House Prices in Hollingdean And Stanmer
Properties in Hollingdean And Stanmer have an average house price of £456,225.00 and had 396 Property Transactions within the last 3 years¹.
Hollingdean And Stanmer is an area in Brighton, The City of Brighton and Hove with 5,207 households², where the most expensive property was sold for £1,287,500.00.
Properties for sale in Hollingdean And Stanmer
Roads and Postcodes in Hollingdean And Stanmer
Navigate through our locations to find the location of your next house in Hollingdean And Stanmer, Brighton for sale or to rent.
| Streets | Postcodes |
|---|---|
| Adams Close | BN1 7HU |
| Arlington Crescent | BN1 9AP |
| Ashburnham Close | BN1 9AU |
| Ashburnham Drive | BN1 9AX |
| Barnett Road | BN1 7GH BN1 7GJ |
| Barrow Close | BN1 7FL |
| Barrow Hill | BN1 7FF |
| Beal Crescent | BN1 7BU |
| Beatty Avenue | BN1 9ED BN1 9EE BN1 9EP |
| Brentwood Close | BN1 7EW |
| Brentwood Crescent | BN1 7EU |
| Brentwood Road | BN1 7EQ BN1 7ES BN1 7ET BN1 7DW BN1 7DY BN1 7DZ BN1 7HR |
| Burstead Close | BN1 7HT BN1 7HW BN1 7AD |
| Coldean Lane | BN1 9GD BN1 9GE |
| Crespin Way | BN1 7FG |
| Crestway Parade | BN1 7BL |
| Culpepper Close | BN2 4HQ |
| Davey Drive | BN1 7BE BN1 7BF BN1 7BJ |
| Ditchling Gardens | BN1 6JX |
| Ditchling Place | BN1 6NW |
| Ditchling Road | BN1 6JA BN1 6JE BN1 6JF BN1 6JG BN1 6JL BN1 7AA BN1 7HS |
| Dudley Road | BN1 7GL BN1 7GN |
| Dunster Close | BN1 7ED |
| Florence Place | BN1 7GU |
| Forest Road | BN1 9GP |
| Fountains Close | BN1 7BR |
| Freehold Terrace | BN2 4AB BN2 4AQ |
| Golf Drive | BN1 7HZ BN1 7LB |
| Haig Avenue | BN1 9EQ |
| Harrington Place | BN1 7HL |
| Hawkhurst Road | BN1 9EA BN1 9EB BN1 9GF |
| Hertford Road | BN1 7GF BN1 7GG |
| Highbrook Close | BN2 4HL |
| Highfields | BN1 9AR |
| Hinton Close | BN1 7BS |
| Hollingbury Crescent | BN1 7HD |
| Hollingbury Park Avenue | BN1 7JF BN1 7JG BN1 7JP BN1 7JQ |
| Hollingbury Place | BN1 7GE |
| Hollingbury Rise | BN1 7HH BN1 7HJ |
| Hollingbury Rise West | BN1 7JR |
| Hollingbury Road | BN1 7JA BN1 7JB BN1 7JD BN1 7JN |
| Hollingbury Terrace | BN1 7JE |
| Hollingdean Lane | BN1 7BB |
| Hollingdean Road | BN2 4AA BN2 4NH |
| Hollingdean Terrace | BN1 7HA BN1 7HB BN1 7HE BN1 7HF |
| Horton Road | BN1 7EA BN1 7EG BN1 7EH |
| Ingham Drive | BN1 9GL |
| Isfield Road | BN1 7FE |
| Kenwards | BN1 9EN |
| Laburnum Grove | BN1 7HX |
| Lambourne Close | BN1 7FJ |
| Lambourne Road | BN1 7FD |
| Lewes Road | BN2 4GJ BN2 4GL BN2 4GN |
| Link Place | BN1 7DU BN1 7DX |
| Liphook Close | BN1 7AZ |
| Lynchet Close | BN1 7FP BN1 7EY |
| Lynchet Down | BN1 7FR |
| Lynchet Walk | BN1 7FQ |
| Major Close | BN1 7EE |
| May Cottages | BN2 4AP |
| Melrose Close | BN1 7BP |
| Merevale | BN1 7EP |
| Middleton Rise | BN1 9AN |
| Monk Close | BN1 9AH |
| Moulsecoomb Place | BN2 4GA |
| Mountfields | BN1 7BT |
| Nanson Road | BN1 9GJ |
| Oldbury Row | BN1 7GY |
| Park Close | BN1 9AJ |
| Park Road | BN1 9AA BN1 9AB |
| Payne Terrace | BN1 7GP |
| Peace Close | BN1 7AX |
| Popes Folly | BN2 4AN |
| Quarry Bank Road | BN1 7HG |
| Queensdown Road | BN1 7LA |
| Queensdown School Road | BN2 4GP |
| Reeves Hill | BN1 9AS |
| Ridge View | BN1 9AL |
| Roedale Road | BN1 7GB BN1 7GD BN1 7GX |
| Romsey Close | BN1 7BQ |
| Roundway | BN1 9AQ |
| Rushlake Close | BN1 9AY |
| Rushlake Road | BN1 9AD BN1 9AE BN1 9AF BN1 9AG |
| Ryelands Drive | BN2 4HB BN2 4HD |
| Salehurst Close | BN1 7AE |
| Saunders Hill | BN1 9ES |
| Saunders Park Rise | BN2 4ES BN2 4ET BN2 4EU |
| Saunders Park View | BN2 4AY BN2 4EW BN2 4EX BN2 4EY |
| Selham Close | BN1 9EH |
| Selham Drive | BN1 9EL |
| Selham Place | BN1 9EW |
| Selsfield Drive | BN2 4HA BN2 4HH BN2 4HJ |
| Shenfield Way | BN1 7EX |
| Southmount | BN1 7BD |
| Standean Close | BN1 9EU |
| Stanmer Park Road | BN1 7JH BN1 7JJ BN1 7JL BN1 7JS BN1 7JT |
| Stanmer Village | BN1 9PZ |
| Stanmer Villas | BN1 7HN BN1 7HP BN1 7HQ |
| Stephens Road | BN1 7EN BN1 7ER |
| Talbot Crescent | BN1 9GG |
| Tavistock Down | BN1 7FH BN1 7FN |
| The Byway | BN1 9AW |
| The Crestway | BN1 7BN BN1 7BX BN1 7AY |
| The Crossway | BN1 7EL BN1 7BW |
| The Linkway | BN1 7EJ |
| The Meads | BN1 9BA |
| Thompson Road | BN1 7BH |
| Thorndean Road | BN2 4HE BN2 4HF |
| Tillstone Close | BN2 4HP |
| Tintern Close | BN1 7EF |
| Twyford Road | BN1 9GN |
| Uplands Road | BN1 7FA |
| Upper Hollingdean Road | BN1 7GA BN1 7GR BN1 7GS BN1 7GT BN1 7GW |
| Waldron Avenue | BN1 9EF |
| Waldron Place | BN1 9EY |
| Walton Bank | BN1 9AT |
| Waverley Crescent | BN1 7BG |
| Wigmore Close | BN1 7EB |
| Wild Park Close | BN2 4HG BN2 4HN |
| Woburn Place | BN1 9GA |
| Wolseley Road | BN1 9ET |
| Wolverstone Drive | BN1 7FB |
| Woodview Close | BN1 9GH |
Transport near Hollingdean And Stanmer
-
Moulsecoomb Station
-
London Road Brighton Station
-
Preston Park Station
-
Brighton Station
-
Falmer Station
-
Hove Station
-
Aldrington Station
- FAQ
- Price Paid By Year
- Property Type Price
Frequently asked questions about Hollingdean And Stanmer
What is the average price for a property for sale in Hollingdean And Stanmer?
The average price for a property for sale in Hollingdean And Stanmer is £456,225. This amount is 2% lower than the average price in Brighton. There are 8,890 property listings for sale in Hollingdean And Stanmer.
What streets have the most expensive properties for sale in Hollingdean And Stanmer?
The streets with the most expensive properties for sale in Hollingdean And Stanmer are Hollingbury Park Avenue at an average of £710,655, Ditchling Road at an average of £578,968 and Hollingbury Road at an average of £541,860.
What streets have the most affordable properties for sale in Hollingdean And Stanmer?
The streets with the most affordable properties for sale in Hollingdean And Stanmer are Woburn Place at an average of £173,750, Beal Crescent at an average of £218,750 and Thorndean Road at an average of £248,250.
Which train stations are available in or near Hollingdean And Stanmer?
Some of the train stations available in or near Hollingdean And Stanmer are Moulsecoomb, London Road Brighton and Preston Park.
Property Price Paid in Hollingdean And Stanmer by Year
The average sold property price by year was:
| Year | Average Sold Price | Price Change |
Sold Properties
|
|---|---|---|---|
| 2025 | £481,491 | 10% |
84 Properties |
| 2024 | £432,048 | -4% |
112 Properties |
| 2023 | £448,730 | -4% |
89 Properties |
| 2022 | £467,510 | 14% |
111 Properties |
| 2021 | £404,086 | 9% |
205 Properties |
| 2020 | £368,434 | 1% |
127 Properties |
| 2019 | £366,325 | 1% |
130 Properties |
| 2018 | £362,452 | 4% |
125 Properties |
| 2017 | £347,270 | 6% |
133 Properties |
| 2016 | £327,226 | 11% |
158 Properties |
| 2015 | £290,386 | 5% |
165 Properties |
| 2014 | £276,036 | 8% |
144 Properties |
| 2013 | £254,357 | 2% |
152 Properties |
| 2012 | £248,009 | 3% |
120 Properties |
| 2011 | £240,579 | 3% |
132 Properties |
| 2010 | £233,559 | 16% |
124 Properties |
| 2009 | £196,432 | -10% |
137 Properties |
| 2008 | £215,610 | -7% |
118 Properties |
| 2007 | £231,219 | 14% |
209 Properties |
| 2006 | £199,954 | 8% |
218 Properties |
| 2005 | £184,719 | 2% |
185 Properties |
| 2004 | £180,228 | 7% |
213 Properties |
| 2003 | £167,582 | 17% |
194 Properties |
| 2002 | £138,304 | 14% |
221 Properties |
| 2001 | £118,550 | 15% |
243 Properties |
| 2000 | £101,180 | 21% |
183 Properties |
| 1999 | £79,981 | 13% |
232 Properties |
| 1998 | £69,601 | 12% |
212 Properties |
| 1997 | £61,453 | 14% |
186 Properties |
| 1996 | £52,647 | 0,2% |
181 Properties |
| 1995 | £52,561 | - |
136 Properties |
Property Price per Property Type in Hollingdean And Stanmer
Here you can find historic sold price data in order to help with your property search.
The average Property Paid Price for specific property types in the last three years are:
| Property Type | Average Sold Price | Sold Properties |
|---|---|---|
| Flat | £270,414.00 | 57 Flats |
| Semi Detached House | £473,735.00 | 106 Semi Detached Houses |
| Detached House | £536,893.00 | 16 Detached Houses |
| Terraced House | £490,532.00 | 217 Terraced Houses |

