
Houses for sale & to rent in BN3 6QP, Shirley Drive, Hove Park, Hove
House Prices in BN3 6QP, Shirley Drive, Hove Park
Properties in BN3 6QP have no sales history available within the last 3 years. BN3 6QP is a postcode in Shirley Drive located in Hove Park, an area in Hove, The City of Brighton and Hove, with 5 households².
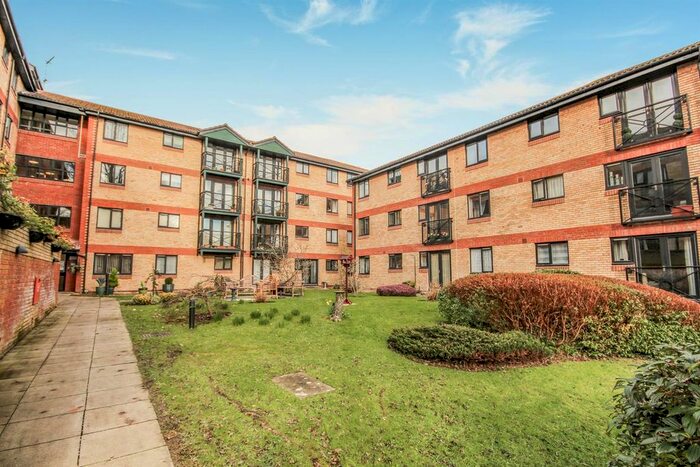
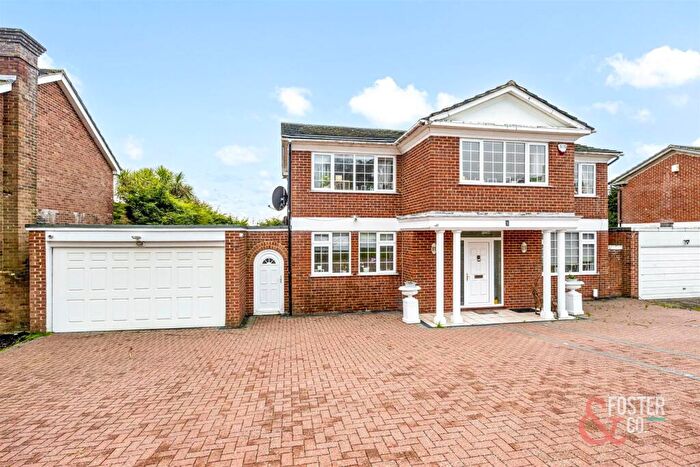
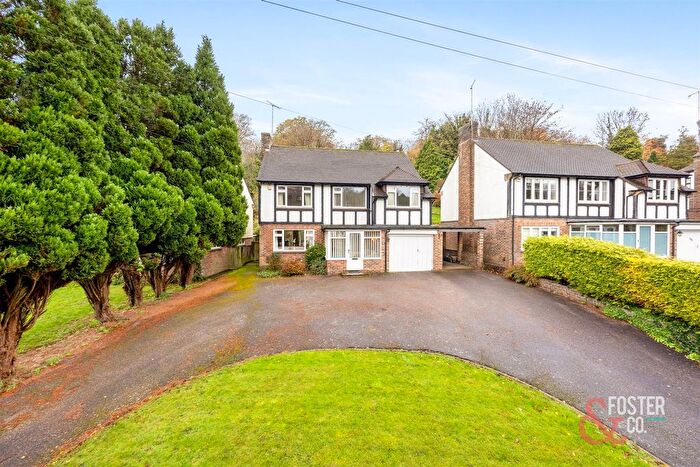
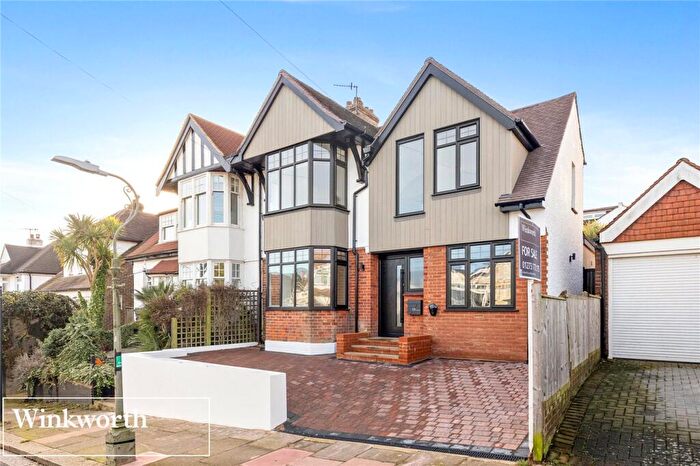
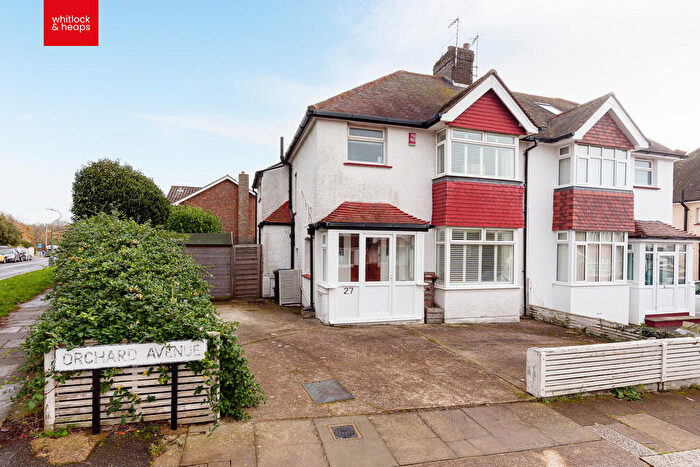
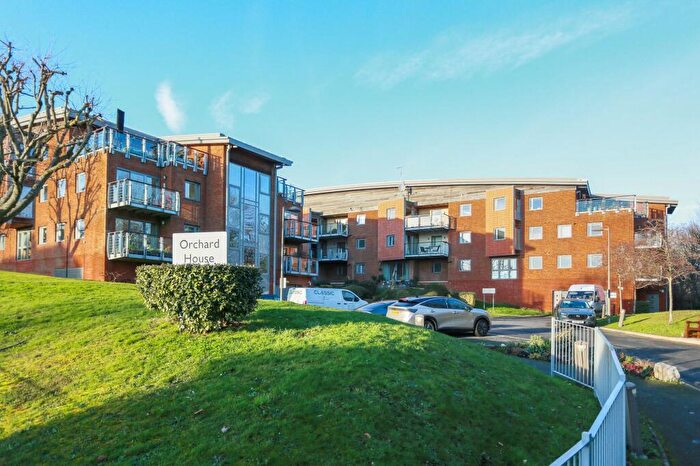
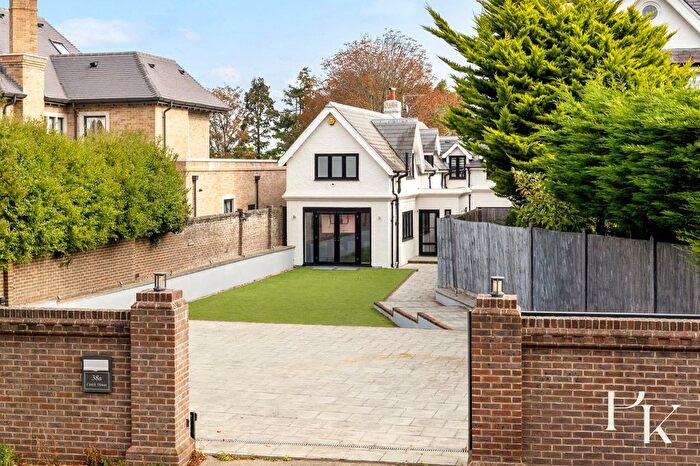
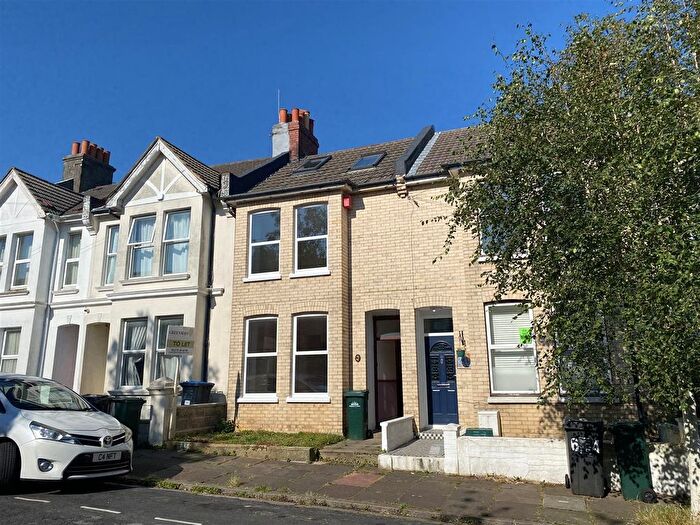
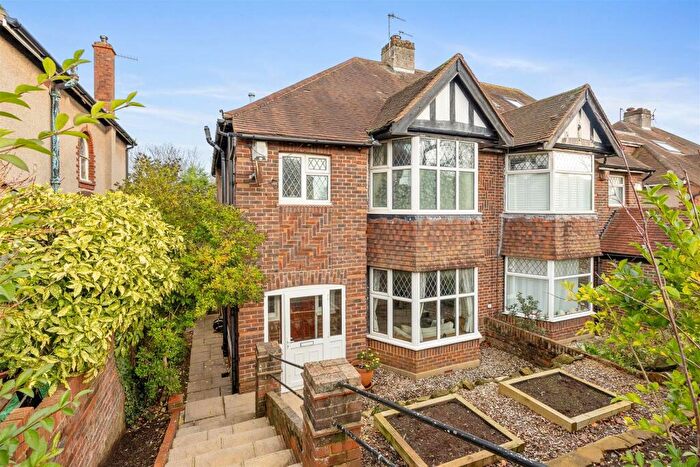
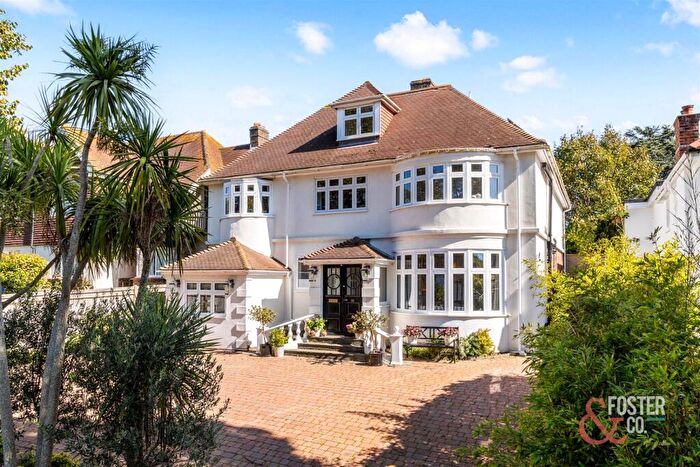
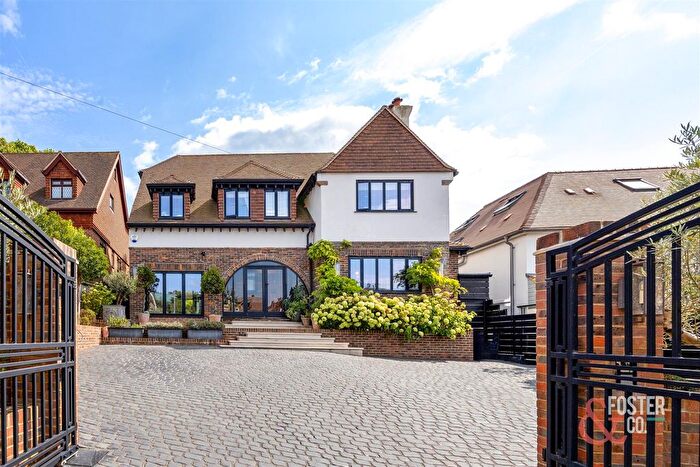
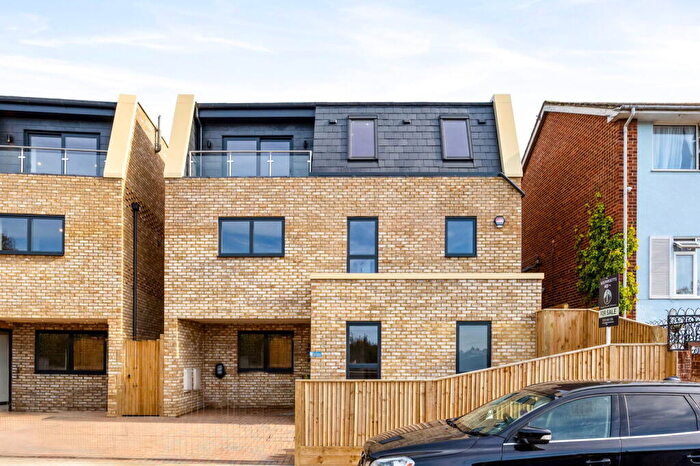
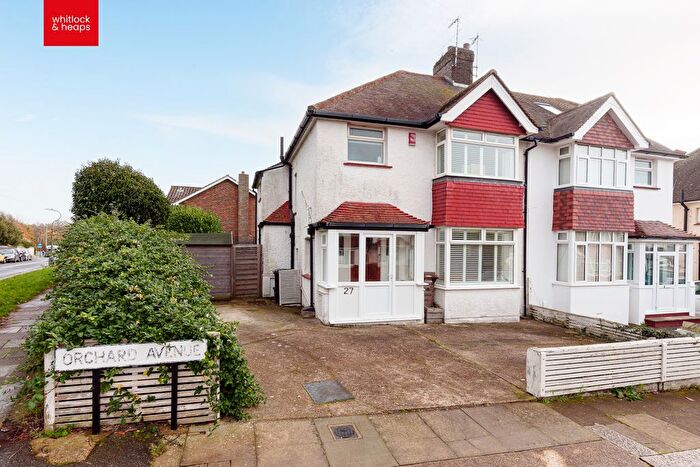
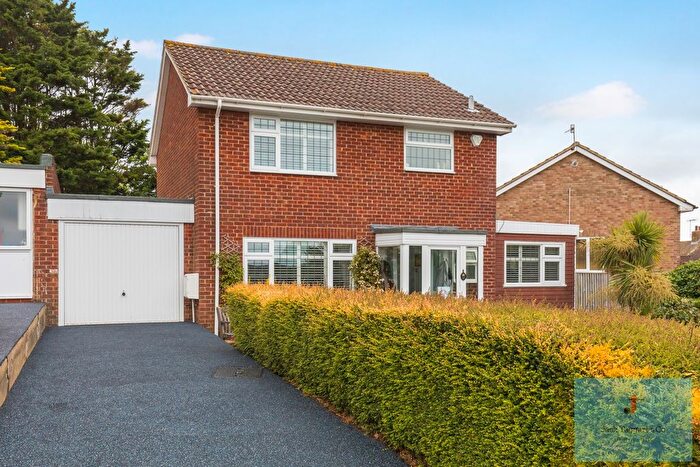
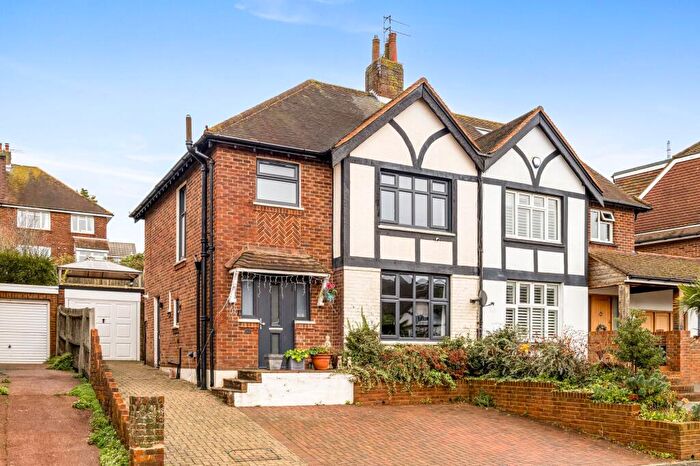
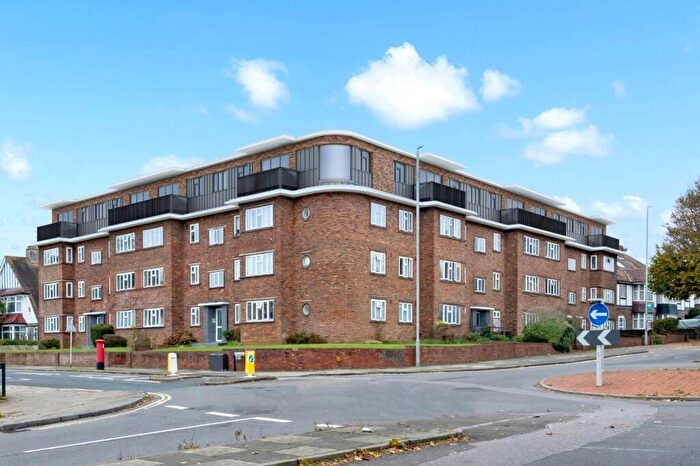
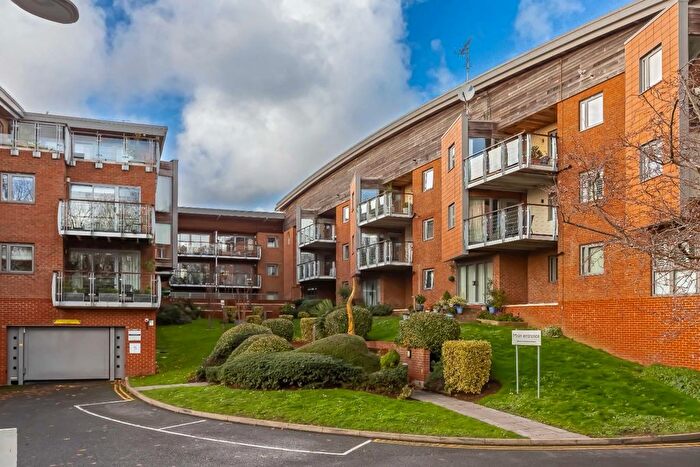
Properties for sale near BN3 6QP, Shirley Drive


![]()
If you are looking to sell your house, let it out, or receive a property valuation, an expert can help you.
Click the button below to get started.
Price Paid in Shirley Drive, BN3 6QP, Hove Park
161 Shirley Drive, BN3 6QP, Hove Park Hove
Property 161 has been sold 1 time. The last time it was sold was in 25/06/2021 and the sold price was £1,025,000.00.
This detached house, sold as a freehold on 25/06/2021, is a 166 sqm detached bungalow with an EPC rating of E.
| Date | Price | Property Type | Tenure | Classification |
|---|---|---|---|---|
| 25/06/2021 | £1,025,000.00 | Detached House | freehold | Established Building |
159 Shirley Drive, BN3 6QP, Hove Park Hove
Property 159 has been sold 3 times. The last time it was sold was in 22/03/2016 and the sold price was £1,050,000.00.
This detached house, sold as a freehold on 22/03/2016, is a 206 sqm detached house with an EPC rating of E.
| Date | Price | Property Type | Tenure | Classification |
|---|---|---|---|---|
| 22/03/2016 | £1,050,000.00 | Detached House | freehold | Established Building |
| 19/05/2000 | £420,000.00 | Detached House | freehold | Established Building |
| 15/03/1996 | £200,000.00 | Detached House | freehold | Established Building |
Postcodes in Shirley Drive, Hove Park
Navigate through other locations in Shirley Drive, Hove Park, Hove to see more property listings for sale or to rent.
Transport near BN3 6QP, Shirley Drive
-
 Preston Park Station
 -
Hove Station
-
Aldrington Station
-
Portslade Station
-
London Road Brighton Station
-
Brighton Station
-
Fishersgate Station
-
Moulsecoomb Station
House price paid reports for BN3 6QP, Shirley Drive
Click on the buttons below to see price paid reports by year or property price:
- Price Paid By Year
Property Price Paid in BN3 6QP, Shirley Drive by Year
The average sold property price by year was:
| Year | Average Sold Price | Price Change |
Sold Properties
|
|---|---|---|---|
| 2021 | £1,025,000 | -2% |
1 Property |
| 2016 | £1,050,000 | 60% |
1 Property |
| 2000 | £420,000 | 52% |
1 Property |
| 1996 | £200,000 | - |
1 Property |