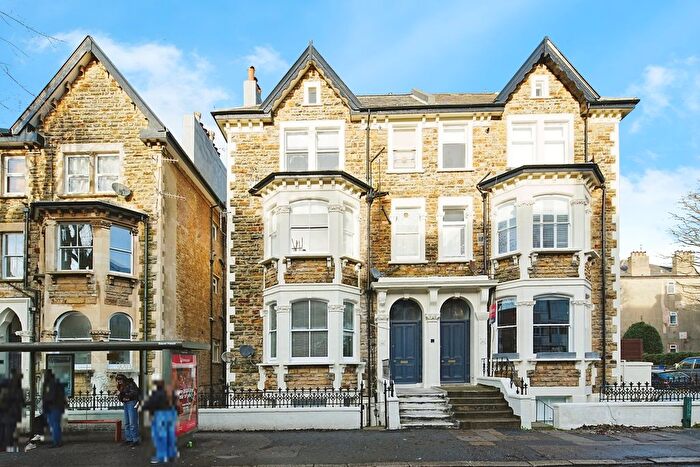
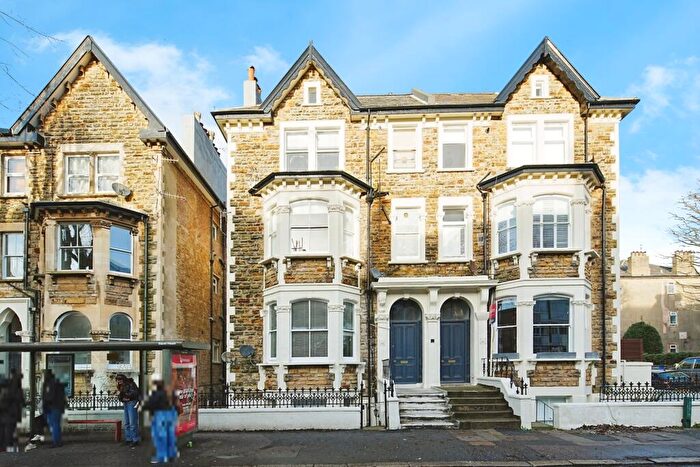
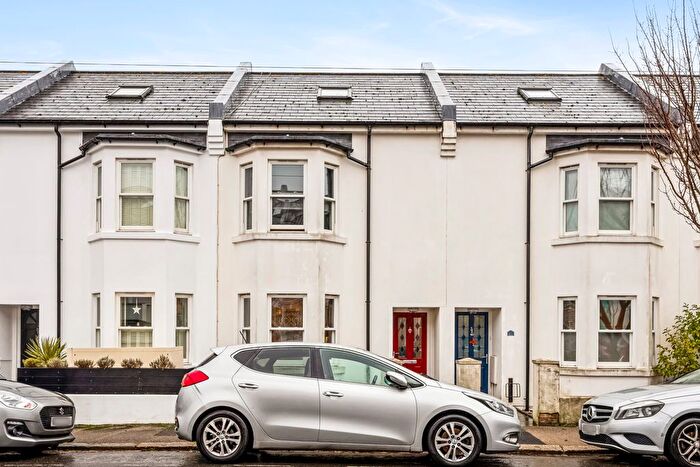
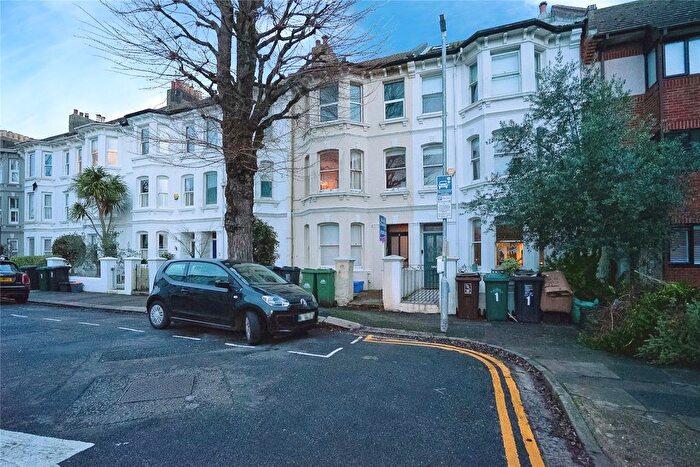
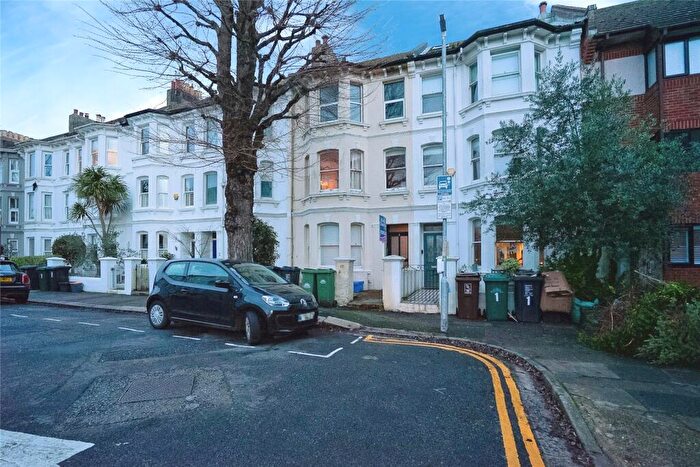
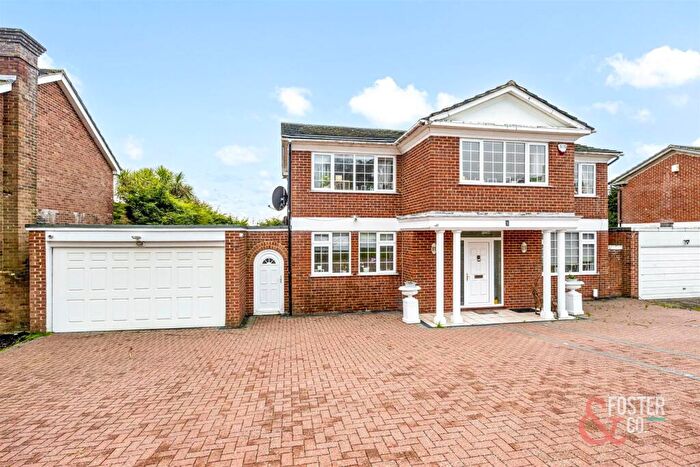
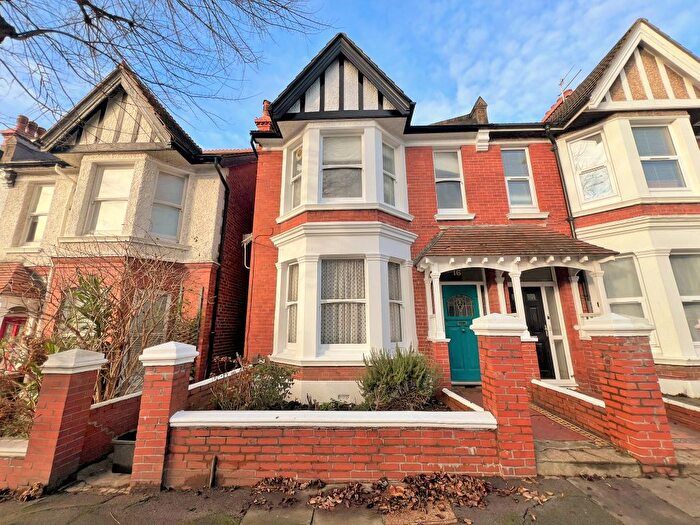
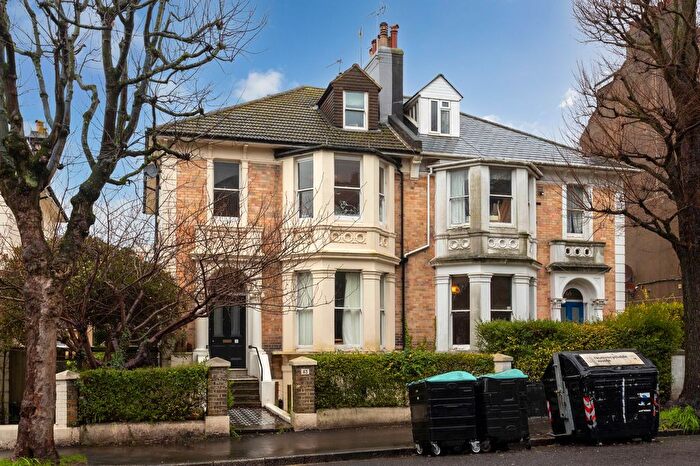
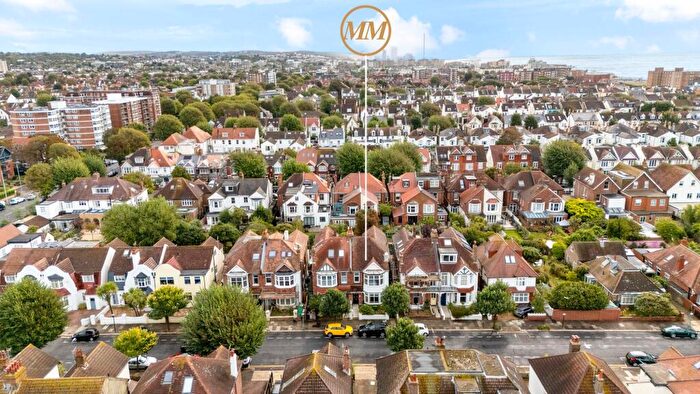
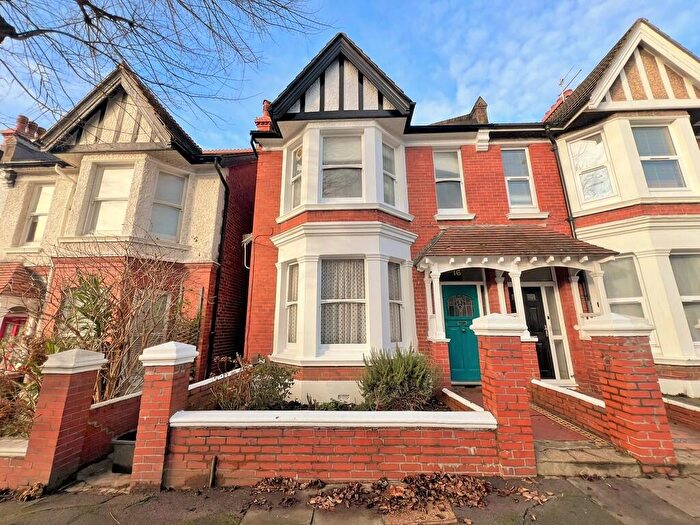
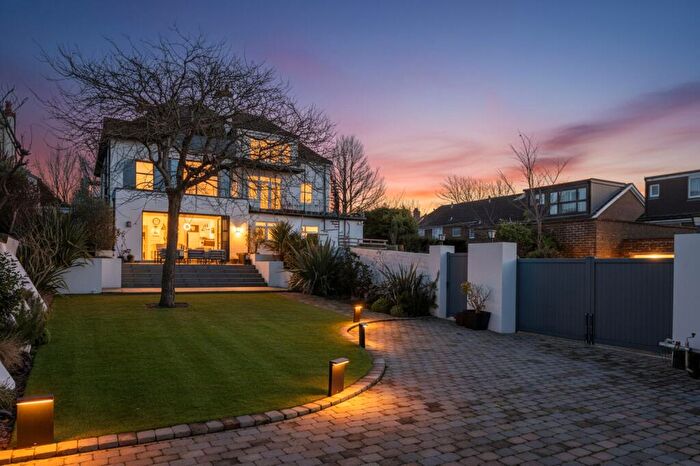
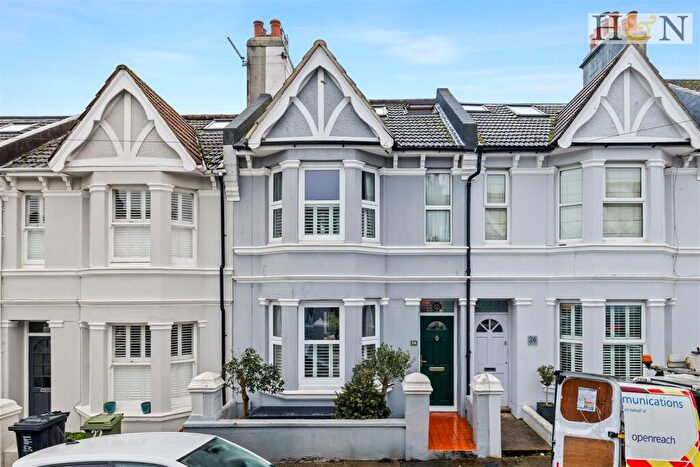
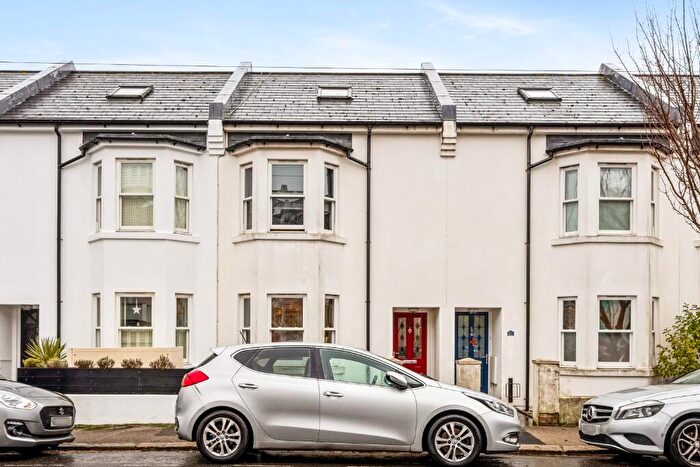
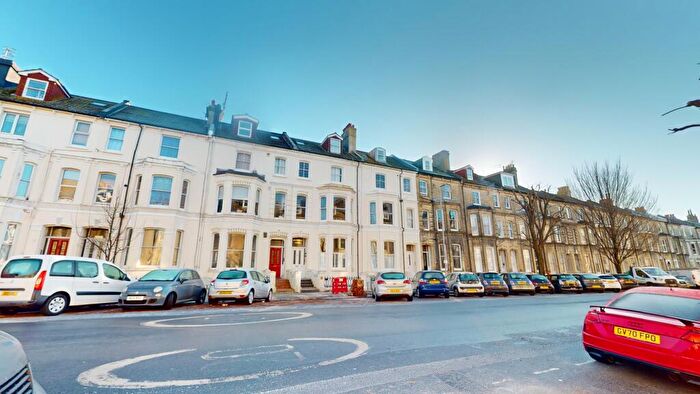
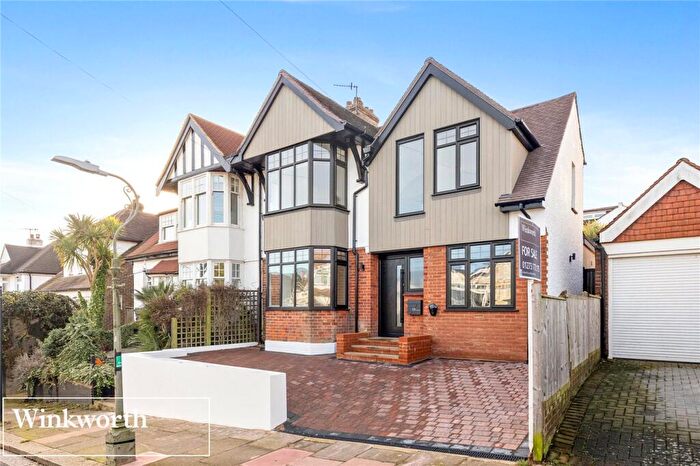
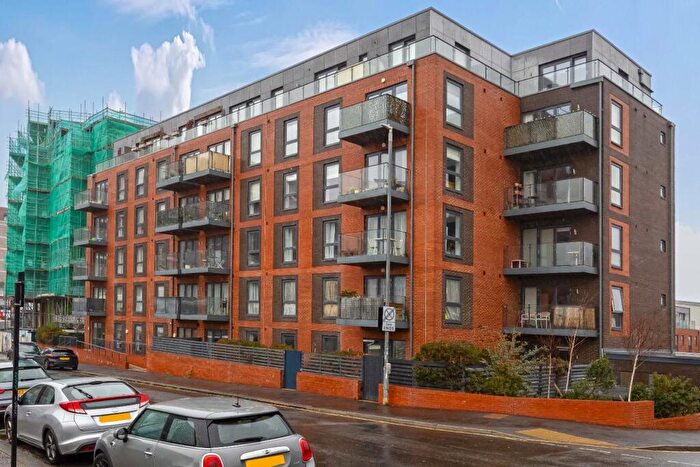
Houses for sale & to rent in Hove Park, Hove
House Prices in Hove Park
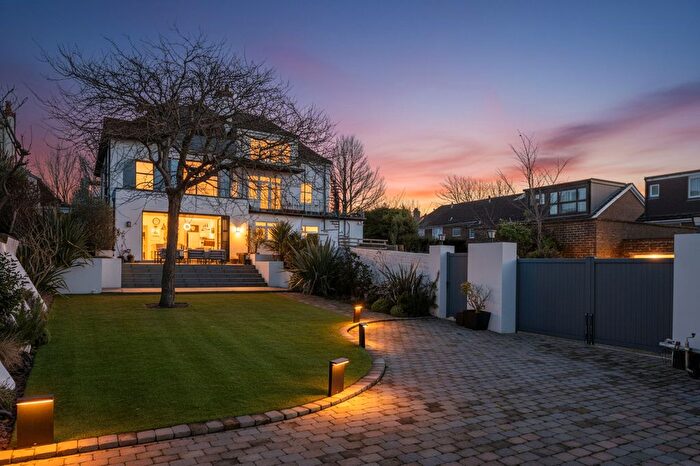
Properties in Hove Park have an average house price of £878,556.00 and had 598 Property Transactions within the last 3 years¹.
Hove Park is an area in Hove, The City of Brighton and Hove with 4,086 households², where the most expensive property was sold for £3,275,000.00.
Properties for sale in Hove Park
Roads and Postcodes in Hove Park
Navigate through our locations to find the location of your next house in Hove Park, Hove for sale or to rent.
| Streets | Postcodes |
|---|---|
| Aldrington Avenue | BN3 7EL BN3 7EN |
| Amherst Crescent | BN3 7EP BN3 7ER |
| Ash Close | BN3 6QS |
| Barrowfield Close | BN3 6TP |
| Barrowfield Drive | BN3 6TF BN3 6TQ |
| Benett Avenue | BN3 6UR |
| Benett Drive | BN3 6PL BN3 6UQ BN3 6US BN3 6UT |
| Bishops Road | BN3 6PN BN3 6PQ |
| Chalfont Drive | BN3 6QR |
| Charles Close | BN3 6WP |
| Chartfield | BN3 7RD |
| Chartfield Way | BN3 7RB |
| Cobton Drive | BN3 6WE BN3 6WF |
| Court Farm Road | BN3 7QR |
| Cranmer Avenue | BN3 7JP BN3 7JQ |
| Cumberland Terrace | BN3 7DR |
| Deanway | BN3 6DG |
| Downside | BN3 6QJ |
| Dyke Close | BN3 6DB |
| Dyke Road | BN3 6NF BN3 6PA BN3 6PB BN3 6PD BN3 6PE BN3 6TE BN3 6EG BN3 6EH |
| Dyke Road Avenue | BN3 6DA BN3 6DN BN3 6DP BN3 6DQ BN3 6QA BN3 6QD |
| Edward Avenue | BN3 6WL |
| Edward Close | BN3 6WJ |
| Elizabeth Avenue | BN3 6WA BN3 6WG |
| Elizabeth Close | BN3 6WH |
| Elm Close | BN3 6TG |
| Elrington Road | BN3 6LG |
| Eridge Road | BN3 7QD |
| Frant Road | BN3 7QS |
| Frith Road | BN3 7AJ |
| Fulmar Close | BN3 6NW |
| Goldstone Close | BN3 7PD |
| Goldstone Crescent | BN3 6BA BN3 6BB BN3 6BD BN3 6BE BN3 6BF BN3 6BG BN3 6LQ BN3 6LR BN3 6LS BN3 6LX BN3 6LY BN3 6AN |
| Goldstone Lane | BN3 7RJ BN3 7RN |
| Goldstone Retail Park | BN3 7PN |
| Goldstone Way | BN3 7PA BN3 7PB |
| Greyfriars | BN3 6NX |
| Hill Brow | BN3 6DD BN3 6QF BN3 6QG BN3 6QH |
| Hill Drive | BN3 6QL BN3 6QN |
| Hove Park Gardens | BN3 6LP BN3 6AJ BN3 6HN |
| Hove Park Road | BN3 6LA BN3 6LH BN3 6LJ BN3 6LL BN3 6LN |
| Hove Park Way | BN3 6PS BN3 6PT BN3 6PW |
| Howard Court | BN3 7QZ |
| Kelly Road | BN3 6LD |
| Kestrel Close | BN3 6NS |
| King George Vi Drive | BN3 6XF |
| King George Vi Mansions | BN3 7QU BN3 7QW BN3 7QX BN3 7QY |
| Landseer Road | BN3 7AF |
| Leighton Road | BN3 7AD BN3 7AE |
| Lloyd Close | BN3 6LZ |
| Lloyd Road | BN3 6NL |
| Lullington Avenue | BN3 7EQ |
| Mallory Road | BN3 6TB BN3 6TD |
| Meadow Close | BN3 6QQ |
| Merlin Close | BN3 6NU |
| Milcote Avenue | BN3 7EJ |
| Mill Drive | BN3 6WB BN3 6WD |
| Nevill Avenue | BN3 7NA BN3 7NB BN3 7ND BN3 7NE BN3 7NS BN3 7BW |
| Nevill Close | BN3 7QT |
| Nevill Gardens | BN3 7QF |
| Nevill Place | BN3 7QJ |
| Nevill Road | BN3 7BP BN3 7BQ BN3 7BS BN3 7BT BN3 7QB BN3 7QE BN3 7QG BN3 7QN BN3 7QP BN3 7QQ BN3 7BN BN3 7BZ BN3 7PZ |
| Nevill Way | BN3 7QL |
| Newtown Road | BN3 7BA |
| Old Shoreham Road | BN3 6NR BN3 7AP BN3 7AQ BN3 7BD BN3 7BE BN3 7EA BN3 7EB BN3 7EG BN3 7EH BN3 6AL BN3 7BX BN3 7EU BN3 7EX |
| Onslow Road | BN3 6TA |
| Orchard Avenue | BN3 7BL |
| Orchard Gardens | BN3 7BH BN3 7BJ |
| Orchard Road | BN3 7BG BN3 7AZ |
| Orpen Road | BN3 6NJ |
| Park View Road | BN3 7AW BN3 7BF |
| Poynter Road | BN3 7AH |
| Prinsep Road | BN3 7AB |
| Queen Alexandra Avenue | BN3 6XH |
| Queen Caroline Close | BN3 6WW |
| Queen Mary Avenue | BN3 6XG |
| Queen Victoria Avenue | BN3 6WN BN3 6WR BN3 6WT BN3 6XB BN3 6XA |
| Radinden Drive | BN3 6LB |
| Radinden Manor Road | BN3 6NH |
| Rigden Road | BN3 6NP |
| Sackville Road | BN3 7AA BN3 7AG BN3 7AL |
| Sackville Trading Estate | BN3 7AN |
| Sandringham Close | BN3 6XE |
| Sandringham Drive | BN3 6XD |
| Shirley Avenue | BN3 6UN |
| Shirley Drive | BN3 6NQ BN3 6QP BN3 6UA BN3 6UB BN3 6UD BN3 6UE BN3 6UF BN3 6UJ BN3 6UL BN3 6UP |
| Shirley Road | BN3 6NN |
| St Josephs Close | BN3 7ES BN3 7EZ BN3 7HG |
| Stanford Close | BN3 6PU |
| Sussex House Industrial Estate | BN3 7DX |
| The Droveway | BN3 6LE BN3 6LF BN3 6PP BN3 6PR BN3 6LU BN3 7AU BN3 7PY BN3 7QA |
| The Green | BN3 6TH |
| The Martlet | BN3 6NT |
| The Paddock | BN3 6LT |
| The Spinney | BN3 6QT |
| The Upper Drive | BN3 6NA BN3 6NE BN3 6NB BN3 6ND |
| Tongdean Avenue | BN3 6TL BN3 6TN |
| Tongdean Place | BN3 6QW |
| Tongdean Road | BN3 6QB BN3 6QE |
| Torrance Close | BN3 7JR |
| Tredcroft Road | BN3 6UG BN3 6UH |
| Weald Avenue | BN3 7JN |
| Windsor Close | BN3 6WQ BN3 6WS |
| Woodland Avenue | BN3 6BH BN3 6BJ BN3 6BL BN3 6BN |
| Woodland Close | BN3 6BP |
| Woodland Drive | BN3 6DE BN3 6DF BN3 6DH BN3 6DJ BN3 6DL BN3 6DS BN3 7QH BN3 7RA |
| Woodland Parade | BN3 6DR |
| Woodlands | BN3 6TJ |
| Woodruff Avenue | BN3 6PF BN3 6PG BN3 6PH BN3 6PJ |
| Yorklands | BN3 6RW |
Transport near Hove Park
-
Hove Station
-
Aldrington Station
-
Preston Park Station
-
Portslade Station
-
London Road Brighton Station
-
Brighton Station
-
Fishersgate Station
-
Moulsecoomb Station
-
Southwick Station
- FAQ
- Price Paid By Year
- Property Type Price
Frequently asked questions about Hove Park
What is the average price for a property for sale in Hove Park?
The average price for a property for sale in Hove Park is £878,556. This amount is 63% higher than the average price in Hove. There are more than 10,000 property listings for sale in Hove Park.
What streets have the most expensive properties for sale in Hove Park?
The streets with the most expensive properties for sale in Hove Park are Dyke Close at an average of £2,500,000, Tongdean Avenue at an average of £2,286,875 and Tongdean Road at an average of £1,765,384.
What streets have the most affordable properties for sale in Hove Park?
The streets with the most affordable properties for sale in Hove Park are Goldstone Lane at an average of £288,772, Windsor Close at an average of £310,583 and Old Shoreham Road at an average of £413,681.
Which train stations are available in or near Hove Park?
Some of the train stations available in or near Hove Park are Hove, Aldrington and Preston Park.
Property Price Paid in Hove Park by Year
The average sold property price by year was:
| Year | Average Sold Price | Price Change |
Sold Properties
|
|---|---|---|---|
| 2025 | £797,688 | -6% |
102 Properties |
| 2024 | £845,878 | -1% |
166 Properties |
| 2023 | £854,923 | -13% |
132 Properties |
| 2022 | £963,366 | 17% |
198 Properties |
| 2021 | £799,311 | 7% |
193 Properties |
| 2020 | £741,177 | 14% |
163 Properties |
| 2019 | £639,506 | -1% |
200 Properties |
| 2018 | £648,779 | -11% |
148 Properties |
| 2017 | £717,548 | 11% |
161 Properties |
| 2016 | £640,500 | 5% |
177 Properties |
| 2015 | £605,793 | -0,5% |
219 Properties |
| 2014 | £608,621 | 14% |
205 Properties |
| 2013 | £523,984 | 4% |
168 Properties |
| 2012 | £500,944 | 2% |
154 Properties |
| 2011 | £490,391 | 4% |
150 Properties |
| 2010 | £468,464 | 9% |
138 Properties |
| 2009 | £425,688 | -8% |
144 Properties |
| 2008 | £458,879 | -3% |
88 Properties |
| 2007 | £474,301 | 17% |
211 Properties |
| 2006 | £395,146 | 18% |
223 Properties |
| 2005 | £325,683 | -14% |
225 Properties |
| 2004 | £372,122 | 18% |
234 Properties |
| 2003 | £303,477 | 13% |
216 Properties |
| 2002 | £263,941 | 13% |
231 Properties |
| 2001 | £230,099 | 11% |
233 Properties |
| 2000 | £204,040 | 16% |
224 Properties |
| 1999 | £170,967 | 11% |
277 Properties |
| 1998 | £152,179 | 16% |
246 Properties |
| 1997 | £128,033 | 15% |
235 Properties |
| 1996 | £108,994 | 2% |
260 Properties |
| 1995 | £107,185 | - |
185 Properties |
Property Price per Property Type in Hove Park
Here you can find historic sold price data in order to help with your property search.
The average Property Paid Price for specific property types in the last three years are:
| Property Type | Average Sold Price | Sold Properties |
|---|---|---|
| Flat | £365,507.00 | 123 Flats |
| Semi Detached House | £745,928.00 | 166 Semi Detached Houses |
| Detached House | £1,279,535.00 | 249 Detached Houses |
| Terraced House | £633,178.00 | 60 Terraced Houses |

