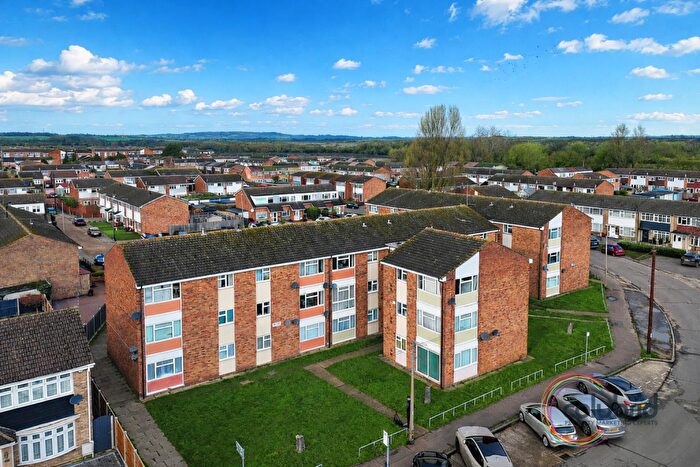
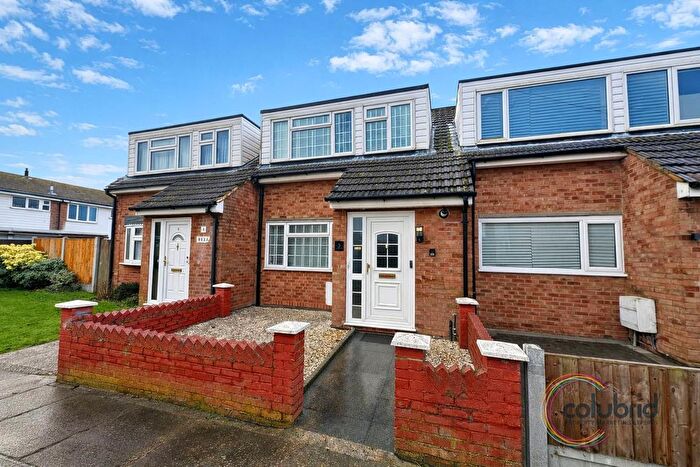
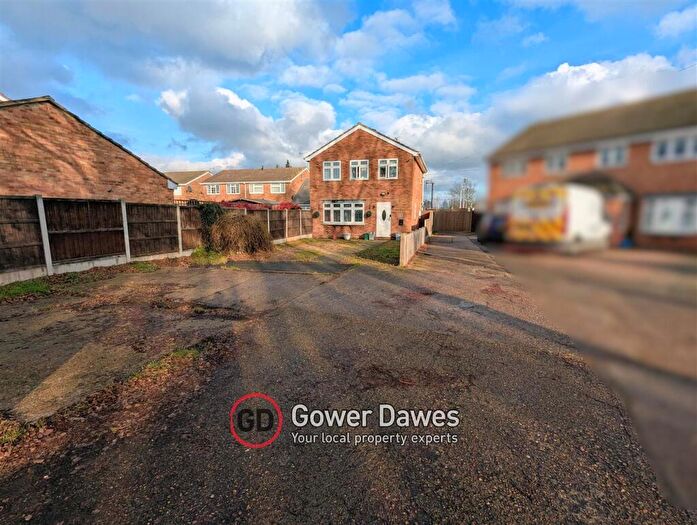
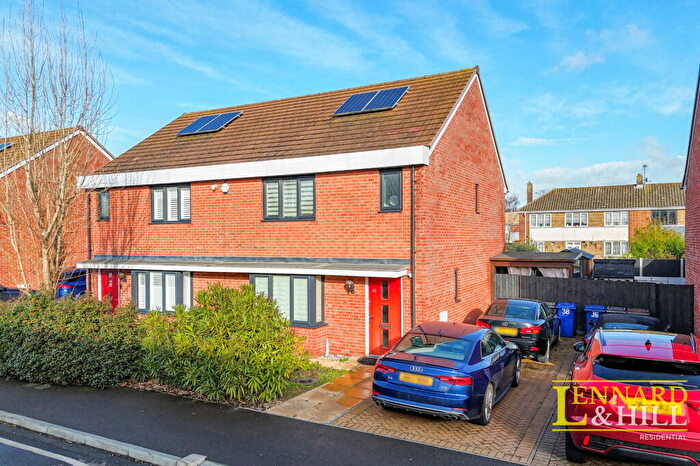
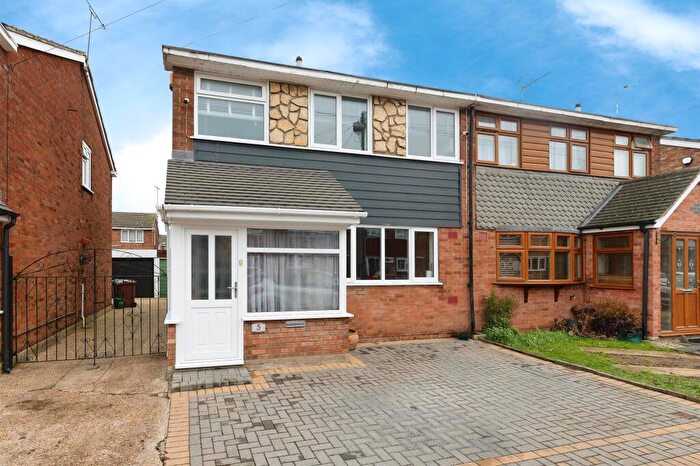
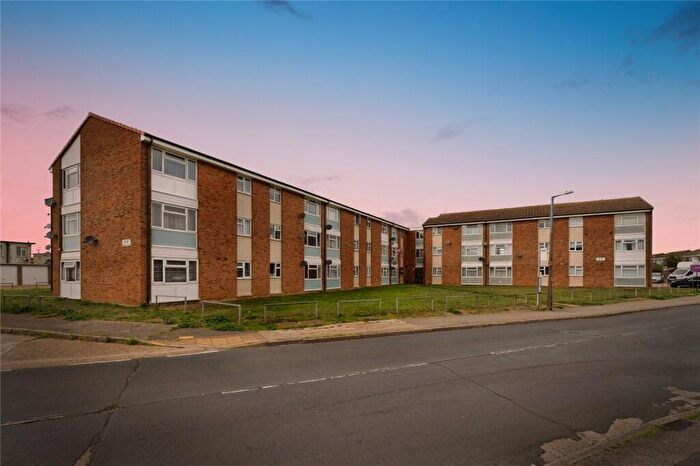
Houses for sale & to rent in East Tilbury, Tilbury
House Prices in East Tilbury
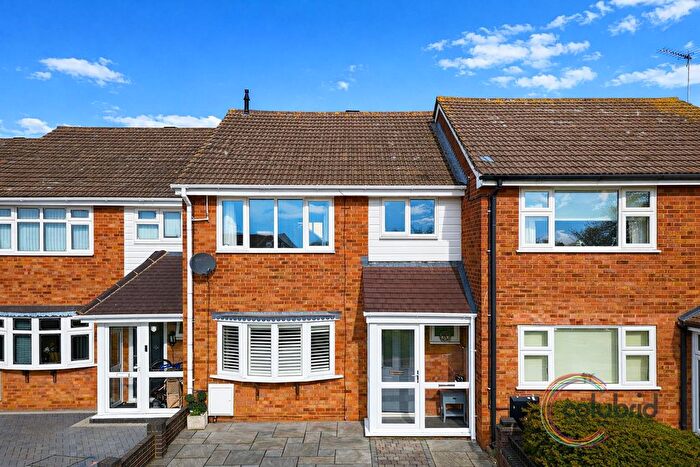
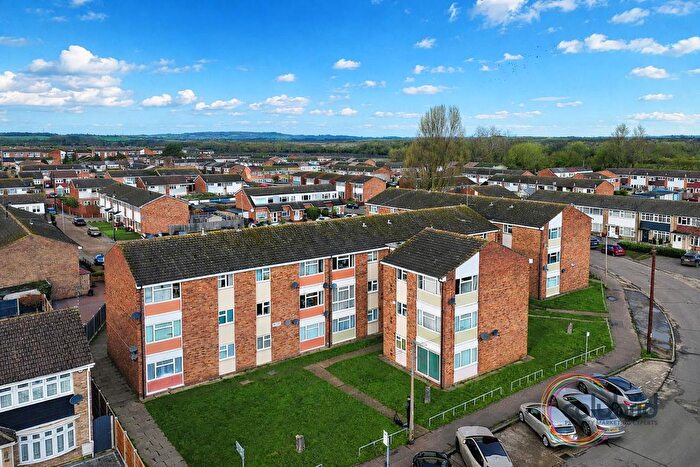
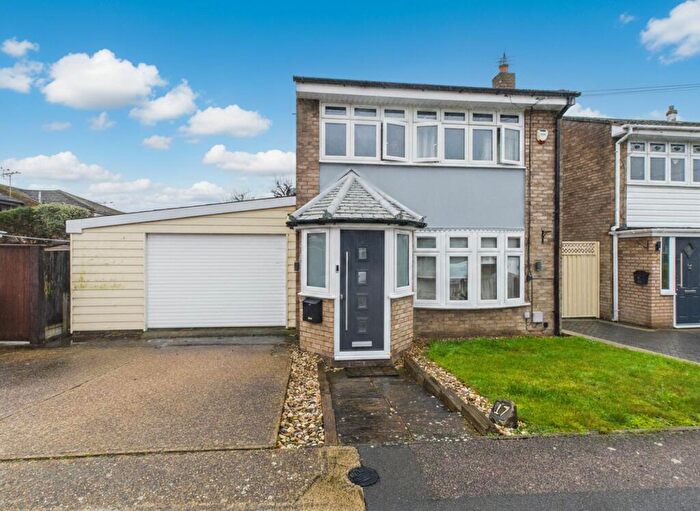
Properties in East Tilbury have an average house price of £335,123.00 and had 209 Property Transactions within the last 3 years¹.
East Tilbury is an area in Tilbury, Thurrock with 1,638 households², where the most expensive property was sold for £1,250,000.00.
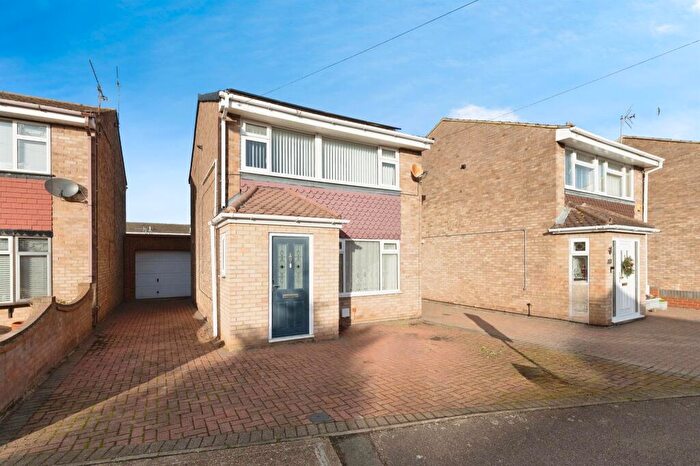
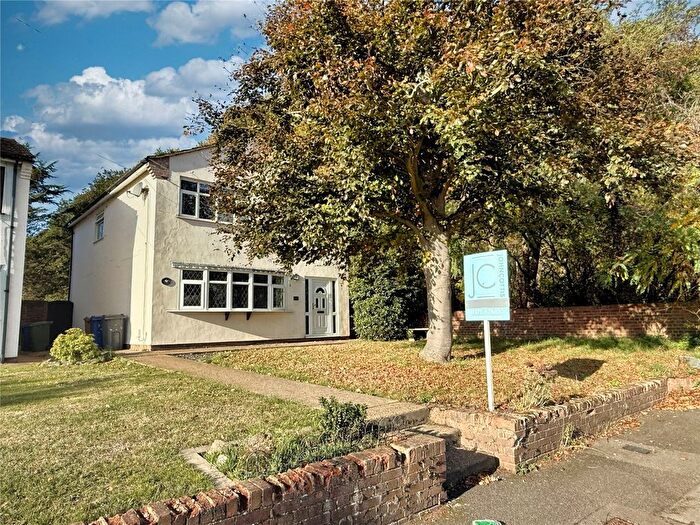
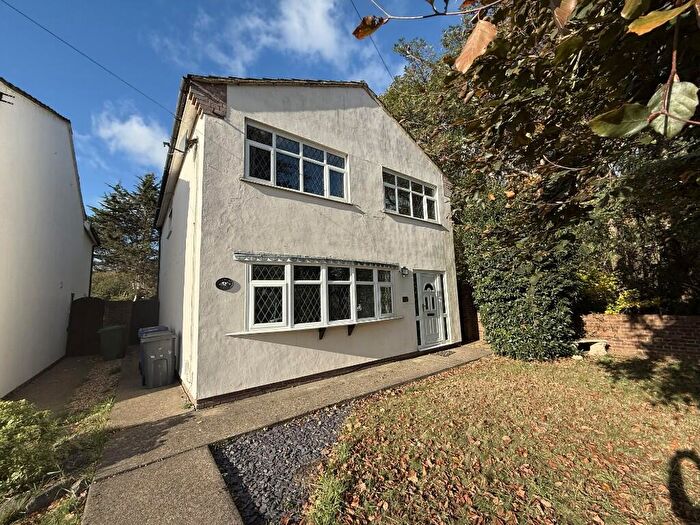
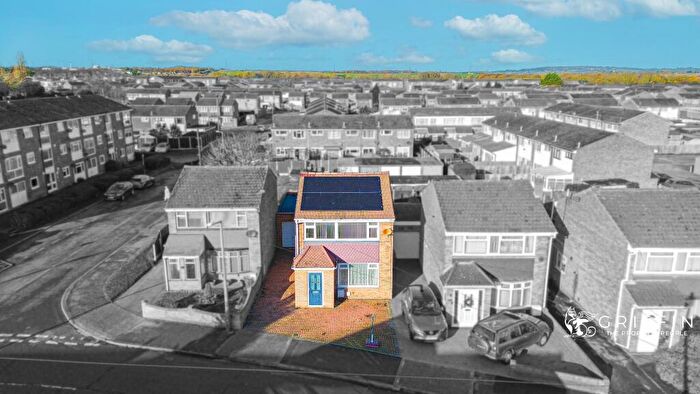
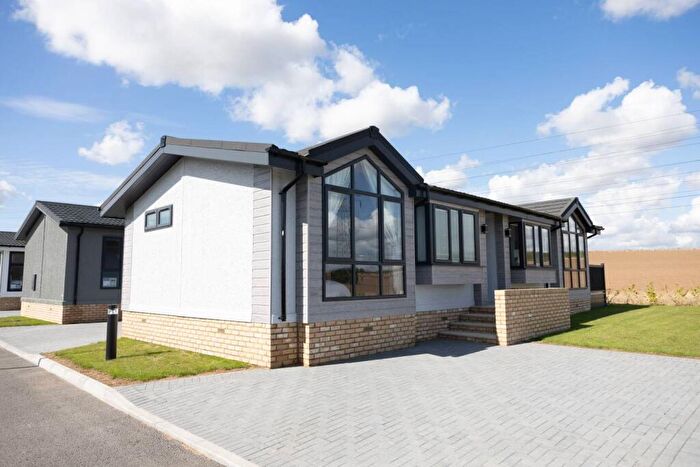
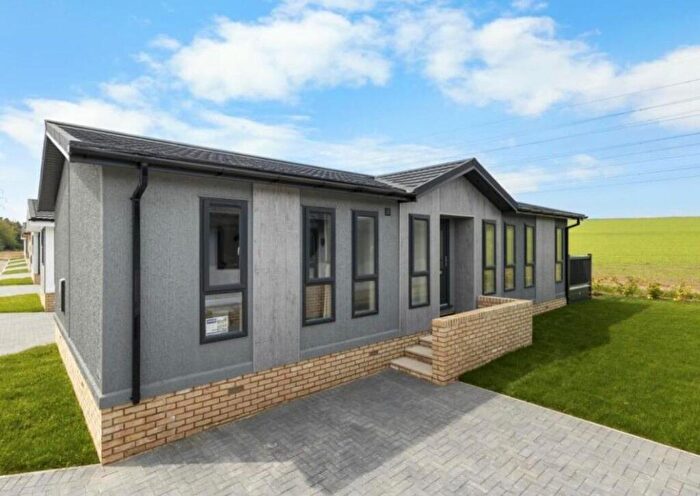
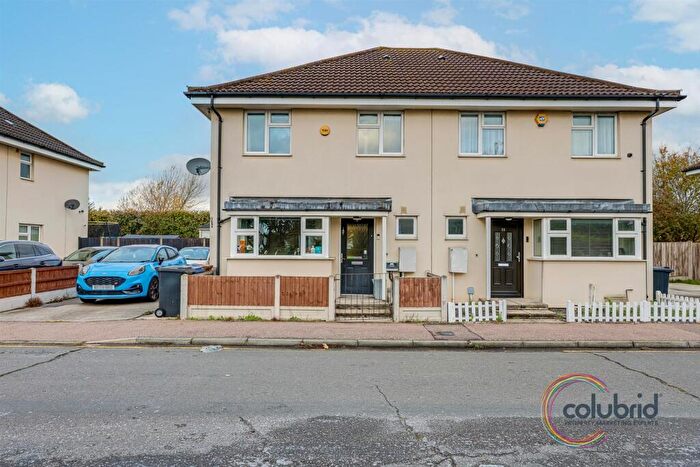
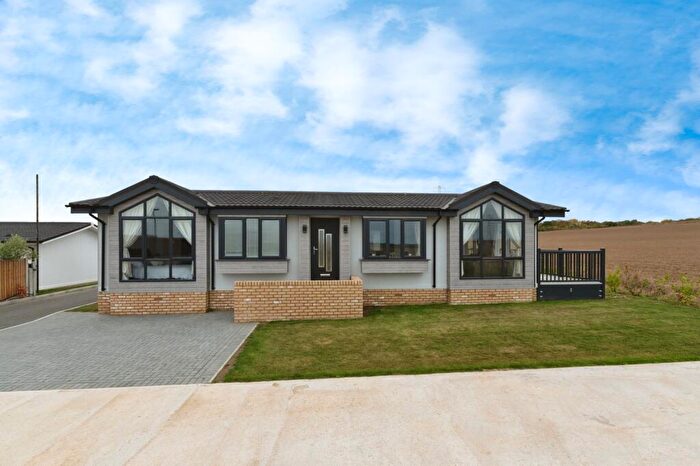
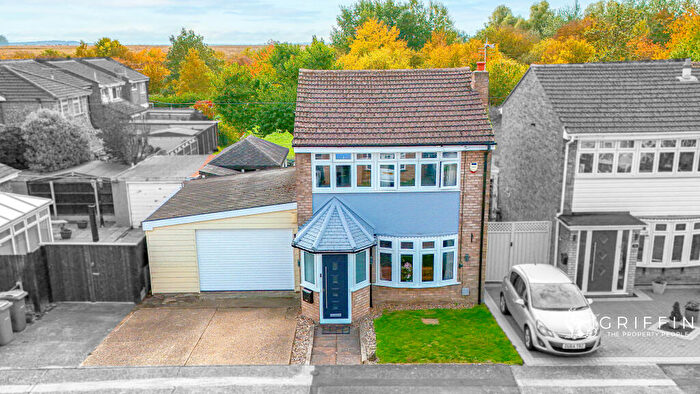
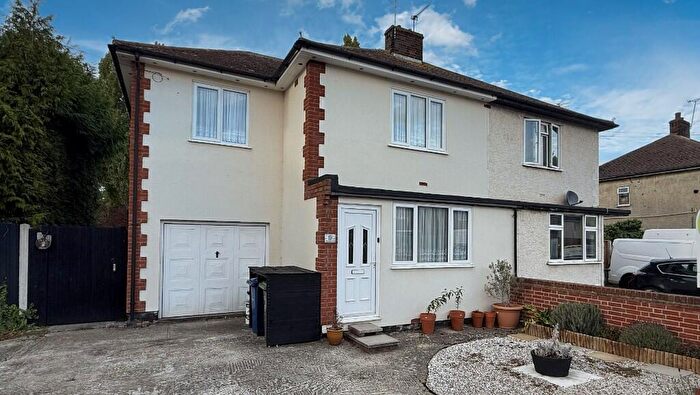
Properties for sale in East Tilbury
Roads and Postcodes in East Tilbury
Navigate through our locations to find the location of your next house in East Tilbury, Tilbury for sale or to rent.
| Streets | Postcodes |
|---|---|
| Alexandra Way | RM18 8NT |
| Arun | RM18 8SX |
| Bata Avenue | RM18 8SD |
| Bata Mews | RM18 8FR |
| Blue Anchor Lane | RM18 8TT |
| Bure | RM18 8SF |
| Calder | RM18 8RU |
| Church Road | RM18 8QU RM18 8QX RM18 8UB |
| Clyde | RM18 8RY |
| Colne | RM18 8RF |
| Colne Court | RM18 8RE |
| Coronation Avenue | RM18 8SJ RM18 8SR RM18 8SW RM18 8TA RM18 8TB RM18 8TE |
| Deben | RM18 8RG |
| Farm Road | RM18 8RD |
| Frome | RM18 8TD |
| Gloucester Avenue | RM18 8RB |
| Gordon Close | RM18 8PQ |
| Gun Hill | RM18 8TH |
| Hayle | RM18 8RN |
| High House Lane | RM18 8TL |
| Hoford Road | RM18 8TR |
| King George Vi Avenue | RM18 8SL |
| Lambourne | RM18 8RS |
| Lapwin Close | RM18 8FH |
| Linley Close | RM18 8PT |
| Love Lane | RM18 8QJ |
| Low Street Lane | RM18 8RA |
| Muckingford Road | RM18 8TS RM18 8TP |
| Orwell | RM18 8RR |
| Pintail Close | RM18 8FJ |
| Pipit Close | RM18 8FL |
| Princess Avenue | RM18 8ST |
| Princess Margaret Road | RM18 8NX RM18 8PB RM18 8PH RM18 8PL RM18 8PN RM18 8PP RM18 8PU RM18 8PX RM18 8QD RM18 8RP RM18 8SB RM18 8YP RM18 8YR RM18 8PA RM18 8PD RM18 8QH RM18 8RJ |
| Queen Elizabeth Avenue | RM18 8SP |
| Queen Mary Avenue | RM18 8NR RM18 8SS |
| Rectory Road | RM18 8UD |
| Roach | RM18 8RZ |
| Roman | RM18 8SE |
| Sanderling Close | RM18 8FF |
| Sandpiper Close | RM18 8FA |
| Severn | RM18 8SG |
| Shearwater Avenue | RM18 8DQ |
| Solway | RM18 8RQ |
| Station Road | RM18 8QR RM18 8QP |
| Strathmore | RM18 8RW |
| Thames Industrial Park | RM18 8RH |
| The Green | RM18 8TU RM18 8TX |
| Thomas Bata Avenue | RM18 8SH RM18 8FQ |
| Torridge | RM18 8SN |
| Trent | RM18 8SU |
| Turnpike Lane | RM18 8TJ |
| Turnstone Close | RM18 8FG |
| Tweed | RM18 8RT |
| Tyne | RM18 8RX |
| Waldon | RM18 8SQ |
| Welland | RM18 8UT |
Transport near East Tilbury
- FAQ
- Price Paid By Year
- Property Type Price
Frequently asked questions about East Tilbury
What is the average price for a property for sale in East Tilbury?
The average price for a property for sale in East Tilbury is £335,123. This amount is 9% higher than the average price in Tilbury. There are 549 property listings for sale in East Tilbury.
What streets have the most expensive properties for sale in East Tilbury?
The streets with the most expensive properties for sale in East Tilbury are Gun Hill at an average of £1,135,000, Blue Anchor Lane at an average of £973,333 and Queen Elizabeth Avenue at an average of £428,000.
What streets have the most affordable properties for sale in East Tilbury?
The streets with the most affordable properties for sale in East Tilbury are Colne Court at an average of £129,000, Coronation Avenue at an average of £237,340 and Linley Close at an average of £250,000.
Which train stations are available in or near East Tilbury?
Some of the train stations available in or near East Tilbury are East Tilbury, Stanford-Le-Hope and Tilbury Town.
Property Price Paid in East Tilbury by Year
The average sold property price by year was:
| Year | Average Sold Price | Price Change |
Sold Properties
|
|---|---|---|---|
| 2025 | £356,096 | 7% |
62 Properties |
| 2024 | £329,753 | 2% |
63 Properties |
| 2023 | £323,671 | 4% |
84 Properties |
| 2022 | £310,675 | 4% |
69 Properties |
| 2021 | £298,664 | 6% |
96 Properties |
| 2020 | £279,795 | -2% |
88 Properties |
| 2019 | £285,904 | 2% |
83 Properties |
| 2018 | £279,202 | -1% |
69 Properties |
| 2017 | £282,699 | 11% |
134 Properties |
| 2016 | £251,602 | 20% |
176 Properties |
| 2015 | £201,685 | 23% |
102 Properties |
| 2014 | £155,207 | -3% |
65 Properties |
| 2013 | £159,542 | 10% |
35 Properties |
| 2012 | £143,148 | 8% |
47 Properties |
| 2011 | £132,028 | -30% |
35 Properties |
| 2010 | £171,085 | 26% |
46 Properties |
| 2009 | £126,159 | -17% |
25 Properties |
| 2008 | £147,015 | 0,1% |
42 Properties |
| 2007 | £146,938 | 1% |
111 Properties |
| 2006 | £145,523 | 11% |
101 Properties |
| 2005 | £129,506 | 11% |
92 Properties |
| 2004 | £115,650 | 13% |
112 Properties |
| 2003 | £100,699 | 13% |
110 Properties |
| 2002 | £88,099 | 19% |
111 Properties |
| 2001 | £71,426 | 20% |
98 Properties |
| 2000 | £56,969 | 4% |
96 Properties |
| 1999 | £54,562 | 21% |
88 Properties |
| 1998 | £43,140 | -0,3% |
88 Properties |
| 1997 | £43,272 | 9% |
86 Properties |
| 1996 | £39,509 | 0,4% |
86 Properties |
| 1995 | £39,332 | - |
70 Properties |
Property Price per Property Type in East Tilbury
Here you can find historic sold price data in order to help with your property search.
The average Property Paid Price for specific property types in the last three years are:
| Property Type | Average Sold Price | Sold Properties |
|---|---|---|
| Semi Detached House | £363,209.00 | 102 Semi Detached Houses |
| Detached House | £544,527.00 | 18 Detached Houses |
| Terraced House | £329,926.00 | 54 Terraced Houses |
| Flat | £153,600.00 | 35 Flats |

