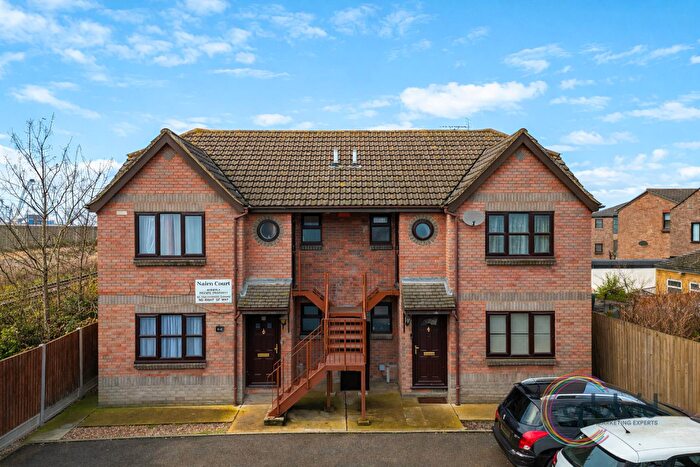
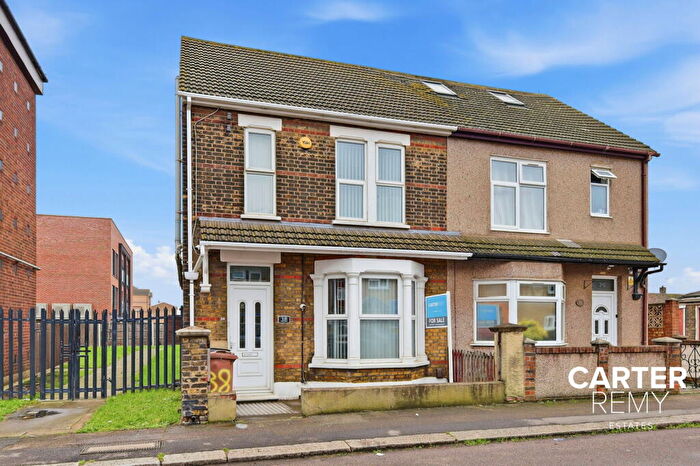
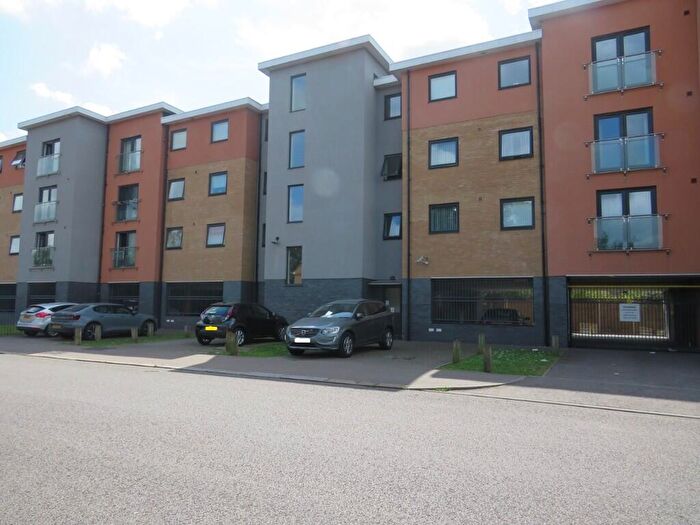
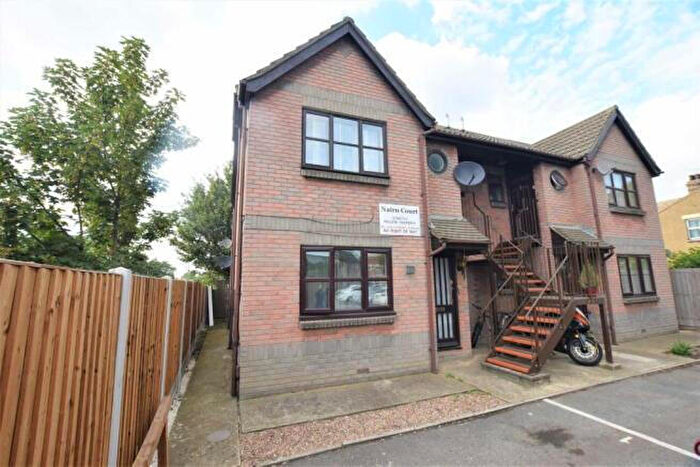
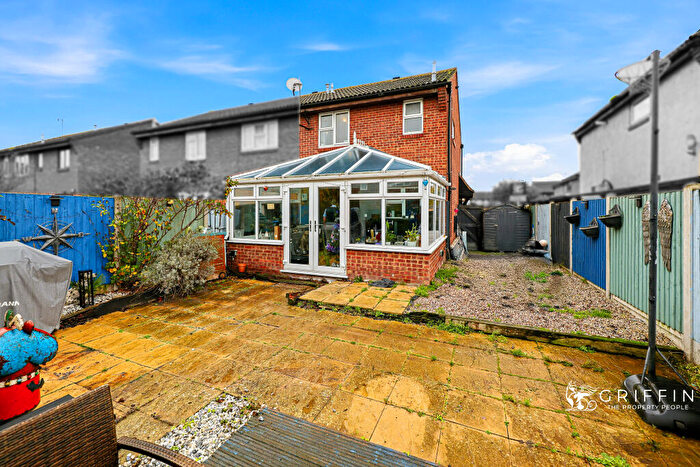
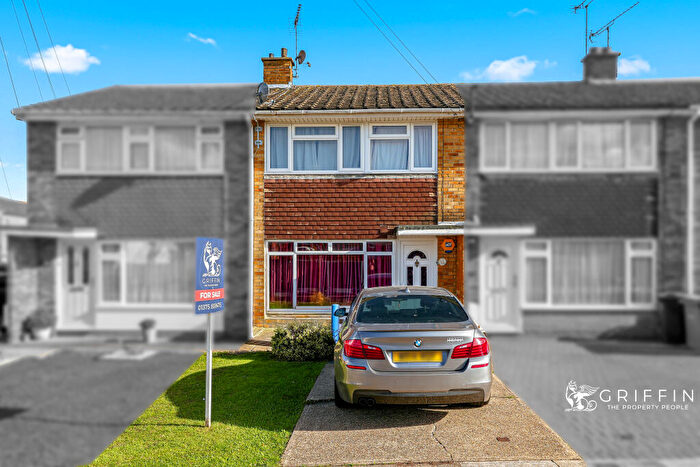
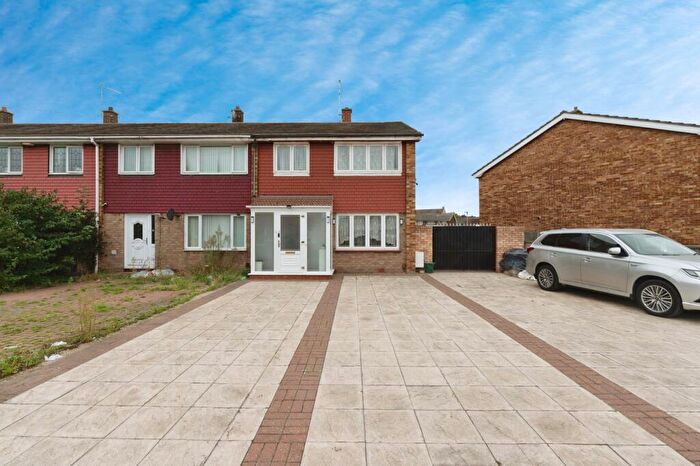
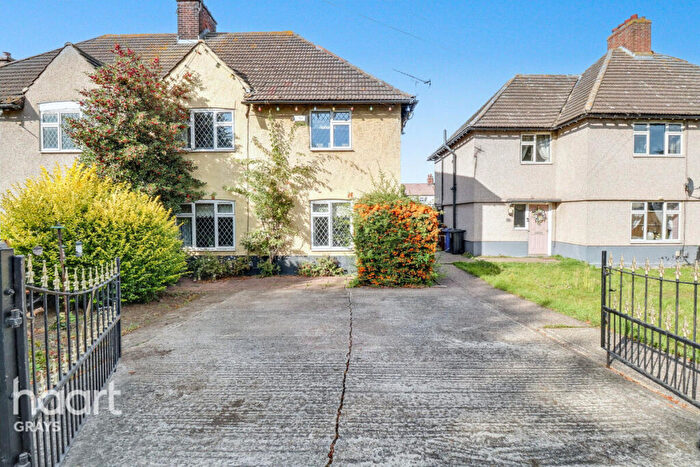
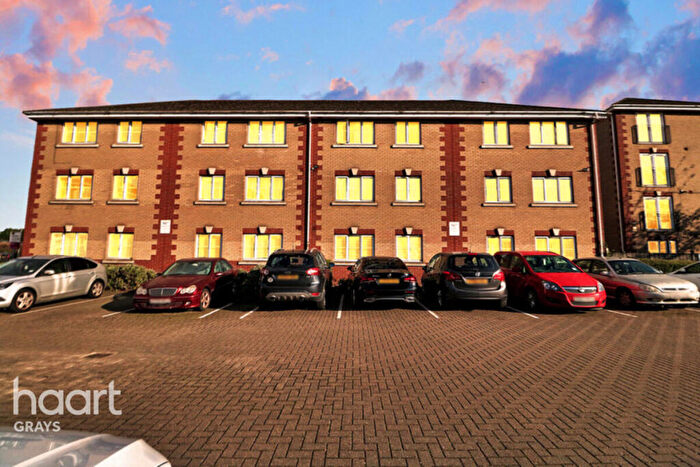
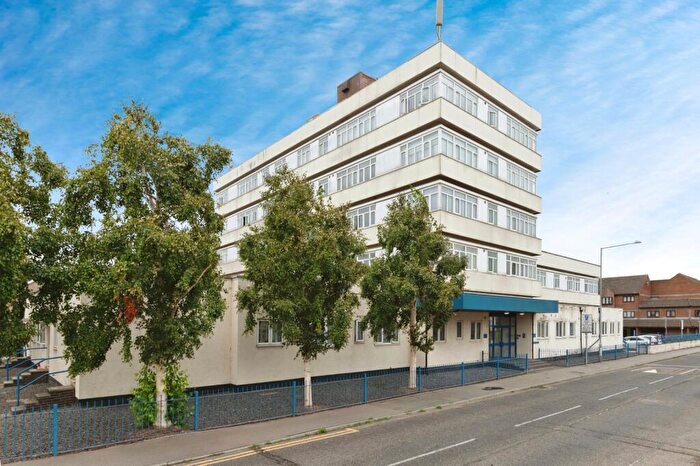
Houses for sale & to rent in Tilbury St Chads, Tilbury
House Prices in Tilbury St Chads
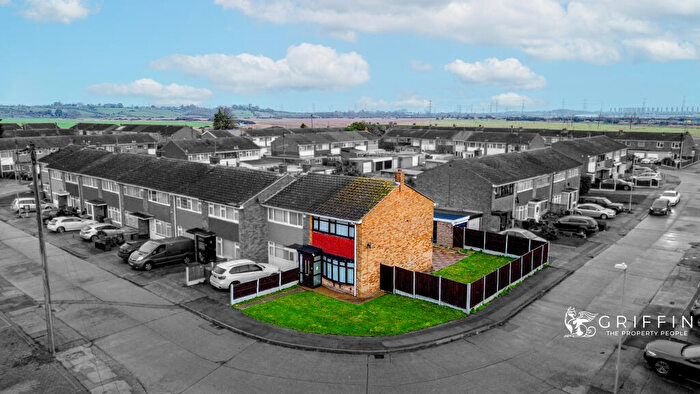
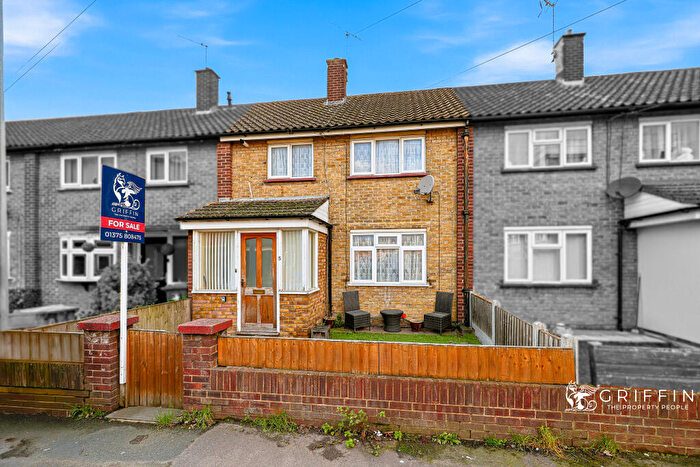
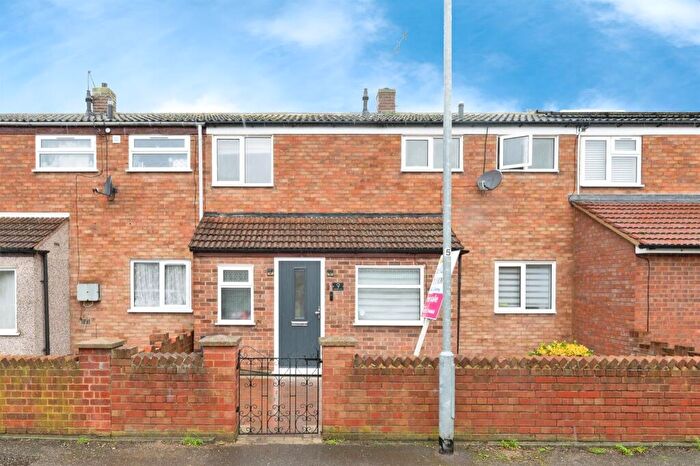
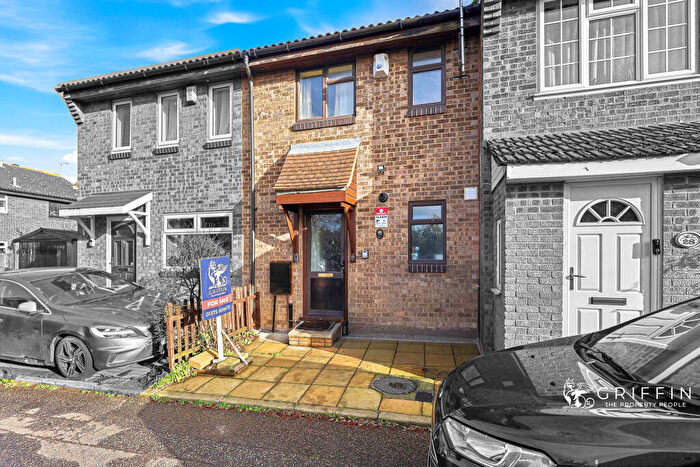
Properties in Tilbury St Chads have an average house price of £305,465.00 and had 148 Property Transactions within the last 3 years¹.
Tilbury St Chads is an area in Tilbury, Thurrock with 2,274 households², where the most expensive property was sold for £450,000.00.
Properties for sale in Tilbury St Chads
Roads and Postcodes in Tilbury St Chads
Navigate through our locations to find the location of your next house in Tilbury St Chads, Tilbury for sale or to rent.
| Streets | Postcodes |
|---|---|
| Albany Road | RM18 7BF |
| Arkwright Road | RM18 8XL |
| Arnold Place | RM18 8HG |
| Berkeley Terrace | RM18 8AN |
| Brennan Road | RM18 8AH RM18 8AJ RM18 8AU RM18 8BA |
| Burns Place | RM18 8JQ |
| Byron Gardens | RM18 8BB RM18 8BD RM18 8BE |
| Calcutta Road | RM18 7QU |
| Central Avenue | RM18 7RX |
| Chapel Road | RM18 7AY |
| Christchurch Road | RM18 7RD RM18 8XP |
| Civic Square | RM18 8AD |
| Cowper Avenue | RM18 8AR RM18 8AS |
| Dickens Avenue | RM18 8HJ |
| Dock Road | RM18 7EP RM18 7EQ |
| Dryden Place | RM18 8HQ |
| Elgar Gardens | RM18 8LS |
| Feenan Highway | RM18 8ER RM18 8ES RM18 8ET RM18 8EX RM18 8HA RM18 8HD RM18 8HH RM18 8JD RM18 8JJ |
| Fielding Avenue | RM18 8HL RM18 8HN RM18 8HW RM18 8JE |
| Fleming Gardens | RM18 8JR |
| Gainsborough Avenue | RM18 8LR RM18 8LT RM18 8LL |
| Galsworthy Road | RM18 8JS |
| Handel Crescent | RM18 8NH |
| Kipling Avenue | RM18 8HE RM18 8HF RM18 8JF |
| Lansbury Gardens | RM18 7RU |
| Lawrence Gardens | RM18 8HB |
| Leighton Gardens | RM18 8ND |
| Manor Road | RM18 8XR |
| Melba Gardens | RM18 8NB |
| Millais Place | RM18 8NJ |
| Milton Gardens | RM18 8JL |
| Mulberry Way | RM18 7DH |
| Northview Avenue | RM18 7RT |
| Ottawa Road | RM18 7RH RM18 7RJ |
| Pageant Close | RM18 8EP |
| Parker Avenue | RM18 8HX RM18 8JA |
| Pepys Close | RM18 8JT |
| Portsea Road | RM18 8AX |
| Poynder Road | RM18 8LU |
| Quebec Road | RM18 7RA RM18 7RB |
| Queen Elizabeth Place | RM18 7DX |
| Raphael Avenue | RM18 8LX RM18 8NA |
| Shakespeare Avenue | RM18 8AP |
| Shaw Crescent | RM18 8HY |
| Shelley Place | RM18 8HP |
| Southey Walk | RM18 8AT |
| Southview Avenue | RM18 7SA |
| Spencer Walk | RM18 8XH RM18 8XJ |
| Spindles | RM18 8NP |
| St Chads Road | RM18 8LA RM18 8LD RM18 8LH RM18 8LJ RM18 8NL RM18 8LB RM18 8FN RM18 8FP |
| Stephenson Avenue | RM18 8XB RM18 8XD |
| Sullivan Road | RM18 8LP |
| Swinburne Gardens | RM18 8JP |
| Sycamore Close | RM18 7TB |
| Thackeray Avenue | RM18 8HR RM18 8HS RM18 8HT RM18 8HU |
| The Circle | RM18 7RS |
| Tilbury Gardens | RM18 7AW |
| Toronto Road | RM18 7RL RM18 7RP |
| Winchelsea Road | RM18 7EE |
| Windrush Road | RM18 7AN RM18 7EW |
| Wren Walk | RM18 8EU |
| RM18 8NG |
Transport near Tilbury St Chads
-
Tilbury Town Station
-
Gravesend Station
-
Grays Station
-
Northfleet Station
-
East Tilbury Station
-
Ebbsfleet International Station
-
Swanscombe Station
- FAQ
- Price Paid By Year
- Property Type Price
Frequently asked questions about Tilbury St Chads
What is the average price for a property for sale in Tilbury St Chads?
The average price for a property for sale in Tilbury St Chads is £305,465. This amount is 0.98% lower than the average price in Tilbury. There are 598 property listings for sale in Tilbury St Chads.
What streets have the most expensive properties for sale in Tilbury St Chads?
The streets with the most expensive properties for sale in Tilbury St Chads are Millais Place at an average of £410,000, Stephenson Avenue at an average of £397,857 and Pepys Close at an average of £385,000.
What streets have the most affordable properties for sale in Tilbury St Chads?
The streets with the most affordable properties for sale in Tilbury St Chads are Arnold Place at an average of £201,000, Parker Avenue at an average of £201,375 and Kipling Avenue at an average of £211,250.
Which train stations are available in or near Tilbury St Chads?
Some of the train stations available in or near Tilbury St Chads are Tilbury Town, Gravesend and Grays.
Property Price Paid in Tilbury St Chads by Year
The average sold property price by year was:
| Year | Average Sold Price | Price Change |
Sold Properties
|
|---|---|---|---|
| 2025 | £313,080 | 4% |
57 Properties |
| 2024 | £299,352 | -1% |
59 Properties |
| 2023 | £303,171 | 0,3% |
32 Properties |
| 2022 | £302,296 | 11% |
62 Properties |
| 2021 | £270,379 | 12% |
56 Properties |
| 2020 | £238,936 | -3% |
63 Properties |
| 2019 | £247,134 | 3% |
56 Properties |
| 2018 | £240,728 | 10% |
61 Properties |
| 2017 | £217,813 | 4% |
70 Properties |
| 2016 | £209,953 | 16% |
85 Properties |
| 2015 | £177,019 | 14% |
91 Properties |
| 2014 | £151,983 | 13% |
91 Properties |
| 2013 | £132,578 | 4% |
53 Properties |
| 2012 | £127,564 | 0,1% |
39 Properties |
| 2011 | £127,382 | 7% |
35 Properties |
| 2010 | £118,601 | -11% |
33 Properties |
| 2009 | £131,326 | -11% |
19 Properties |
| 2008 | £145,383 | -0,3% |
35 Properties |
| 2007 | £145,809 | 12% |
126 Properties |
| 2006 | £128,874 | -1% |
98 Properties |
| 2005 | £130,415 | 1% |
88 Properties |
| 2004 | £128,953 | 18% |
104 Properties |
| 2003 | £105,824 | 24% |
146 Properties |
| 2002 | £80,799 | 21% |
159 Properties |
| 2001 | £63,513 | 17% |
167 Properties |
| 2000 | £52,689 | 16% |
134 Properties |
| 1999 | £44,137 | 8% |
118 Properties |
| 1998 | £40,706 | 10% |
82 Properties |
| 1997 | £36,751 | 11% |
93 Properties |
| 1996 | £32,781 | -4% |
93 Properties |
| 1995 | £33,942 | - |
82 Properties |
Property Price per Property Type in Tilbury St Chads
Here you can find historic sold price data in order to help with your property search.
The average Property Paid Price for specific property types in the last three years are:
| Property Type | Average Sold Price | Sold Properties |
|---|---|---|
| Semi Detached House | £336,631.00 | 40 Semi Detached Houses |
| Detached House | £366,000.00 | 2 Detached Houses |
| Terraced House | £306,767.00 | 94 Terraced Houses |
| Flat | £181,291.00 | 12 Flats |

