
Houses for sale & to rent in RM18 8ET, Feenan Highway, Tilbury St Chads, Tilbury
House Prices in RM18 8ET, Feenan Highway, Tilbury St Chads
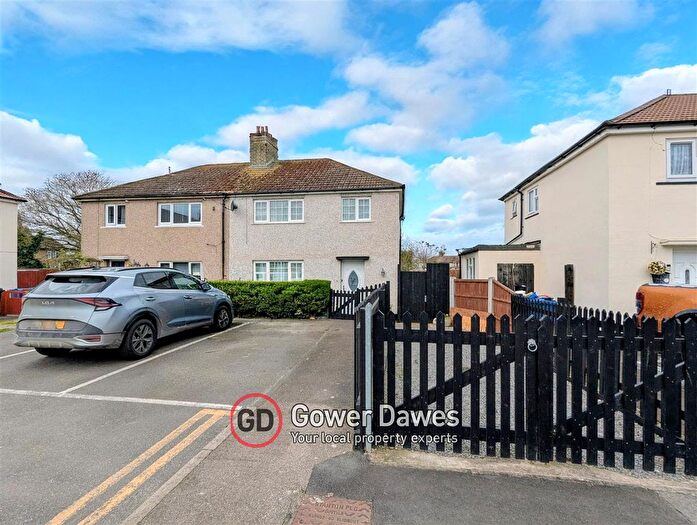
Properties in RM18 8ET have an average house price of £329k and had 1 Property Transaction within the last 3 years.¹ RM18 8ET is a postcode in Feenan Highway located in Tilbury St Chads, an area in Tilbury, Thurrock, with 9 households², where the most expensive property was sold for £329k.
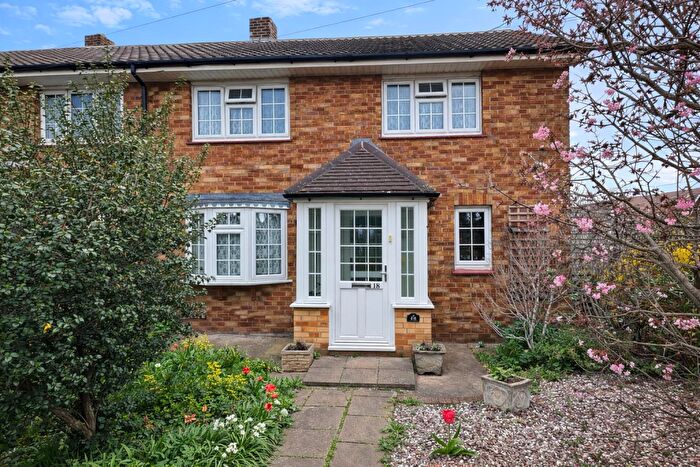
Properties for sale near RM18 8ET, Feenan Highway
![]()
If you are looking to sell your house, let it out, or receive a property valuation, an expert can help you.
Click the button below to get started.


Price Paid in Feenan Highway, RM18 8ET, Tilbury St Chads
69 Feenan Highway, RM18 8ET, Tilbury St Chads Tilbury
Property 69 has been sold 1 time. The last time it was sold was in 14/11/2024 and the sold price was £329,000.00.
This semi detached house, sold as a freehold on 14/11/2024, is a 102 sqm semi-detached house with an EPC rating of D.
| Date | Price | Property Type | Tenure | Classification |
|---|---|---|---|---|
| 14/11/2024 | £329,000.00 | Semi Detached House | freehold | Established Building |
71 Feenan Highway, RM18 8ET, Tilbury St Chads Tilbury
Property 71 has been sold 2 times. The last time it was sold was in 22/03/2021 and the sold price was £310,000.00.
This semi detached house, sold as a freehold on 22/03/2021, is a 135 sqm semi-detached house with an EPC rating of A.
| Date | Price | Property Type | Tenure | Classification |
|---|---|---|---|---|
| 22/03/2021 | £310,000.00 | Semi Detached House | freehold | Established Building |
| 20/04/2000 | £62,500.00 | Semi Detached House | freehold | Established Building |
63 Feenan Highway, RM18 8ET, Tilbury St Chads Tilbury
Property 63 has been sold 1 time. The last time it was sold was in 23/08/2013 and the sold price was £167,000.00.
This semi detached house, sold as a freehold on 23/08/2013, is a 99 sqm end-terrace house with an EPC rating of D.
| Date | Price | Property Type | Tenure | Classification |
|---|---|---|---|---|
| 23/08/2013 | £167,000.00 | Semi Detached House | freehold | Established Building |
Postcodes in Feenan Highway, Tilbury St Chads
Navigate through other locations in Feenan Highway, Tilbury St Chads, Tilbury to see more property listings for sale or to rent.
Transport near RM18 8ET, Feenan Highway
-
 Tilbury Town Station
 -
Gravesend Station
-
Grays Station
-
East Tilbury Station
-
Northfleet Station
-
Ebbsfleet International Station
-
Swanscombe Station
House price paid reports for RM18 8ET, Feenan Highway
Click on the buttons below to see price paid reports by year or property price:
- Price Paid By Year
- Property Type Price
Property Price Paid in RM18 8ET, Feenan Highway by Year
The average sold property price by year was:
| Year | Average Sold Price | Price Change |
Sold Properties
|
|---|---|---|---|
| 2024 | £329,000 | 6% |
1 Property |
| 2021 | £310,000 | 46% |
1 Property |
| 2013 | £167,000 | 63% |
1 Property |
| 2000 | £62,500 | - |
1 Property |
Property Price per Property Type in RM18 8ET, Feenan Highway
Here you can find historic sold price data in order to help with your property search.
The average Property Paid Price for specific property types in the last three years are:
| Property Type | Average Sold Price | Sold Properties |
|---|---|---|
| Semi Detached House | £329,000.00 | 1 Semi Detached House |