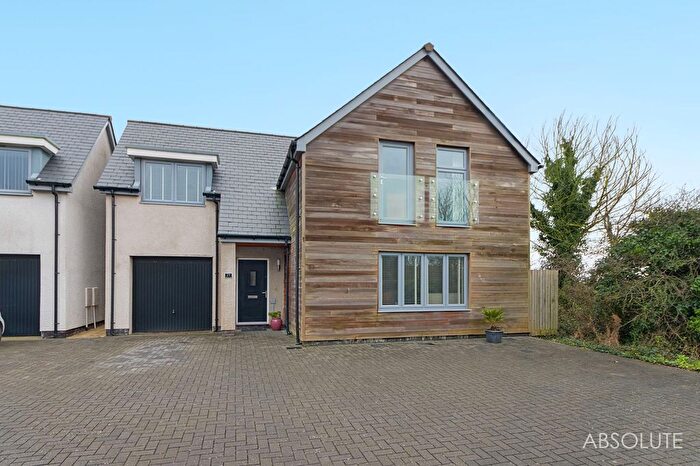
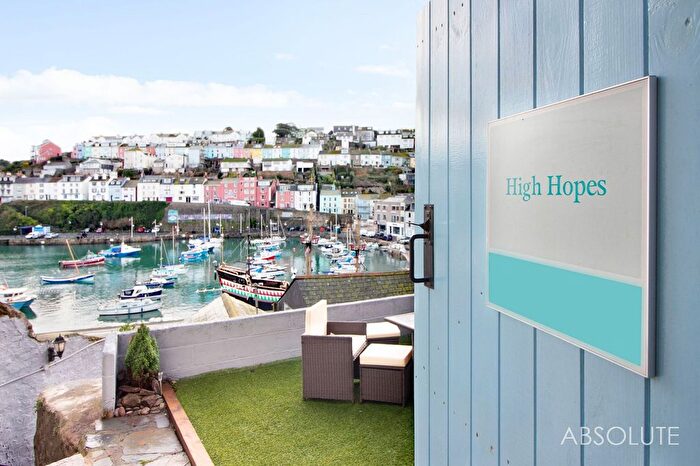
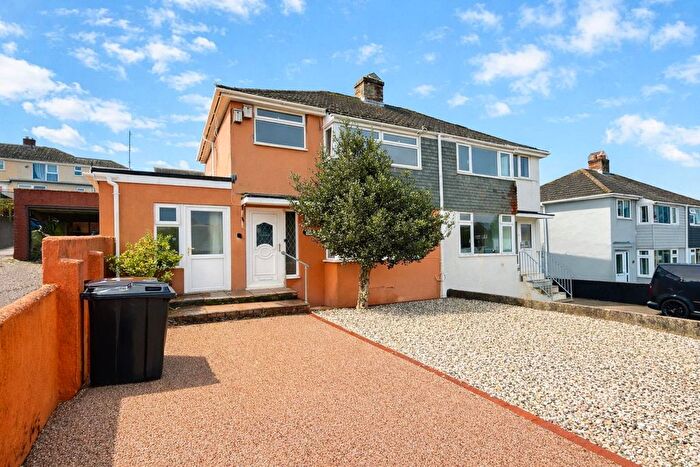
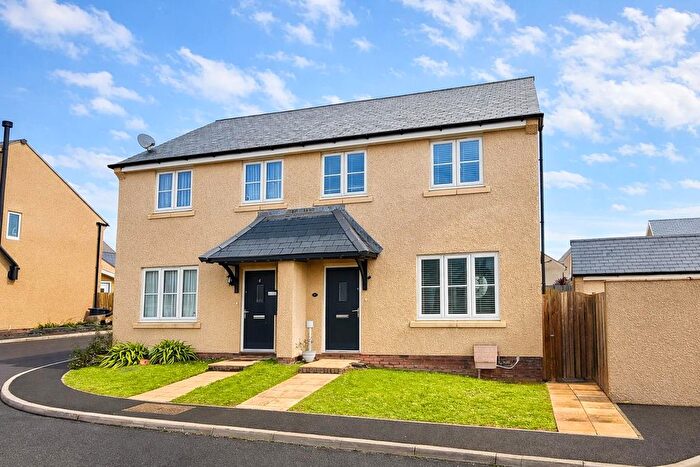
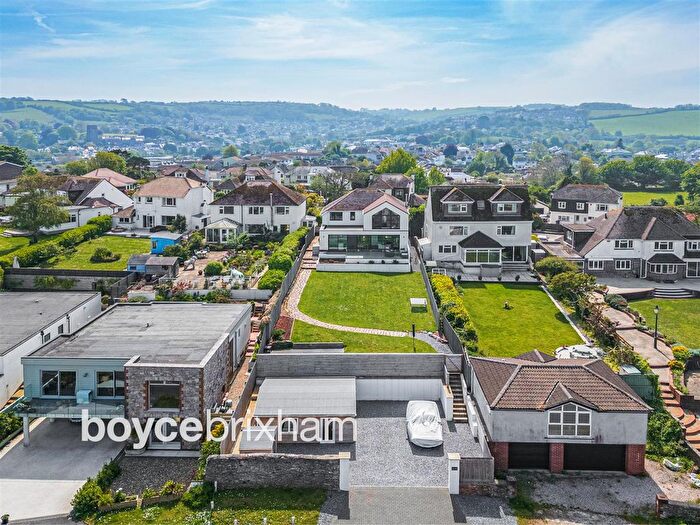
Houses for sale & to rent in St Peter's with St Mary's, Brixham
House Prices in St Peter's with St Mary's
Properties in St Peter's with St Mary's have an average house price of £394,905.00 and had 29 Property Transactions within the last 3 years¹.
St Peter's with St Mary's is an area in Brixham, Torbay with 105 households², where the most expensive property was sold for £725,000.00.
Properties for sale in St Peter's with St Mary's
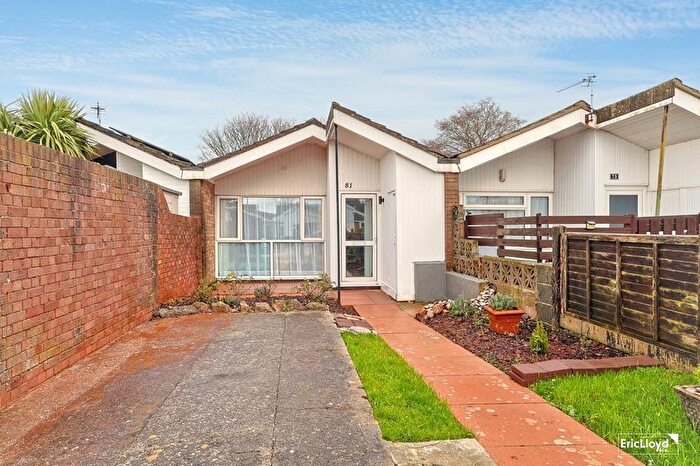
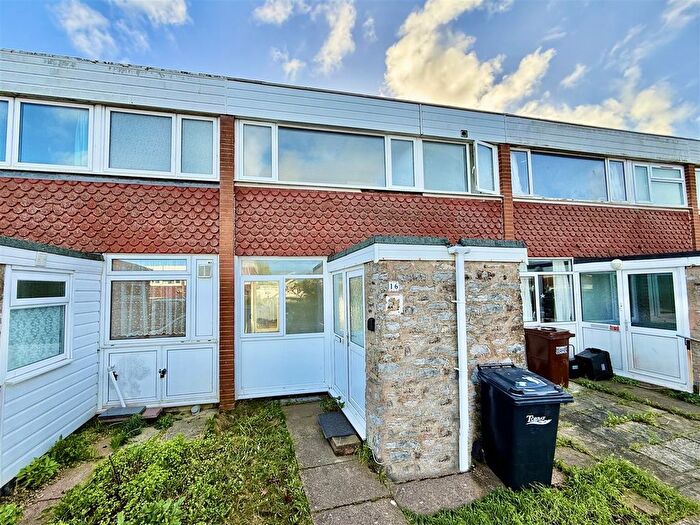
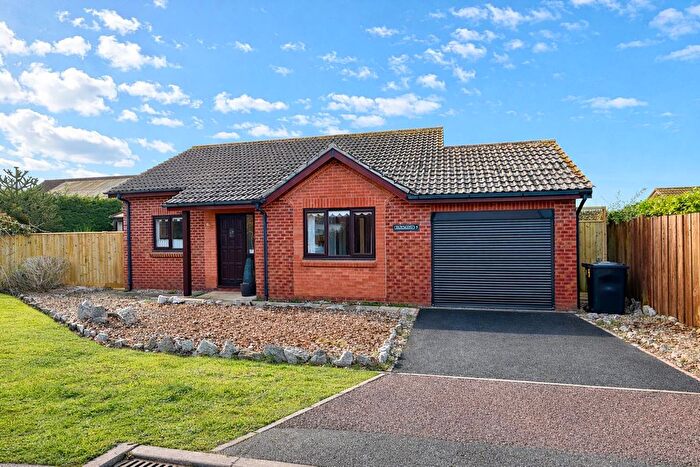
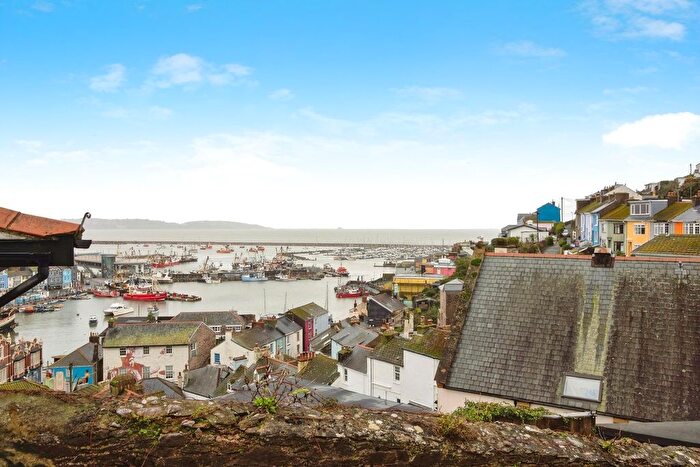
Previously listed properties in St Peter's with St Mary's
Roads and Postcodes in St Peter's with St Mary's
Navigate through our locations to find the location of your next house in St Peter's with St Mary's, Brixham for sale or to rent.
| Streets | Postcodes |
|---|---|
| Bakers Hill | TQ5 0BN |
| Bank Lane | TQ5 8EX |
| Bay View Steps | TQ5 9TN TQ5 9TX |
| Berry Head | TQ5 9AP TQ5 9AW |
| Berry Head Road | TQ5 9BW TQ5 9FT |
| Bolton Street | TQ5 9DG TQ5 9DT |
| Briseham Quarry | TQ5 9NY |
| Brixham Enterprise Estate | TQ5 9DF |
| Cavern Road | TQ5 9DQ |
| Centry Road | TQ5 9EZ |
| Ealing Close | TQ5 9RW |
| Elkins Hill | TQ5 9SU |
| Fore Street | TQ5 8AA TQ5 8AH TQ5 8DS TQ5 8EG TQ5 8JJ |
| Furze Lane | TQ5 8EE |
| Gillard Road | TQ5 9EW |
| Greenswood Road | TQ5 9HW |
| Heritage Way | TQ5 9FN |
| King Street | TQ5 9TF TQ5 9TJ |
| Kings Drive | TQ5 9FF |
| Kings Street | TQ5 9FW |
| Leader Close | TQ5 9FQ |
| Metherell Avenue Industrial Estate | TQ5 9QL |
| Mudstone Lane | TQ5 9EJ |
| Penn Meadows | TQ5 9PT |
| Pilgrim Close | TQ5 9FP |
| Provident Close | TQ5 9FS |
| Rea Barn Road | TQ5 9FG |
| Regard Close | TQ5 9FR |
| Sharkham Drive | TQ5 9FU |
| St Marys Road | TQ5 9QW |
| The Strand | TQ5 8EH |
| Union Lane | TQ5 8DY |
| Upton Manor Road | TQ5 9RG |
| Vicarage Road | TQ5 9RD |
| Vigilance Avenue | TQ5 9FL |
| TQ5 9UA |
Transport near St Peter's with St Mary's
- FAQ
- Price Paid By Year
- Property Type Price
Frequently asked questions about St Peter's with St Mary's
What is the average price for a property for sale in St Peter's with St Mary's?
The average price for a property for sale in St Peter's with St Mary's is £394,905. This amount is 20% higher than the average price in Brixham. There are 1,745 property listings for sale in St Peter's with St Mary's.
What streets have the most expensive properties for sale in St Peter's with St Mary's?
The streets with the most expensive properties for sale in St Peter's with St Mary's are Gillard Road at an average of £710,000, Heritage Way at an average of £517,142 and Vigilance Avenue at an average of £495,000.
What streets have the most affordable properties for sale in St Peter's with St Mary's?
The streets with the most affordable properties for sale in St Peter's with St Mary's are Fore Street at an average of £168,833, Regard Close at an average of £228,937 and Leader Close at an average of £260,000.
Which train stations are available in or near St Peter's with St Mary's?
Some of the train stations available in or near St Peter's with St Mary's are Paignton, Torquay and Torre.
Property Price Paid in St Peter's with St Mary's by Year
The average sold property price by year was:
| Year | Average Sold Price | Price Change |
Sold Properties
|
|---|---|---|---|
| 2025 | £412,857 | 17% |
7 Properties |
| 2024 | £344,480 | -32% |
13 Properties |
| 2023 | £453,777 | 18% |
9 Properties |
| 2022 | £372,326 | -2% |
13 Properties |
| 2021 | £380,231 | 19% |
19 Properties |
| 2020 | £306,464 | -9% |
7 Properties |
| 2019 | £334,592 | 8% |
50 Properties |
| 2018 | £306,572 | -4% |
56 Properties |
| 2017 | £318,449 | 11% |
62 Properties |
| 2016 | £282,529 | 13% |
24 Properties |
| 2015 | £246,250 | 78% |
2 Properties |
| 2013 | £55,000 | -696% |
2 Properties |
| 2009 | £438,000 | 5% |
1 Property |
| 2007 | £415,875 | 86% |
2 Properties |
| 2004 | £60,000 | -90% |
1 Property |
| 2003 | £113,750 | 58% |
2 Properties |
| 2002 | £47,840 | -139% |
2 Properties |
| 2000 | £114,362 | -46% |
4 Properties |
| 1999 | £167,000 | -17% |
1 Property |
| 1998 | £195,000 | 21% |
1 Property |
| 1997 | £155,000 | 70% |
1 Property |
| 1996 | £47,000 | - |
2 Properties |
Property Price per Property Type in St Peter's with St Mary's
Here you can find historic sold price data in order to help with your property search.
The average Property Paid Price for specific property types in the last three years are:
| Property Type | Average Sold Price | Sold Properties |
|---|---|---|
| Semi Detached House | £334,875.00 | 10 Semi Detached Houses |
| Detached House | £596,363.00 | 11 Detached Houses |
| Terraced House | £207,400.00 | 5 Terraced Houses |
| Flat | £168,833.00 | 3 Flats |

