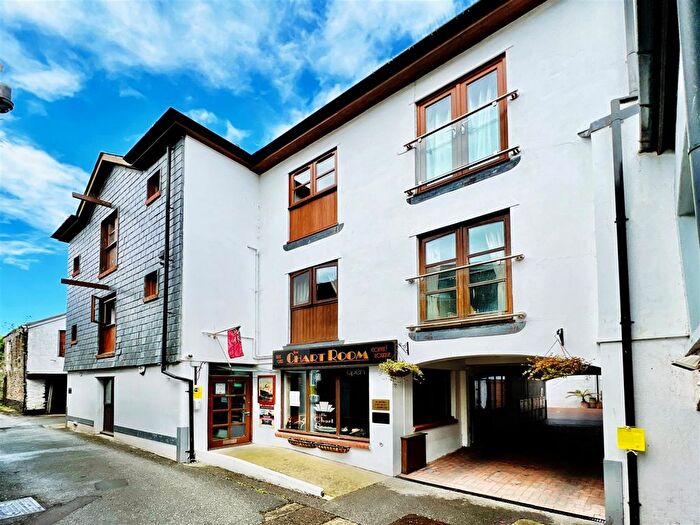
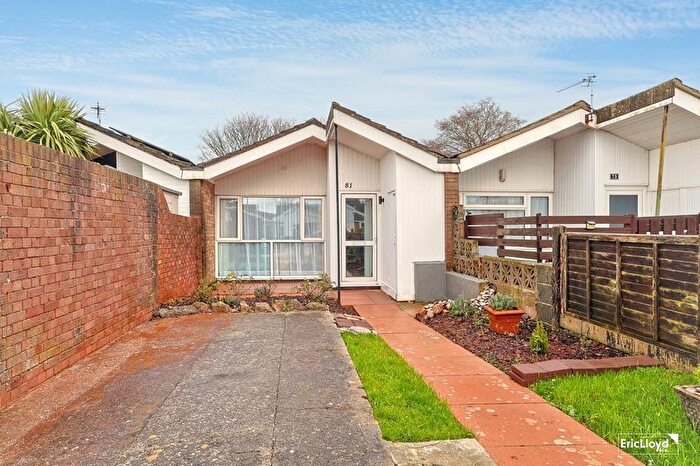
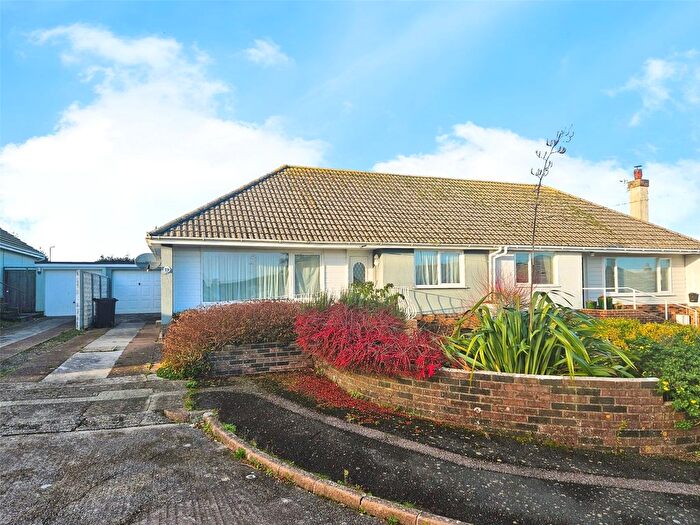
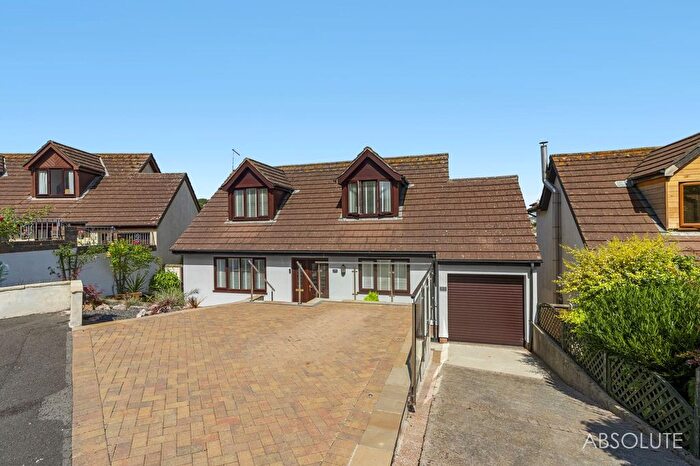
Houses for sale & to rent in St Marys-with-summercombe, Brixham
House Prices in St Marys-with-summercombe
Properties in St Marys-with-summercombe have an average house price of £287,862.00 and had 287 Property Transactions within the last 3 years¹.
St Marys-with-summercombe is an area in Brixham, Torbay with 3,182 households², where the most expensive property was sold for £750,000.00.
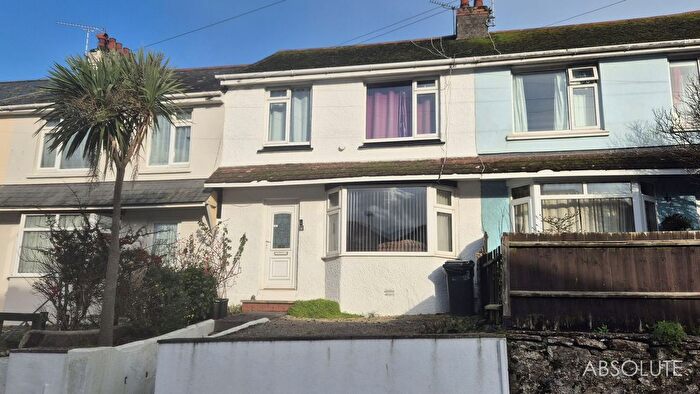
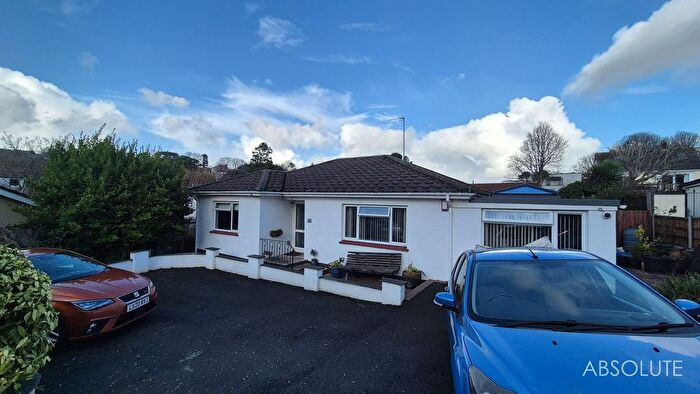
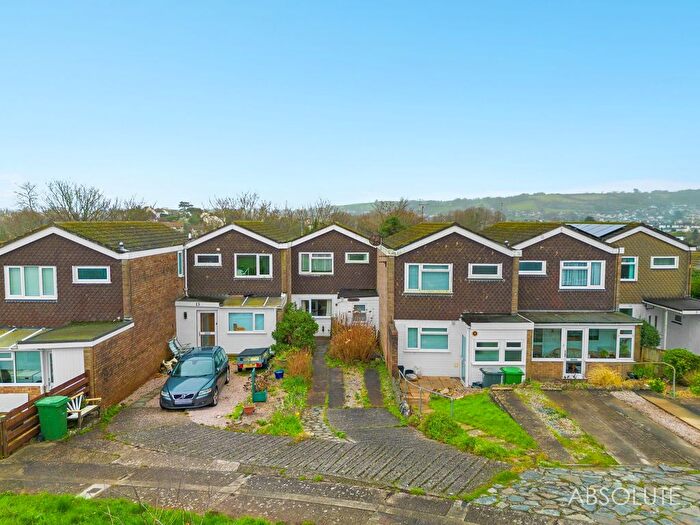
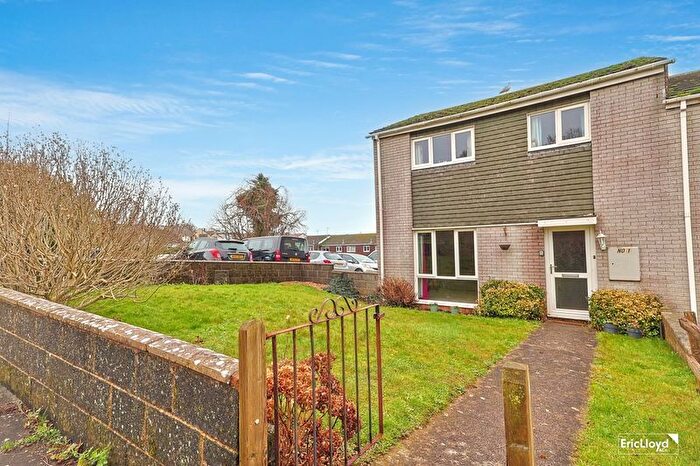
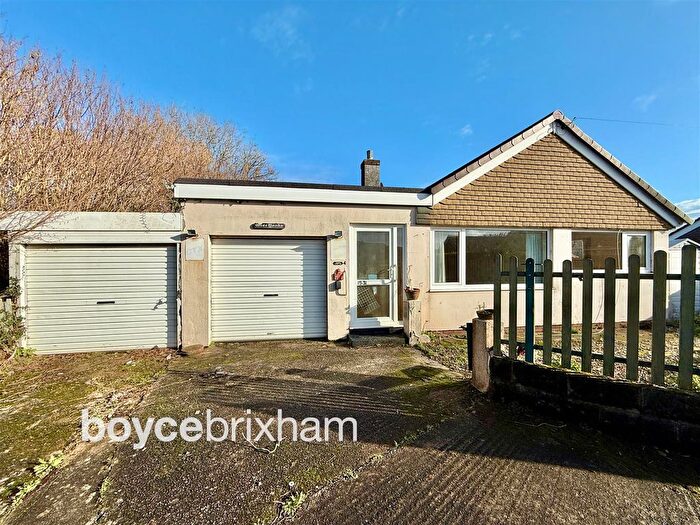
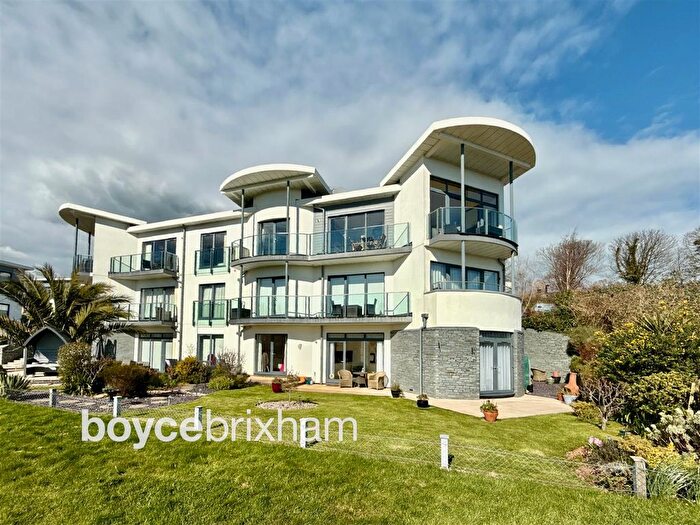
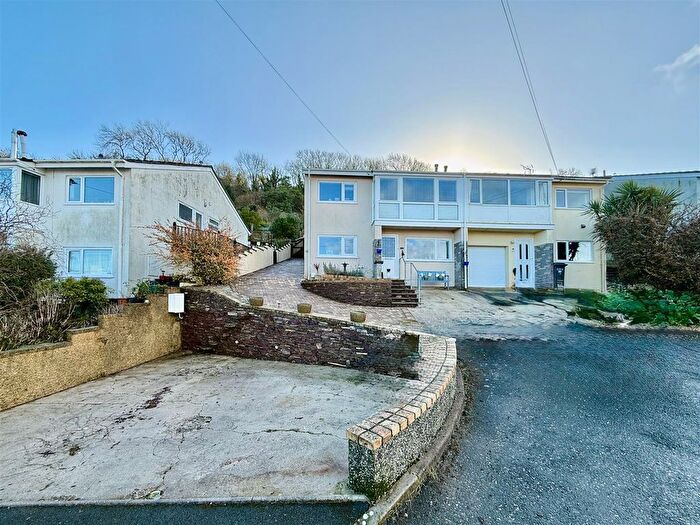
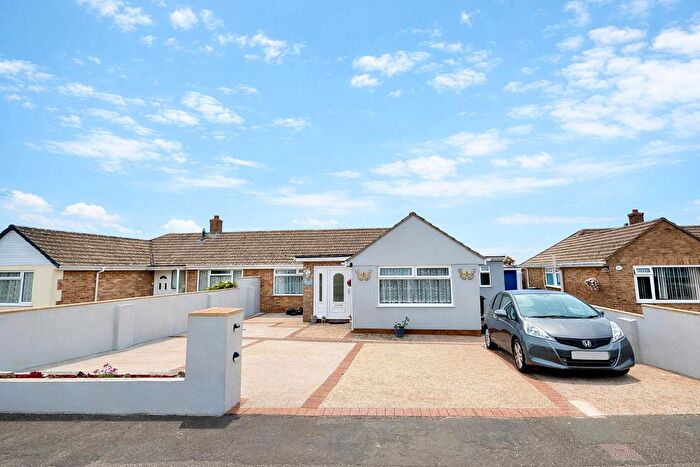
Properties for sale in St Marys-with-summercombe
Roads and Postcodes in St Marys-with-summercombe
Navigate through our locations to find the location of your next house in St Marys-with-summercombe, Brixham for sale or to rent.
| Streets | Postcodes |
|---|---|
| Bakers Hill | TQ5 0BS |
| Bala Brook Close | TQ5 0RQ |
| Barnfield Road | TQ5 9PP |
| Beverley Rise | TQ5 9NQ |
| Bolton Street | TQ5 9AD |
| Bon Air Close | TQ5 9PU |
| Bourne Court | TQ5 0RN |
| Brimlands | TQ5 9NG |
| Briseham Close | TQ5 9NT |
| Briseham Road | TQ5 9NS TQ5 9NX TQ5 9PE |
| Burton Place | TQ5 9JD |
| Burton Street | TQ5 9HT TQ5 9HZ TQ5 9JA TQ5 9LN |
| Burton Villa Close | TQ5 9JB |
| Castor Close | TQ5 9NU |
| Castor Road | TQ5 9PX TQ5 9PY TQ5 9QD TQ5 9QE |
| Cedar Way | TQ5 0DQ |
| Chestnut Drive | TQ5 0DB TQ5 0DD TQ5 0DE |
| Chiseldon Lane | TQ5 9QS |
| Clyst Avenue | TQ5 0RL |
| Coniston Close | TQ5 0RA |
| Cotmore Close | TQ5 0EF |
| Cross Park | TQ5 9LZ |
| Cudhill Road | TQ5 9JQ |
| Dashpers | TQ5 9LG TQ5 9LH TQ5 9LJ |
| Deep Dene Close | TQ5 0DZ |
| Doctors Road | TQ5 9HP TQ5 9HR |
| Downfield Close | TQ5 0RX |
| Drew Street | TQ5 9JU TQ5 9JY TQ5 9LA TQ5 9LB |
| Durleigh Road | TQ5 9JJ |
| Eden Close | TQ5 9LT |
| Eden Cottages | TQ5 9LP |
| Eden Park | TQ5 9LS |
| Edinburgh Road | TQ5 9PH |
| Elder Cottages | TQ5 9LQ |
| Elizabeth Avenue | TQ5 0AY |
| Elm Road | TQ5 0DH |
| Eveleigh Close | TQ5 9HS |
| Follafield Park | TQ5 0AD |
| Garrow Close | TQ5 9NN TQ5 9NW |
| Golden Close | TQ5 9QT |
| Gramercy Fields | TQ5 0AF |
| Greenbank Road | TQ5 9ND |
| Greenover Close | TQ5 9NF |
| Greenover Road | TQ5 9LX TQ5 9LY TQ5 9NA |
| Greenswood Road | TQ5 9HN |
| Hanover Close | TQ5 9RJ |
| Hartland Tor Close | TQ5 0RE |
| Higher Penn | TQ5 9PA |
| Holwell Road | TQ5 9NE |
| Home Close | TQ5 9JZ |
| Horsepool Street | TQ5 9LD TQ5 9LF |
| Huccaby Close | TQ5 0RJ |
| Knick Knack Lane | TQ5 9LR TQ5 9LW |
| Laywell Close | TQ5 0DN |
| Longcroft Avenue | TQ5 0DS |
| Longcroft Drive | TQ5 0EB |
| Maple Close | TQ5 0DX |
| Maple Road | TQ5 0DG |
| Marcent Row | TQ5 9GQ |
| Mathill Close | TQ5 0DR |
| Mathill Road | TQ5 0DP |
| Mayflower Drive | TQ5 9LU |
| Metherell Avenue | TQ5 9PZ TQ5 9QB |
| Milton Close | TQ5 9QY |
| Milton Crescent | TQ5 0BD |
| Milton Fields | TQ5 0BH |
| Milton Park | TQ5 0AT |
| Milton Street | TQ5 0AA TQ5 0AB TQ5 0AR TQ5 0AS TQ5 0AU TQ5 0AZ TQ5 0BP TQ5 0BX TQ5 0BZ TQ5 0EG |
| Monksbridge Road | TQ5 9NB |
| New Road | TQ5 8BZ TQ5 8DA TQ5 8DP |
| Nut Tree Orchard | TQ5 0AW |
| Ocean View Crescent | TQ5 0BE |
| Ocean View Drive | TQ5 0BA TQ5 0BB |
| Orchard Close | TQ5 9QA |
| Orchard Grove | TQ5 9RH |
| Packhall Lane | TQ5 0AX TQ5 0RZ |
| Park Avenue | TQ5 0DT |
| Peaseditch | TQ5 9PQ |
| Penn Lane | TQ5 9NP TQ5 9NR |
| Penn Meadows | TQ5 9PF TQ5 9PG TQ5 9PL TQ5 9PW |
| Penn Meadows Close | TQ5 9PS |
| Pensilva Park | TQ5 9RQ |
| Pine Close | TQ5 0DJ |
| Polhearne Lane | TQ5 9LE |
| Polhearne Way | TQ5 0EE |
| Poplar Close | TQ5 0SA |
| Queens Crescent | TQ5 9PJ |
| Quentin Avenue | TQ5 0AG |
| Rea Barn Road | TQ5 9DZ |
| Rippon Close | TQ5 0RH |
| Rowan Way | TQ5 0SB |
| Sellick Avenue | TQ5 9PN |
| Shapley Tor Close | TQ5 0RF |
| Sharkham Court | TQ5 9GR TQ5 9GS TQ5 9GT |
| Southdown Avenue | TQ5 0AN TQ5 0AP |
| Southdown Close | TQ5 0AQ |
| Southdown Hill | TQ5 0AE TQ5 0AH |
| Speedwell Close | TQ5 9NJ |
| Springdale Close | TQ5 9RL |
| St Marys Close | TQ5 9QU |
| St Marys Drive | TQ5 9FB TQ5 9FH TQ5 9FJ |
| St Marys Hill | TQ5 9FA TQ5 9FE TQ5 9GW TQ5 9GX TQ5 9GY TQ5 9GZ |
| St Marys Road | TQ5 9QF TQ5 9QG TQ5 9QH TQ5 9QQ |
| St Marys Square | TQ5 0BU |
| Stoneacre Close | TQ5 9RN |
| Summer Lane | TQ5 0DA TQ5 0DL |
| Summercourt Way | TQ5 0DY TQ5 0RB |
| Summerlands Close | TQ5 0EA TQ5 0SJ |
| Sycamore Way | TQ5 0DF |
| The Crescent | TQ5 9GU |
| The Drive | TQ5 9RA |
| Thrushel Close | TQ5 0RD |
| Upton Cottages | TQ5 0BT |
| Upton Hill Road | TQ5 9QR |
| Upton Manor Park | TQ5 9QP |
| Upton Manor Road | TQ5 9QX TQ5 9QZ TQ5 9RB TQ5 9RF |
| Vicarage Road | TQ5 9RE |
| Westfield Close | TQ5 0ED |
| Weston Close | TQ5 9JX |
| Wishings Road | TQ5 9PB TQ5 9PD |
| Yew Close | TQ5 0SE |
Transport near St Marys-with-summercombe
- FAQ
- Price Paid By Year
- Property Type Price
Frequently asked questions about St Marys-with-summercombe
What is the average price for a property for sale in St Marys-with-summercombe?
The average price for a property for sale in St Marys-with-summercombe is £287,862. This amount is 13% lower than the average price in Brixham. There are 1,872 property listings for sale in St Marys-with-summercombe.
What streets have the most expensive properties for sale in St Marys-with-summercombe?
The streets with the most expensive properties for sale in St Marys-with-summercombe are Gramercy Fields at an average of £617,500, Bala Brook Close at an average of £596,666 and Huccaby Close at an average of £595,000.
What streets have the most affordable properties for sale in St Marys-with-summercombe?
The streets with the most affordable properties for sale in St Marys-with-summercombe are Bolton Street at an average of £91,000, Ocean View Crescent at an average of £160,700 and New Road at an average of £169,875.
Which train stations are available in or near St Marys-with-summercombe?
Some of the train stations available in or near St Marys-with-summercombe are Paignton, Torquay and Torre.
Property Price Paid in St Marys-with-summercombe by Year
The average sold property price by year was:
| Year | Average Sold Price | Price Change |
Sold Properties
|
|---|---|---|---|
| 2025 | £298,103 | 10% |
93 Properties |
| 2024 | £268,998 | -13% |
117 Properties |
| 2023 | £304,157 | -5% |
77 Properties |
| 2022 | £319,758 | 9% |
139 Properties |
| 2021 | £290,192 | 16% |
183 Properties |
| 2020 | £244,250 | 10% |
119 Properties |
| 2019 | £220,175 | 5% |
148 Properties |
| 2018 | £209,586 | 4% |
128 Properties |
| 2017 | £201,479 | -2% |
173 Properties |
| 2016 | £204,708 | 7% |
176 Properties |
| 2015 | £190,987 | 2% |
178 Properties |
| 2014 | £186,871 | 0,2% |
174 Properties |
| 2013 | £186,487 | 7% |
129 Properties |
| 2012 | £173,194 | -4% |
138 Properties |
| 2011 | £179,707 | 4% |
98 Properties |
| 2010 | £171,721 | 4% |
116 Properties |
| 2009 | £164,455 | -6% |
116 Properties |
| 2008 | £173,847 | -13% |
89 Properties |
| 2007 | £196,293 | 11% |
183 Properties |
| 2006 | £174,641 | -3% |
190 Properties |
| 2005 | £179,149 | 7% |
176 Properties |
| 2004 | £166,359 | 19% |
199 Properties |
| 2003 | £135,535 | 19% |
236 Properties |
| 2002 | £109,861 | 18% |
226 Properties |
| 2001 | £89,878 | 10% |
200 Properties |
| 2000 | £81,159 | 14% |
197 Properties |
| 1999 | £69,553 | 12% |
215 Properties |
| 1998 | £61,073 | 3% |
173 Properties |
| 1997 | £58,993 | 2% |
168 Properties |
| 1996 | £57,984 | 9% |
168 Properties |
| 1995 | £53,037 | - |
123 Properties |
Property Price per Property Type in St Marys-with-summercombe
Here you can find historic sold price data in order to help with your property search.
The average Property Paid Price for specific property types in the last three years are:
| Property Type | Average Sold Price | Sold Properties |
|---|---|---|
| Flat | £141,500.00 | 35 Flats |
| Semi Detached House | £273,587.00 | 104 Semi Detached Houses |
| Detached House | £439,676.00 | 62 Detached Houses |
| Terraced House | £255,244.00 | 86 Terraced Houses |

