
Houses for sale in Paignton, Torbay
House Prices in Paignton
Properties in Paignton have an average house price of £268k and had 2,331 Property Transactions within the last 3 years.¹
Paignton is an area in Torbay with 22,717 households², where the most expensive property was sold for £1.7M.
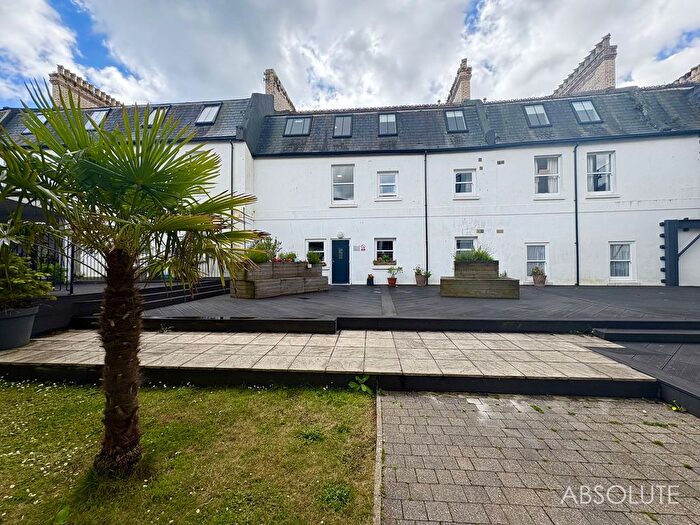
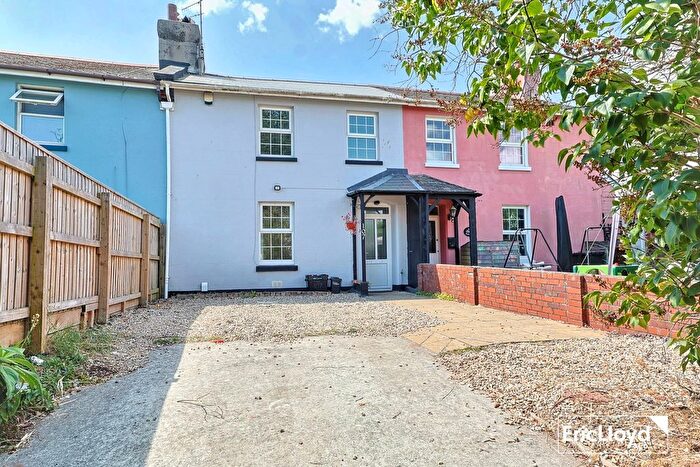
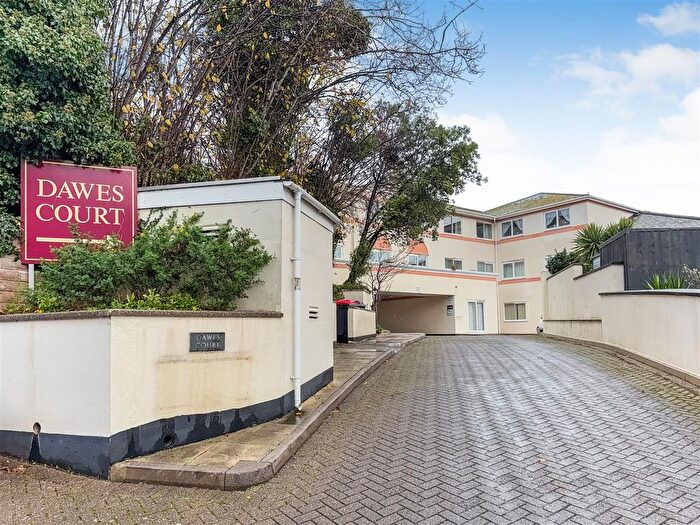
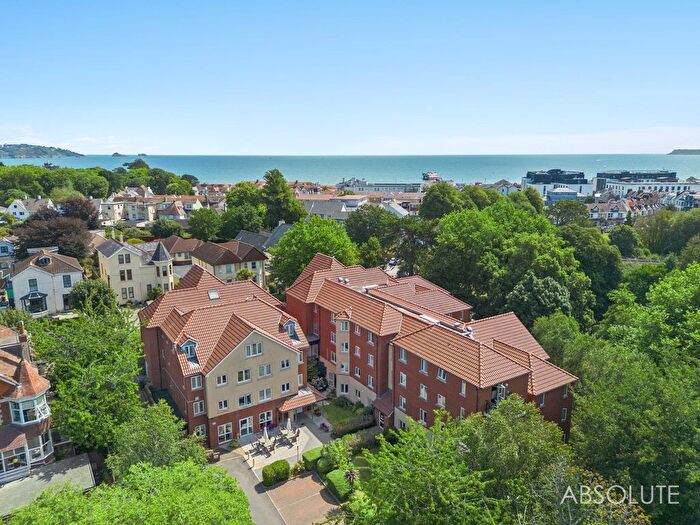
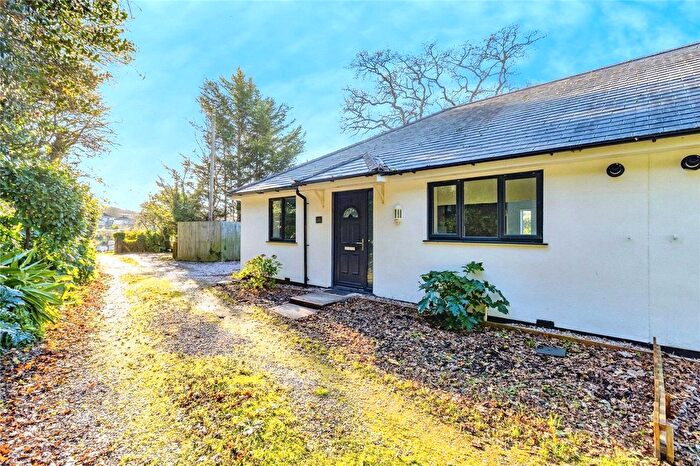
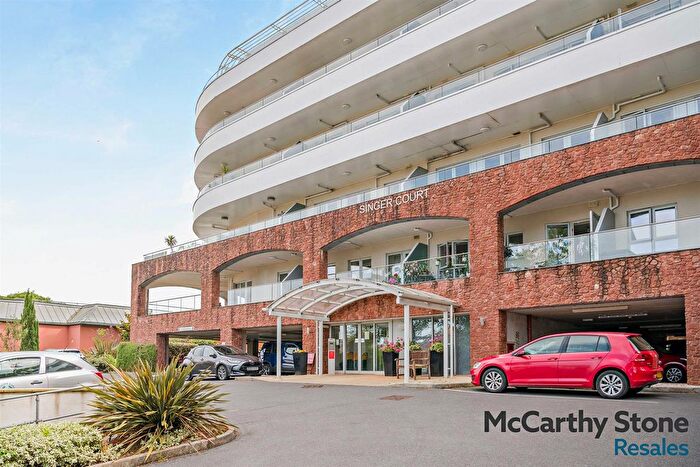
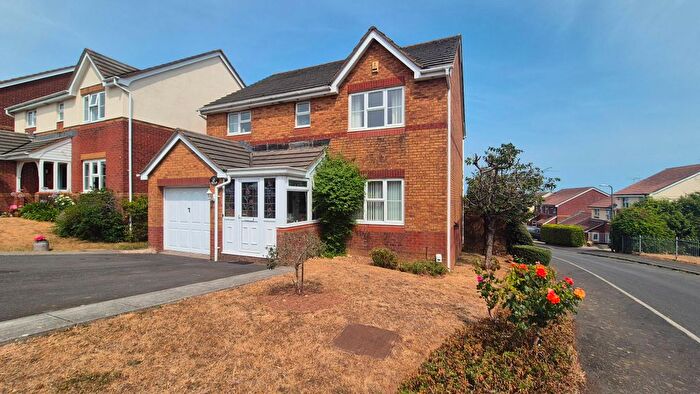
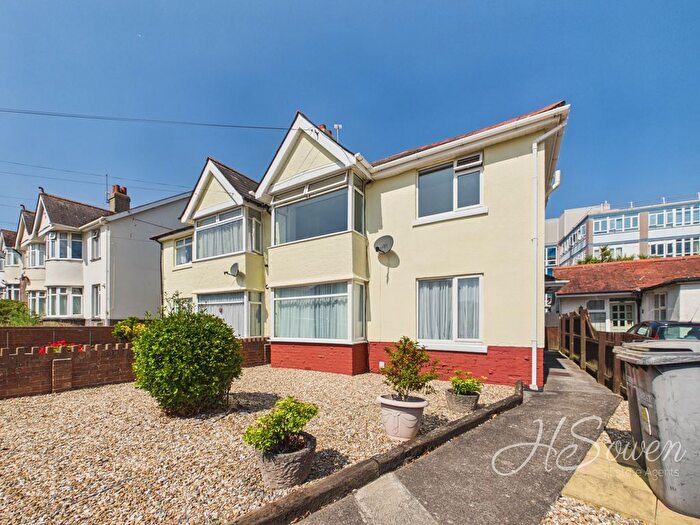
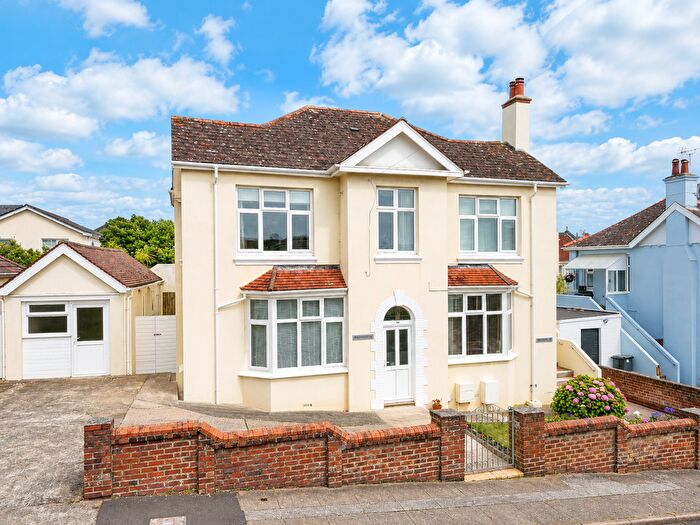
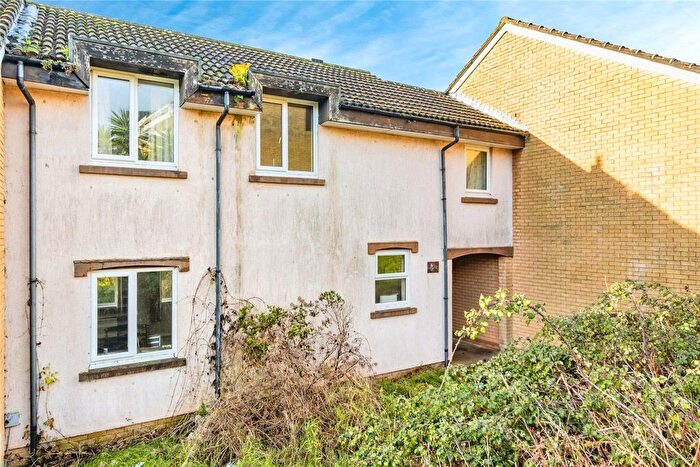
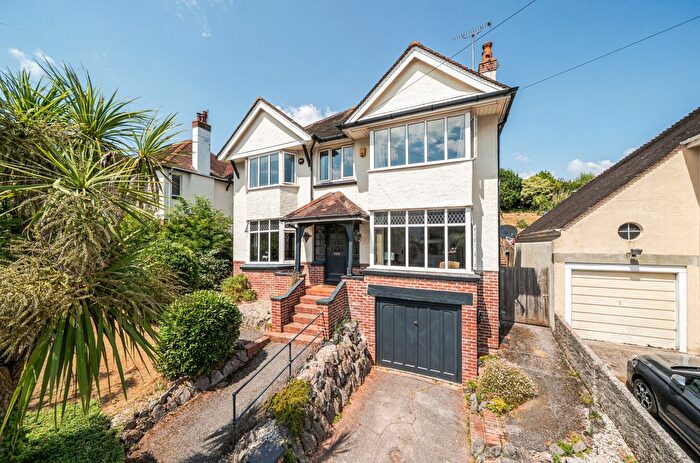
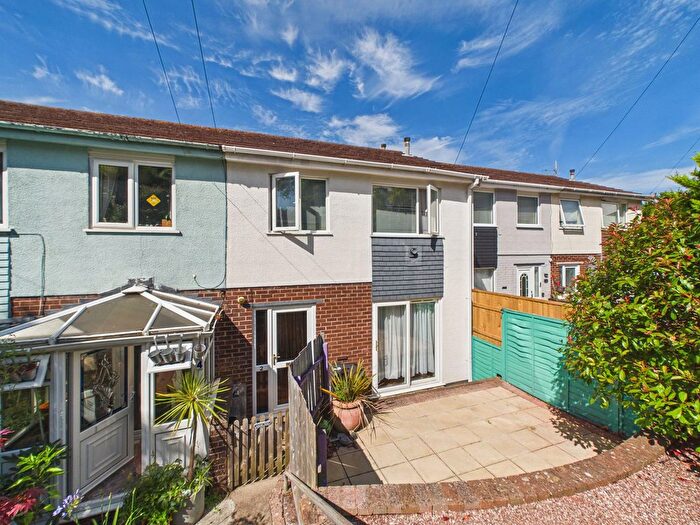
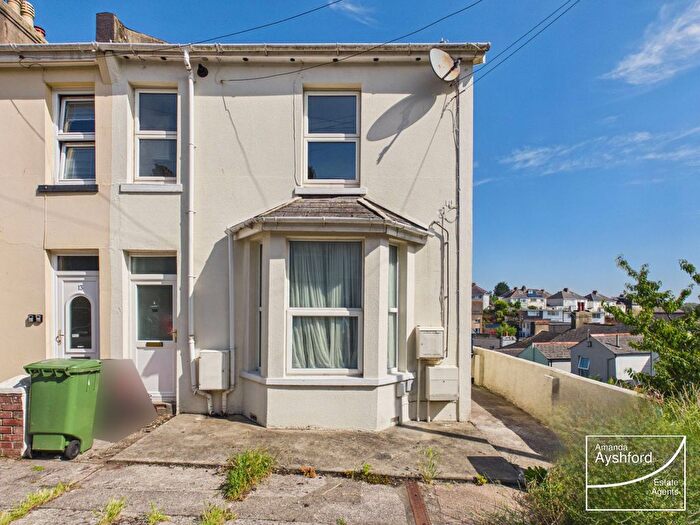
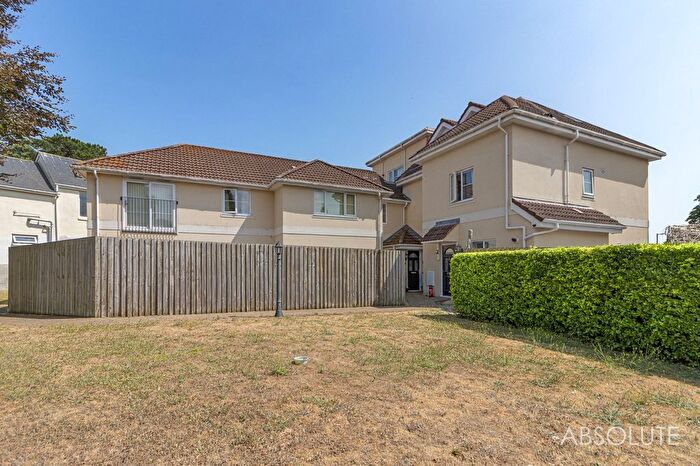
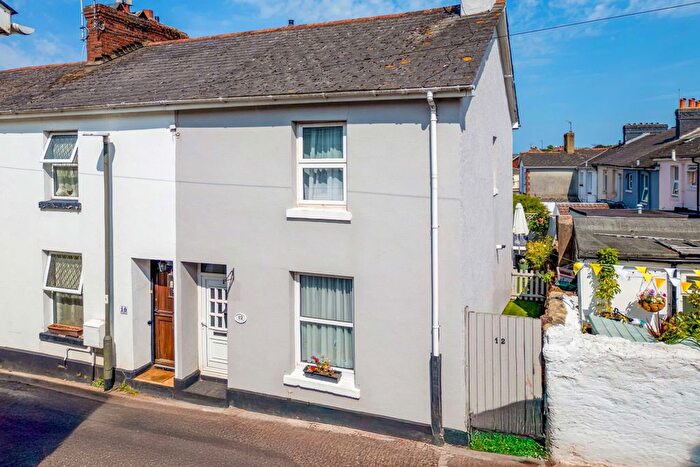
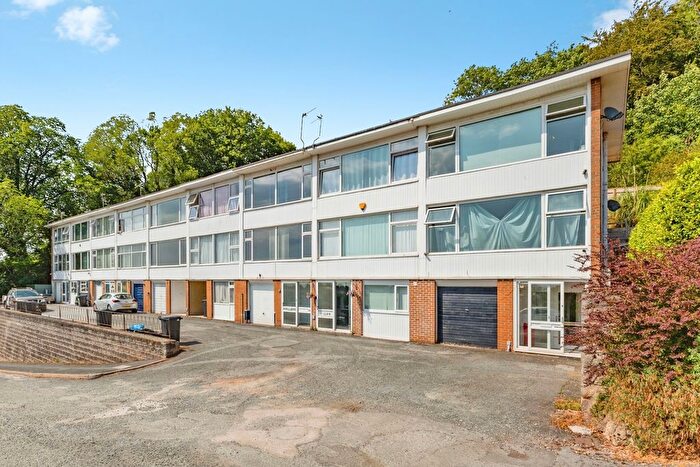
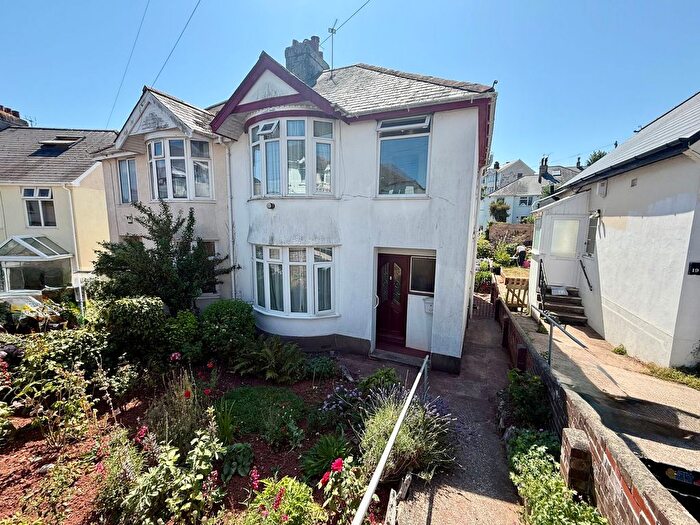
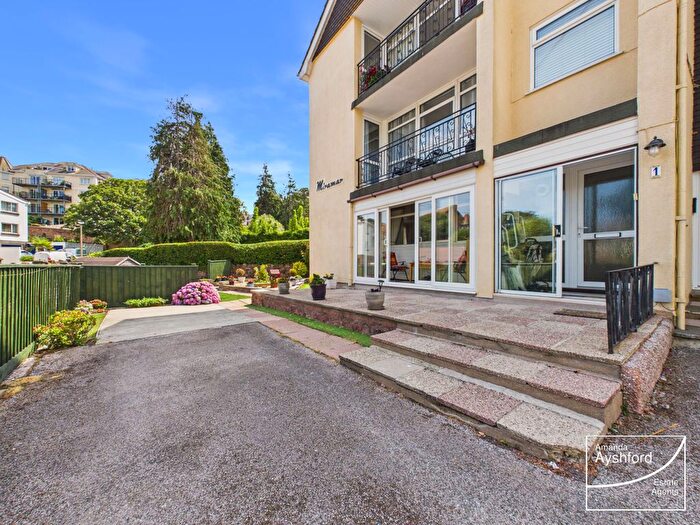
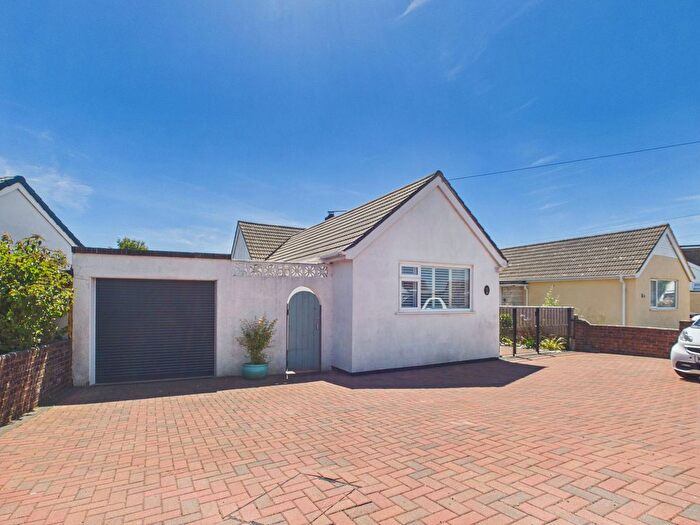
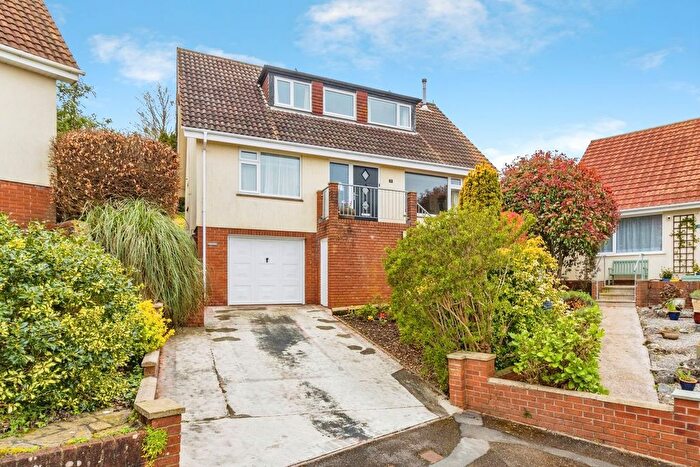
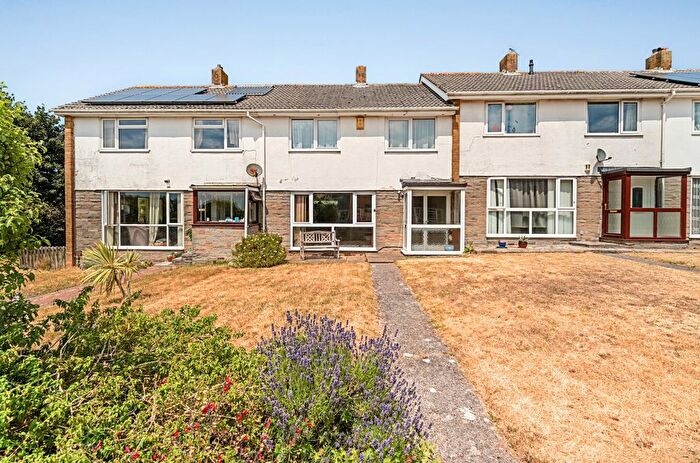
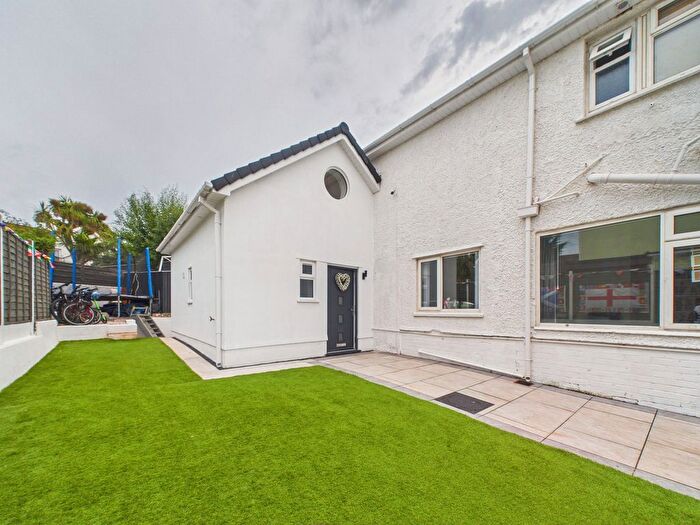
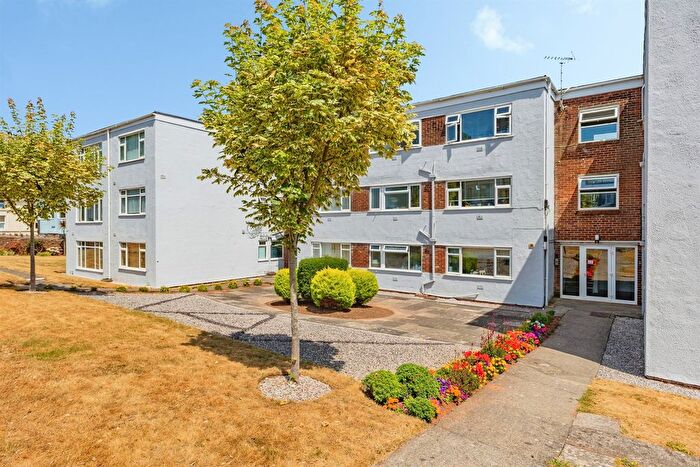
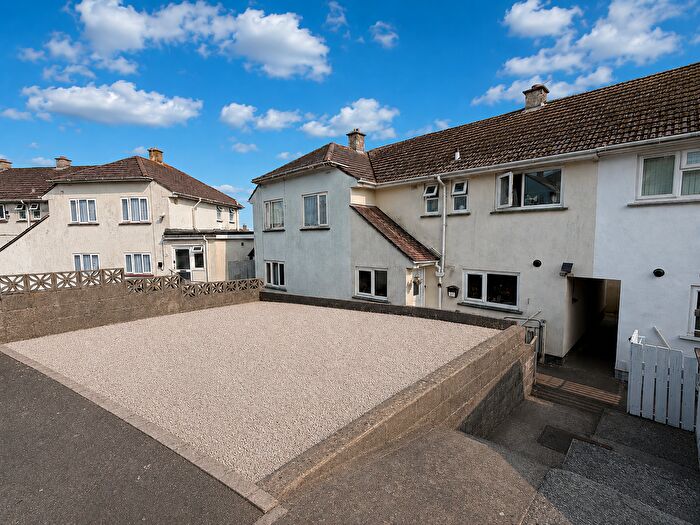
Properties for sale in Paignton
![]()
If you are looking to sell your house, let it out, or receive a property valuation, an expert can help you.
Click the button below to get started.
Neighbourhoods in Paignton
Navigate through our locations to find the location of your next house in Paignton, Torbay for sale or to rent.
Property price trends in Paignton
According to the latest Land Registry data, the average home in Paignton sold for £268,035 in 2026. That figure comes from a substantial record of 33,915 sales logged over the past 31 years.
Prices have held fairly steady over the last three years. Compared with 2023, when the typical sale came in around £268,768, values are broadly unchanged.
Looking back five years, average prices are up about 4.1% since 2021, a gain of around £10,659 in cash terms.
Zoom out to the past decade for the fuller picture. Back in 2016, homes here averaged £201,060, so the typical sold price has climbed about 33.3% since then, roughly 2.9% a year. Stretch the view to fifteen years and that annual pace holds at about 2.9%.
Frequently asked questions about Paignton
What is the average price for a property for sale in Paignton?
The average price for a property for sale in Paignton is £267,868. This amount is 3% lower than the average price in Torbay. There are 9,546 property listings for sale in Paignton.
What locations have the most expensive properties for sale in Paignton?
The locations with the most expensive properties for sale in Paignton are Churston-with-galmpton at an average of £359,549, Goodrington-with-roselands at an average of £283,154 and Preston at an average of £281,316.
What locations have the most affordable properties for sale in Paignton?
The locations with the most affordable properties for sale in Paignton are Roundham-with-hyde at an average of £198,697, King's Ash at an average of £218,000 and Blatchcombe at an average of £252,432.
Which train stations are available in or near Paignton?
Some of the train stations available in or near Paignton are Paignton, Torquay and Torre.
Property Price Paid in Paignton by Year
The average sold property price by year was:
| Year | Average Sold Price | Price Change |
Sold Properties
|
|---|---|---|---|
| 2026 | £268,035 | 1% |
76 Properties |
| 2025 | £266,150 | -1% |
760 Properties |
| 2024 | £268,703 | - |
805 Properties |
| 2023 | £268,768 | -3% |
690 Properties |
| 2022 | £276,903 | 7% |
924 Properties |
| 2021 | £257,376 | 15% |
1,201 Properties |
| 2020 | £219,570 | 5% |
831 Properties |
| 2019 | £208,587 | -1% |
1,015 Properties |
| 2018 | £211,156 | -1% |
1,045 Properties |
| 2017 | £212,346 | 5% |
1,235 Properties |
Property Price per Property Type in Paignton
Here you can find historic sold price data in order to help with your property search.
The average Property Paid Price for specific property types in the last three years are:
| Property Type | Average Sold Price | Sold Properties |
|---|---|---|
| Semi Detached House | £274,214.00 | 618 Semi Detached Houses |
| Terraced House | £223,635.00 | 570 Terraced Houses |
| Detached House | £401,865.00 | 607 Detached Houses |
| Flat | £155,845.00 | 536 Flats |
Transport in Paignton
Please see below transportation links in this area:
