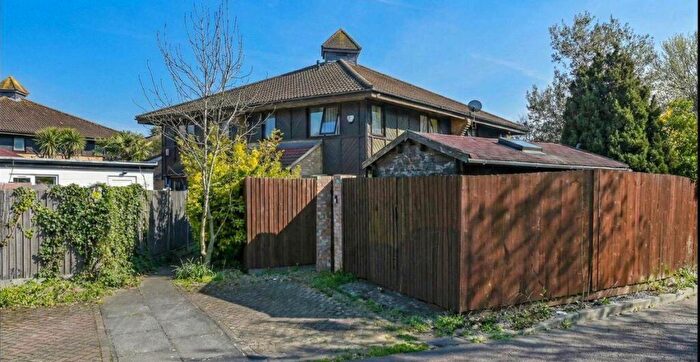
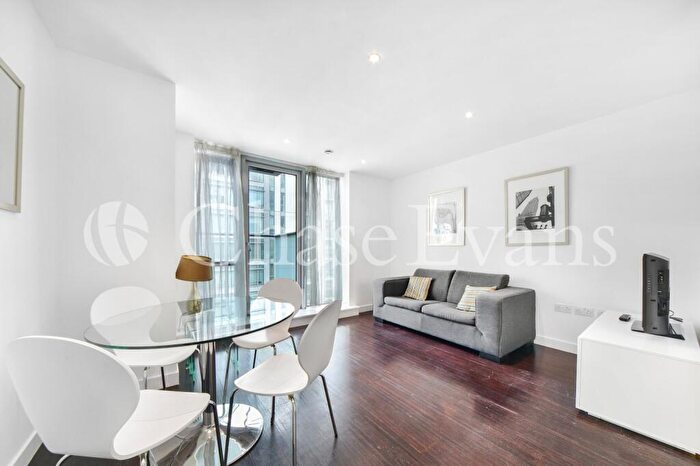
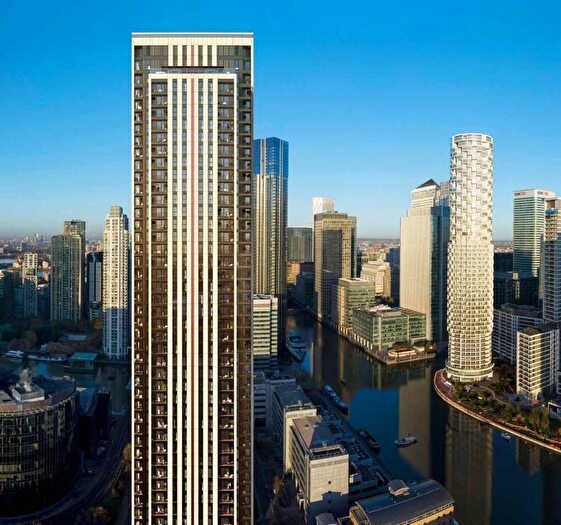
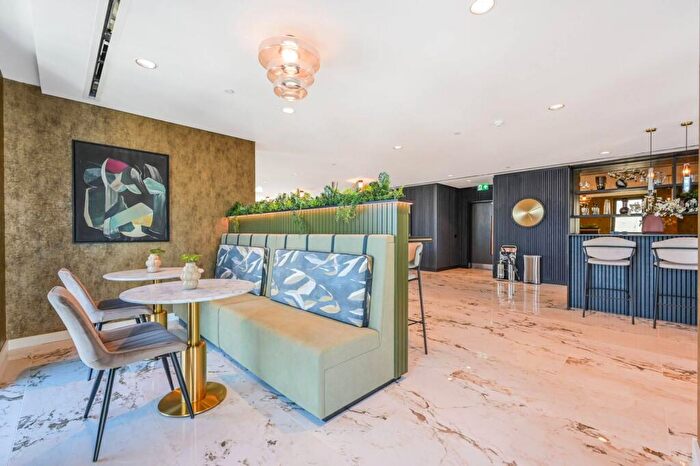
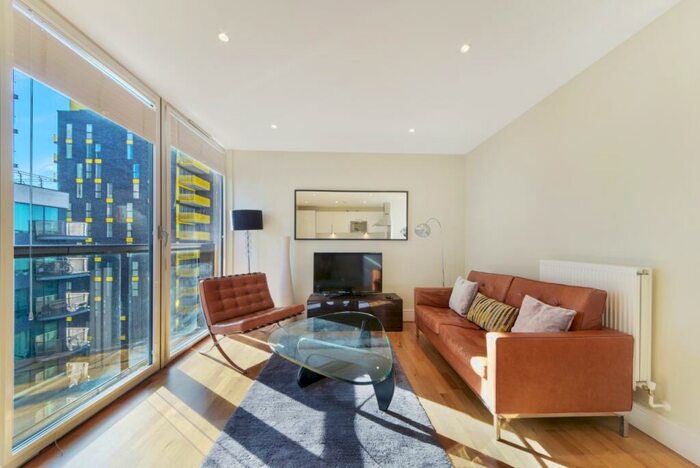
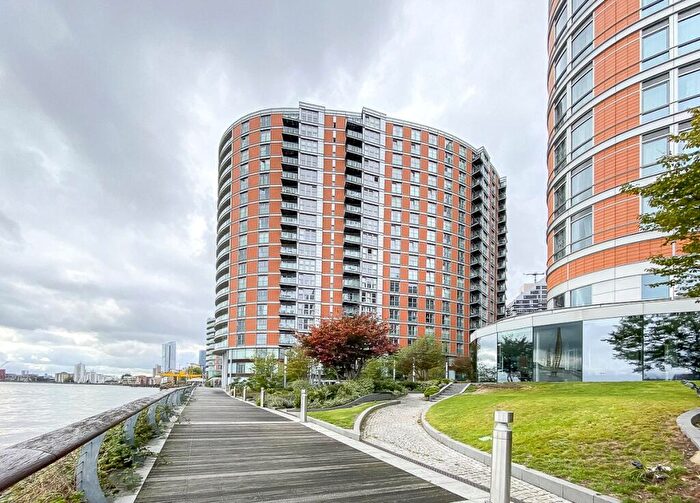
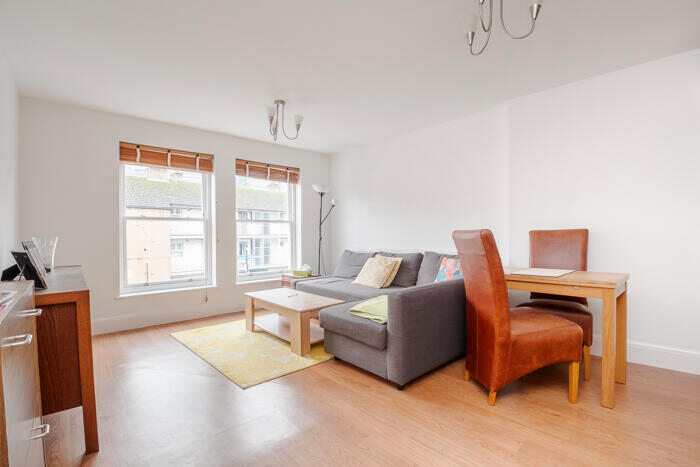
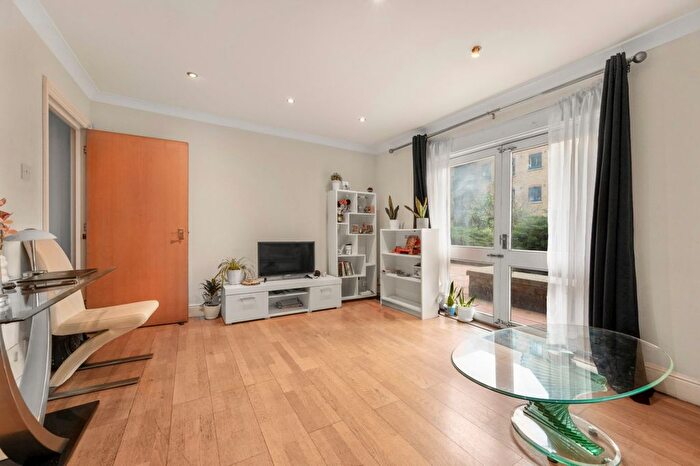
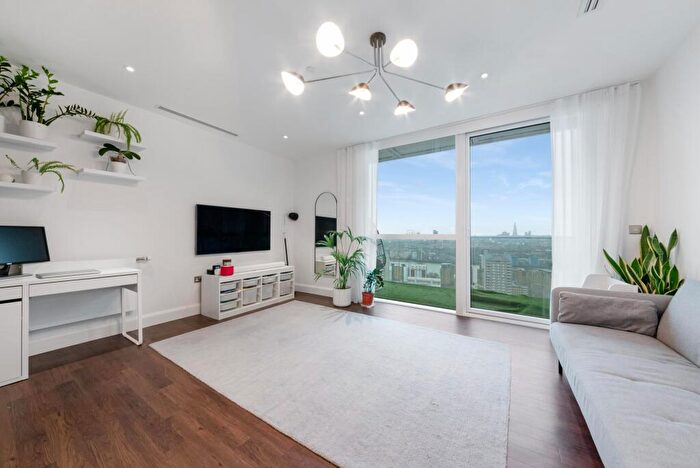
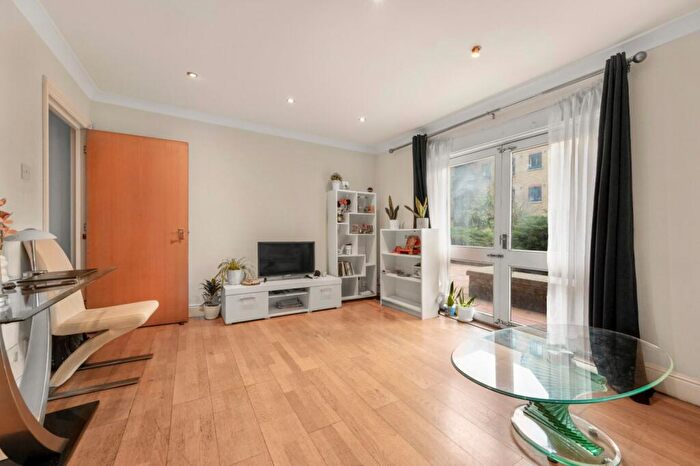
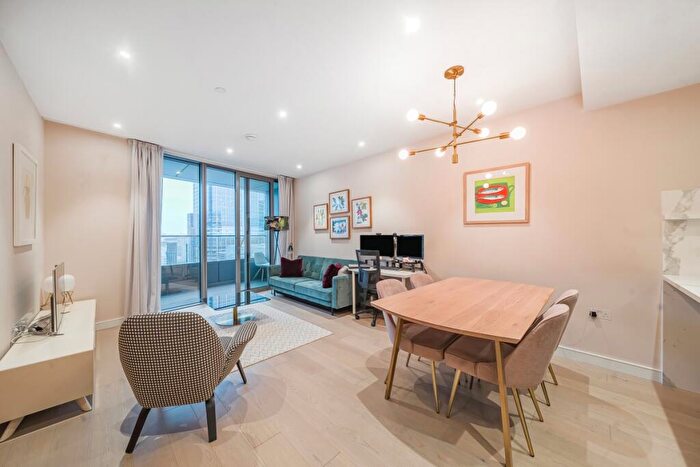
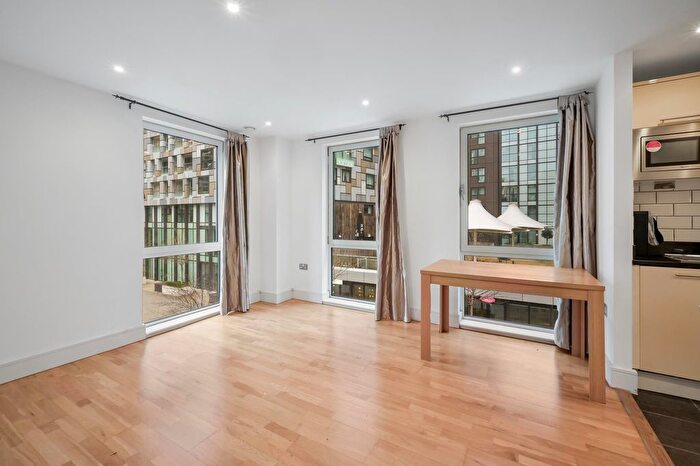
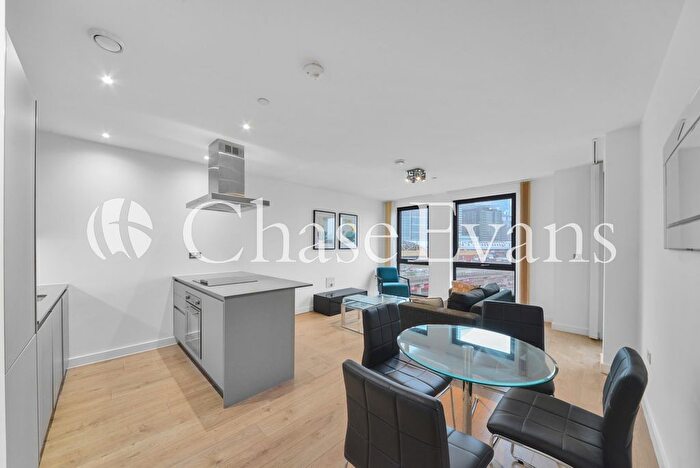
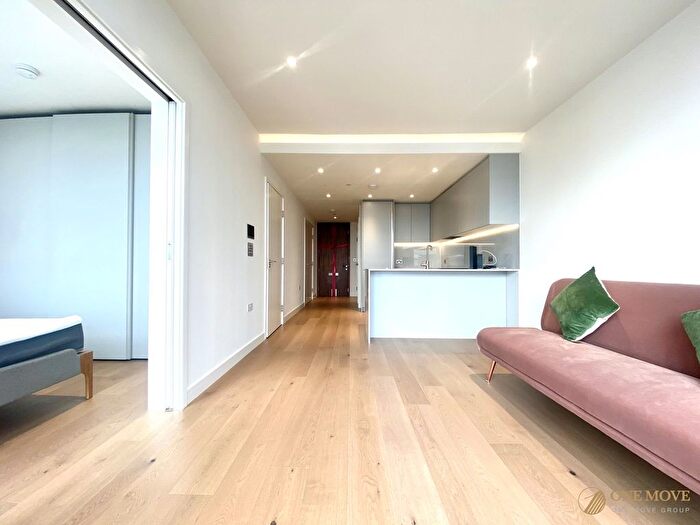
Houses for sale & to rent in Blackwall And Cubitt Town, London
House Prices in Blackwall And Cubitt Town
Properties in this part of Blackwall And Cubitt Town within London have an average house price of £480,512.00 and had 367 Property Transactions within the last 3 years¹. This area has 6,012 households² , where the most expensive property was sold for £1,360,000.00.
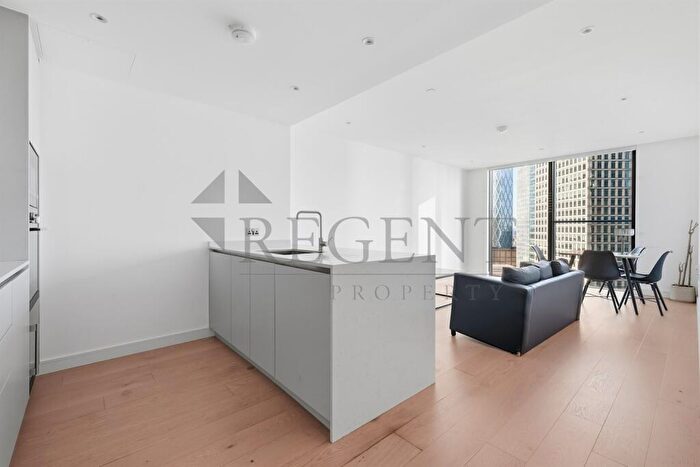
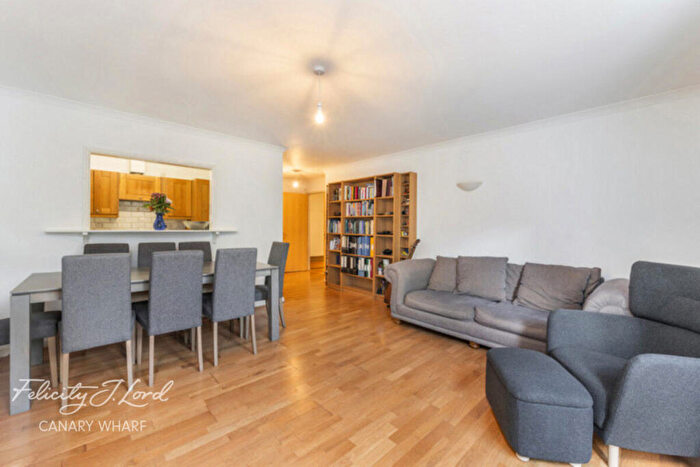
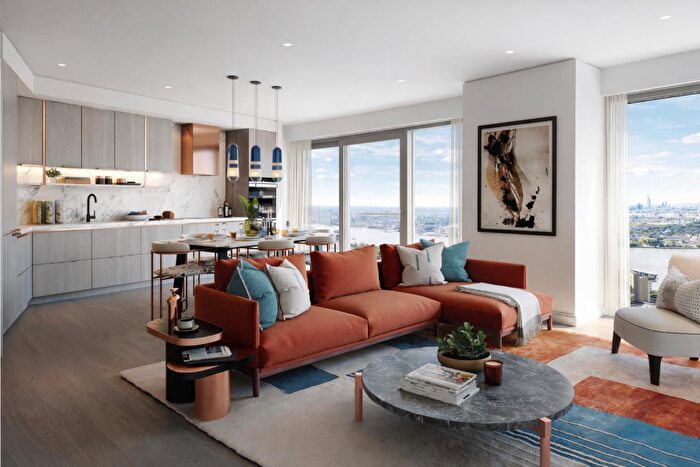
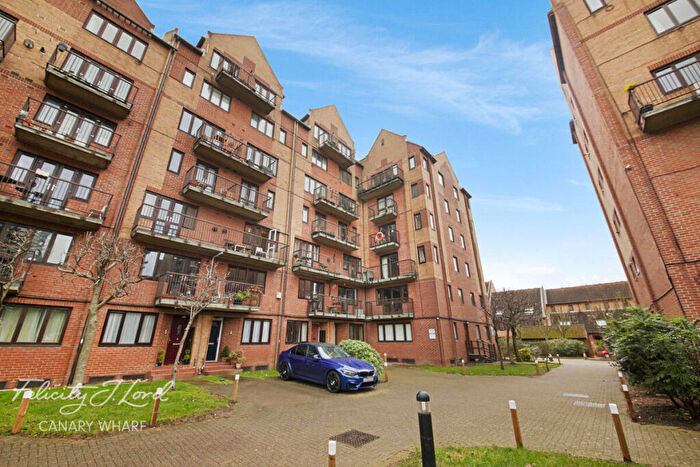
Properties for sale in Blackwall And Cubitt Town
Roads and Postcodes in Blackwall And Cubitt Town
Navigate through our locations to find the location of your next house in Blackwall And Cubitt Town, London for sale or to rent.
Transport near Blackwall And Cubitt Town
-
Crossharbour and London Arena Station
-
South Quay Station
-
North Greenwich Station
-
Blackwall Station
-
Canary Wharf Station
-
East India Station
-
Poplar Station
-
Heron Quays Station
-
Mudchute Station
-
West India Quay Station
- FAQ
- Price Paid By Year
- Property Type Price
Frequently asked questions about Blackwall And Cubitt Town
What is the average price for a property for sale in Blackwall And Cubitt Town?
The average price for a property for sale in Blackwall And Cubitt Town is £480,512. This amount is 8% lower than the average price in London. There are 8,067 property listings for sale in Blackwall And Cubitt Town.
What streets have the most expensive properties for sale in Blackwall And Cubitt Town?
The streets with the most expensive properties for sale in Blackwall And Cubitt Town are Mariners Mews at an average of £1,145,000, Sextant Avenue at an average of £975,000 and Isambard Mews at an average of £886,000.
What streets have the most affordable properties for sale in Blackwall And Cubitt Town?
The streets with the most affordable properties for sale in Blackwall And Cubitt Town are Glengall Grove at an average of £311,800, Launch Street at an average of £315,000 and Blackwall Way at an average of £342,339.
Which tube stations are available in or near Blackwall And Cubitt Town?
Some of the tube stations available in or near Blackwall And Cubitt Town are North Greenwich and Canary Wharf.
Property Price Paid in Blackwall And Cubitt Town by Year
The average sold property price by year was:
| Year | Average Sold Price | Price Change |
Sold Properties
|
|---|---|---|---|
| 2025 | £452,005 | -12% |
97 Properties |
| 2024 | £504,009 | 5% |
128 Properties |
| 2023 | £478,804 | -8% |
142 Properties |
| 2022 | £515,754 | 5% |
120 Properties |
| 2021 | £491,073 | -2% |
167 Properties |
| 2020 | £502,013 | 2% |
124 Properties |
| 2019 | £491,759 | 0,2% |
121 Properties |
| 2018 | £490,662 | -1% |
200 Properties |
| 2017 | £497,549 | -4% |
179 Properties |
| 2016 | £519,374 | 8% |
225 Properties |
| 2015 | £479,104 | 12% |
332 Properties |
| 2014 | £421,779 | 6% |
437 Properties |
| 2013 | £398,129 | 1% |
366 Properties |
| 2012 | £392,585 | 5% |
420 Properties |
| 2011 | £374,414 | 9% |
367 Properties |
| 2010 | £339,727 | 6% |
268 Properties |
| 2009 | £320,600 | -9% |
112 Properties |
| 2008 | £348,981 | -2% |
450 Properties |
| 2007 | £355,387 | 16% |
814 Properties |
| 2006 | £296,829 | -9% |
352 Properties |
| 2005 | £324,383 | 6% |
380 Properties |
| 2004 | £304,846 | 5% |
724 Properties |
| 2003 | £290,720 | 17% |
480 Properties |
| 2002 | £240,682 | 5% |
492 Properties |
| 2001 | £229,449 | 13% |
509 Properties |
| 2000 | £200,353 | 11% |
575 Properties |
| 1999 | £179,108 | 25% |
709 Properties |
| 1998 | £134,581 | 18% |
495 Properties |
| 1997 | £110,259 | 19% |
229 Properties |
| 1996 | £89,778 | 19% |
104 Properties |
| 1995 | £72,877 | - |
115 Properties |
Property Price per Property Type in Blackwall And Cubitt Town
Here you can find historic sold price data in order to help with your property search.
The average Property Paid Price for specific property types in the last three years are:
| Property Type | Average Sold Price | Sold Properties |
|---|---|---|
| Flat | £452,989.00 | 336 Flats |
| Terraced House | £722,300.00 | 25 Terraced Houses |
| Semi Detached House | £991,200.00 | 5 Semi Detached Houses |
| Detached House | £1,130,000.00 | 1 Detached House |

