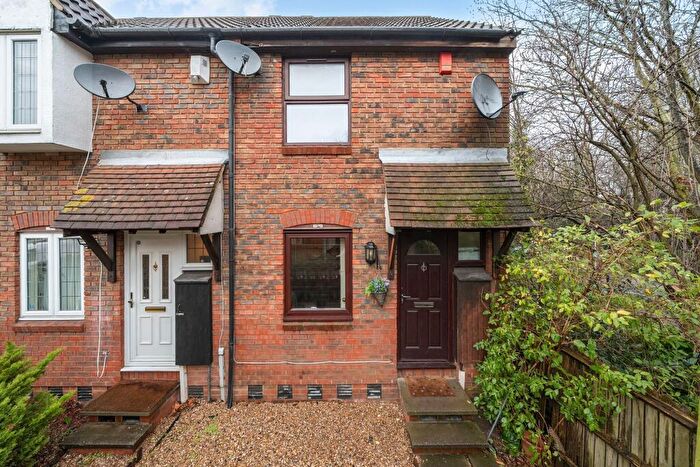
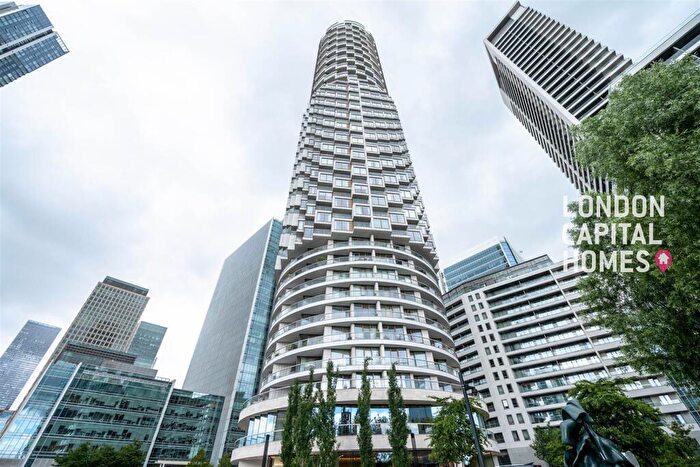
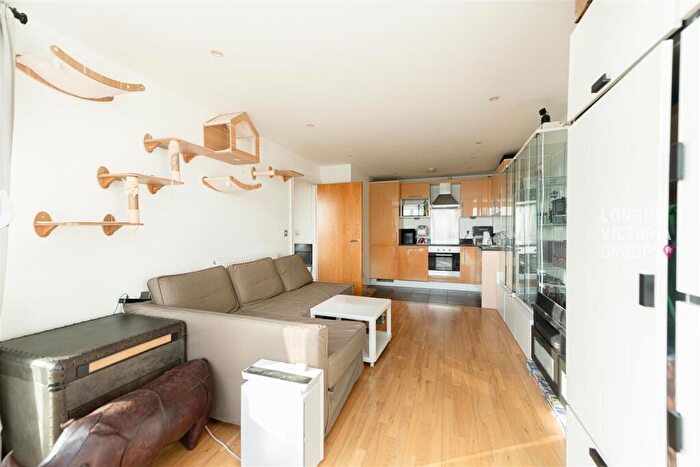
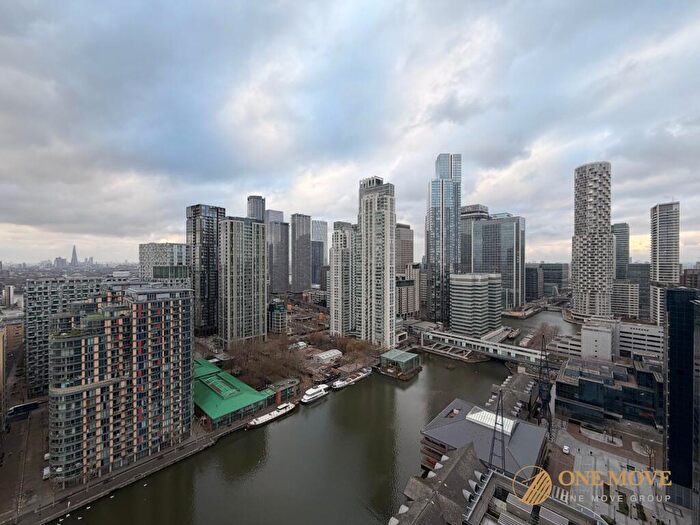
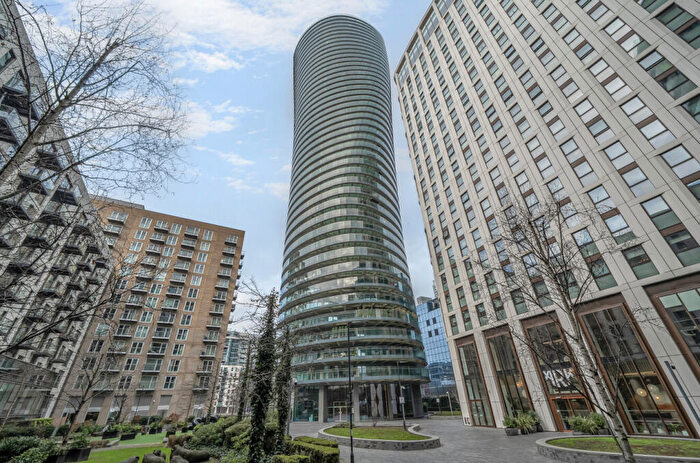
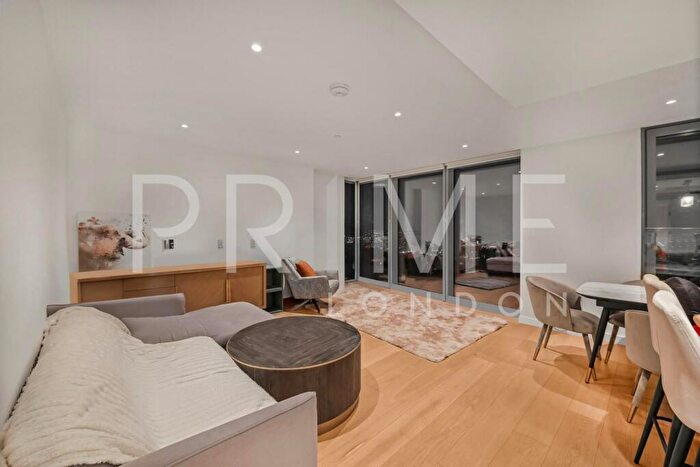
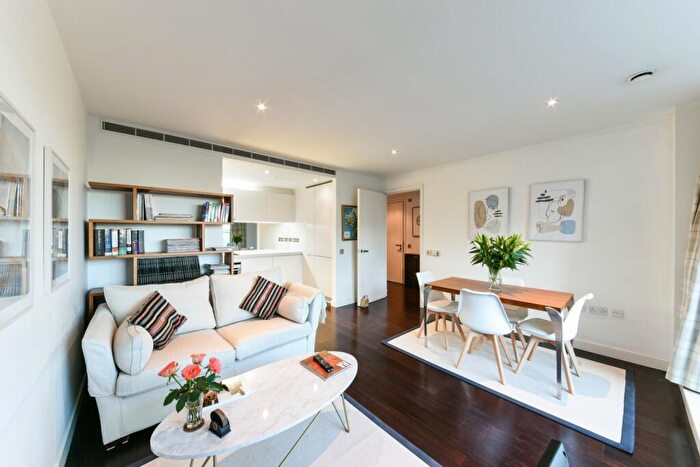
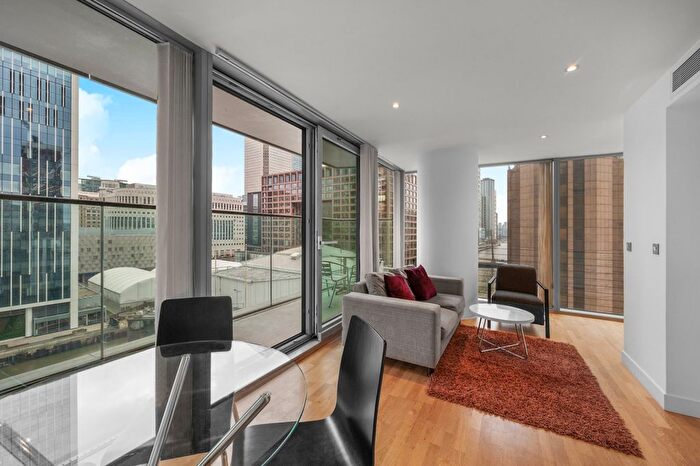
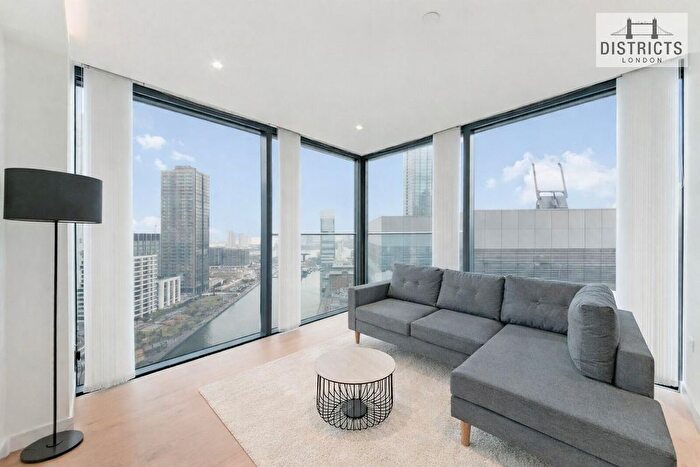
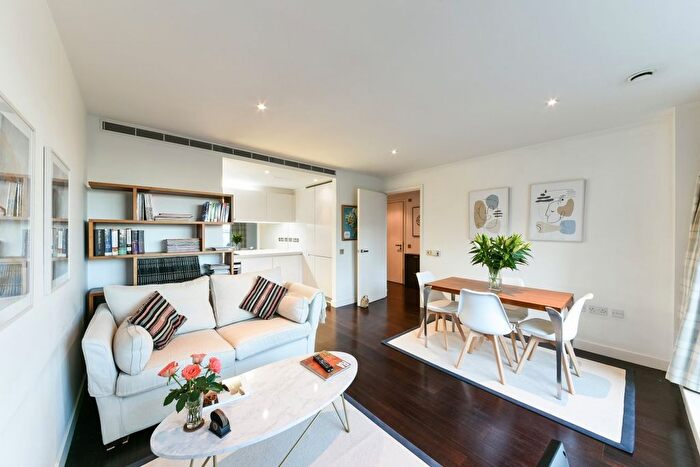
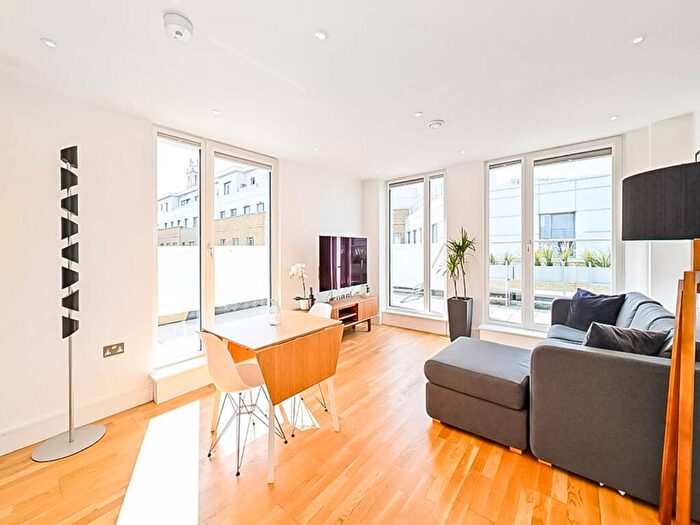
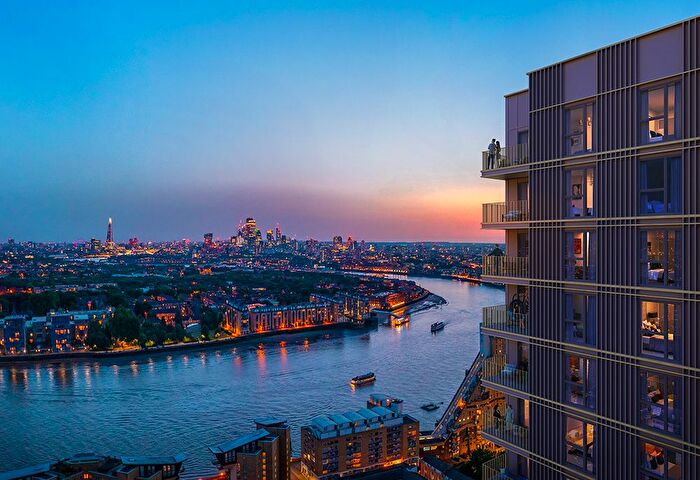
Houses for sale & to rent in Canary Wharf, London
House Prices in Canary Wharf
Properties in this part of Canary Wharf within London have an average house price of £516,750.00 and had 496 Property Transactions within the last 3 years¹. This area has 6,288 households² , where the most expensive property was sold for £2,200,000.00.
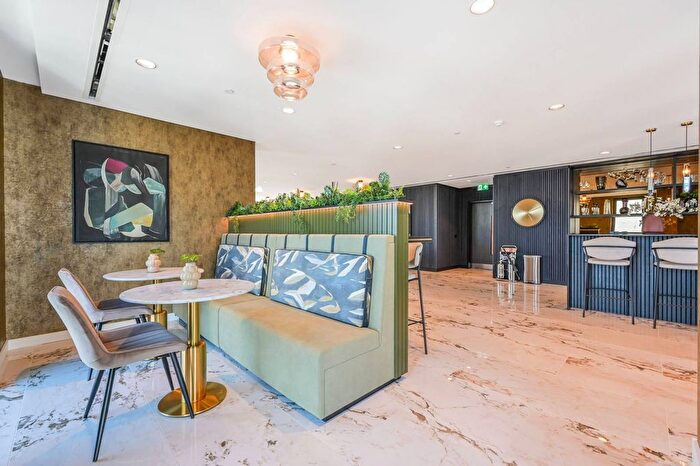
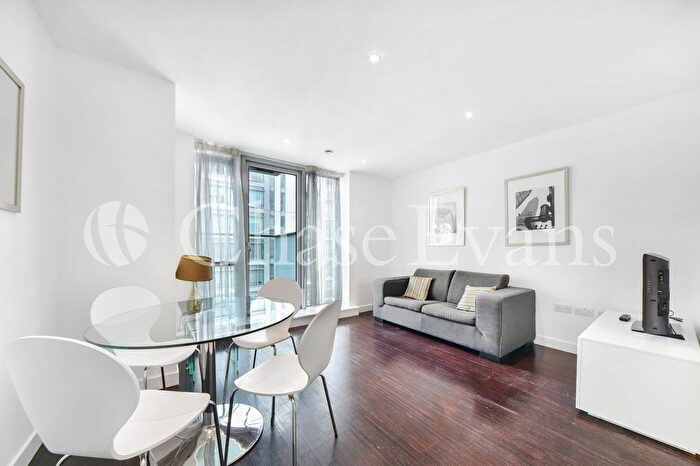
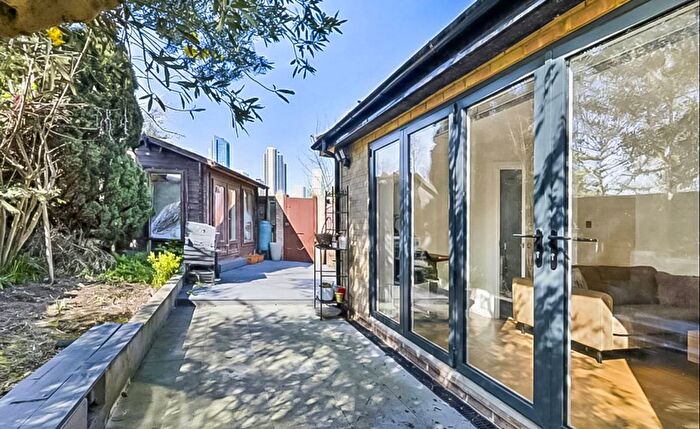
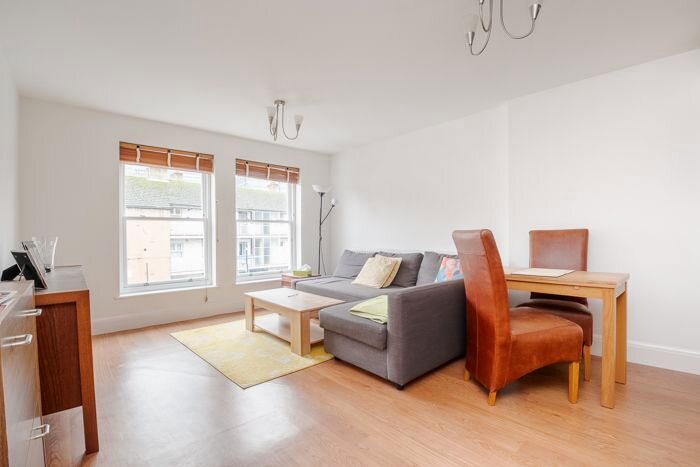
Properties for sale in Canary Wharf
Roads and Postcodes in Canary Wharf
Navigate through our locations to find the location of your next house in Canary Wharf, London for sale or to rent.
Transport near Canary Wharf
-
Heron Quays Station
-
South Quay Station
-
Canary Wharf Station
-
West India Quay Station
-
Poplar Station
-
Crossharbour and London Arena Station
-
Westferry Station
-
All Saints Station
-
Mudchute Station
-
Blackwall Station
- FAQ
- Price Paid By Year
- Property Type Price
Frequently asked questions about Canary Wharf
What is the average price for a property for sale in Canary Wharf?
The average price for a property for sale in Canary Wharf is £516,750. This amount is 1% lower than the average price in London. There are 9,601 property listings for sale in Canary Wharf.
What streets have the most expensive properties for sale in Canary Wharf?
The streets with the most expensive properties for sale in Canary Wharf are Westferry Circus at an average of £1,003,000, Admirals Way at an average of £856,502 and Havannah Street at an average of £656,000.
What streets have the most affordable properties for sale in Canary Wharf?
The streets with the most affordable properties for sale in Canary Wharf are Watergate Walk at an average of £135,000, Manilla Street at an average of £235,000 and Byng Street at an average of £251,535.
Which tube stations are available in or near Canary Wharf?
The tube station available in or near Canary Wharf is Canary Wharf.
Property Price Paid in Canary Wharf by Year
The average sold property price by year was:
| Year | Average Sold Price | Price Change |
Sold Properties
|
|---|---|---|---|
| 2025 | £502,711 | 0,3% |
121 Properties |
| 2024 | £501,404 | -8% |
182 Properties |
| 2023 | £540,022 | 6% |
193 Properties |
| 2022 | £509,293 | -3% |
217 Properties |
| 2021 | £524,915 | -4% |
272 Properties |
| 2020 | £547,958 | 13% |
230 Properties |
| 2019 | £478,480 | -19% |
216 Properties |
| 2018 | £570,612 | 6% |
345 Properties |
| 2017 | £538,604 | 5% |
264 Properties |
| 2016 | £509,624 | -1% |
619 Properties |
| 2015 | £516,575 | 2% |
441 Properties |
| 2014 | £504,518 | 9% |
552 Properties |
| 2013 | £457,533 | 5% |
450 Properties |
| 2012 | £434,944 | 6% |
296 Properties |
| 2011 | £409,810 | 8% |
558 Properties |
| 2010 | £375,274 | -8% |
1,266 Properties |
| 2009 | £403,487 | -4% |
882 Properties |
| 2008 | £419,931 | -17% |
146 Properties |
| 2007 | £491,398 | 21% |
394 Properties |
| 2006 | £387,606 | 9% |
477 Properties |
| 2005 | £350,797 | 2% |
660 Properties |
| 2004 | £342,288 | -6% |
762 Properties |
| 2003 | £363,887 | 13% |
224 Properties |
| 2002 | £315,228 | 2% |
186 Properties |
| 2001 | £310,062 | -2% |
455 Properties |
| 2000 | £315,746 | 35% |
441 Properties |
| 1999 | £205,867 | 31% |
338 Properties |
| 1998 | £142,013 | 3% |
313 Properties |
| 1997 | £137,972 | 39% |
142 Properties |
| 1996 | £83,626 | 9% |
78 Properties |
| 1995 | £76,086 | - |
36 Properties |
Property Price per Property Type in Canary Wharf
Here you can find historic sold price data in order to help with your property search.
The average Property Paid Price for specific property types in the last three years are:
| Property Type | Average Sold Price | Sold Properties |
|---|---|---|
| Terraced House | £615,153.00 | 13 Terraced Houses |
| Flat | £514,101.00 | 483 Flats |

