
Houses for sale & to rent in Blackwall & Cubitt Town, London
House Prices in Blackwall & Cubitt Town
Properties in this part of Blackwall & Cubitt Town within London have an average house price of £544,249.00 and had 494 Property Transactions within the last 3 years¹. This area has 330 households² , where the most expensive property was sold for £2,820,000.00.
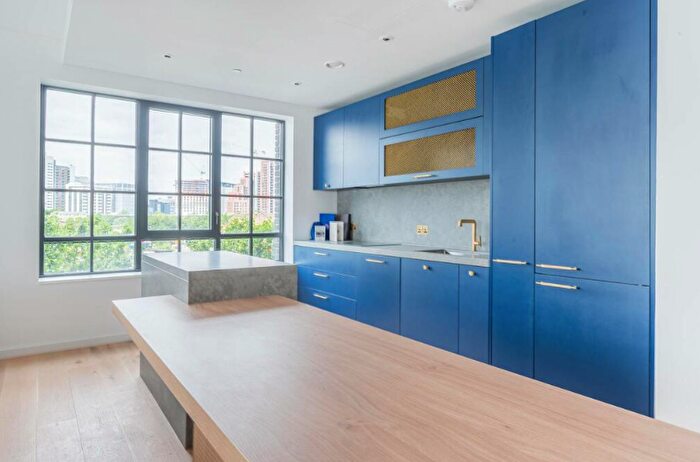
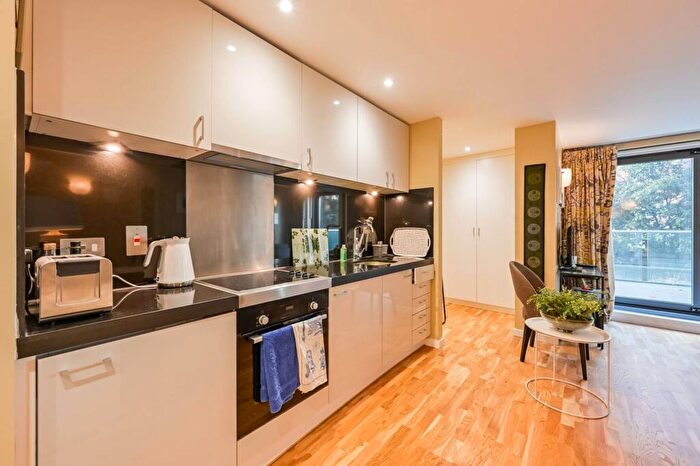
Properties for sale in Blackwall & Cubitt Town
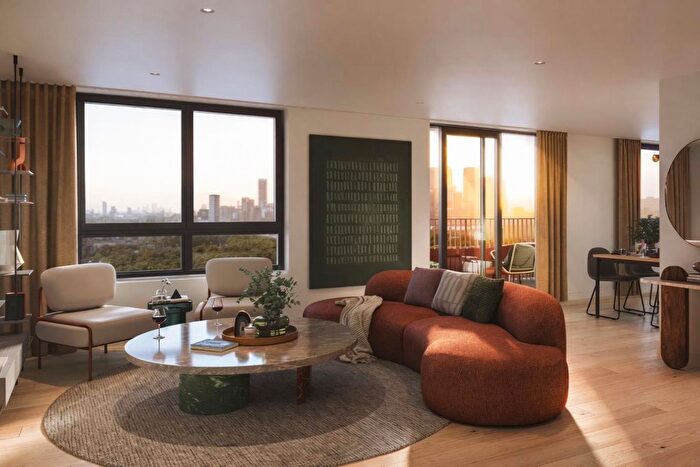

![]()
If you are looking to sell your house, let it out, or receive a property valuation, an expert can help you.
Click the button below to get started.


Roads and Postcodes in Blackwall & Cubitt Town
Navigate through our locations to find the location of your next house in Blackwall & Cubitt Town, London for sale or to rent.
Transport near Blackwall & Cubitt Town
-
 Blackwall Station
 -
East India Station
-
 North Greenwich Station
 -
All Saints Station
-
Poplar Station
-
 Canary Wharf Station
 -
South Quay Station
-
West India Quay Station
-
Crossharbour and London Arena Station
-
Heron Quays Station
- FAQ
- Price Paid By Year
- Property Type Price
Frequently asked questions about Blackwall & Cubitt Town
What is the average price for a property for sale in Blackwall & Cubitt Town?
The average price for a property for sale in Blackwall & Cubitt Town is £544,249. This amount is 3% higher than the average price in London. There are 8,558 property listings for sale in Blackwall & Cubitt Town.
What streets have the most expensive properties for sale in Blackwall & Cubitt Town?
The streets with the most expensive properties for sale in Blackwall & Cubitt Town are Orchard Place at an average of £1,111,711, Dollar Bay Place at an average of £789,921 and East Ferry Road at an average of £699,294.
What streets have the most affordable properties for sale in Blackwall & Cubitt Town?
The streets with the most affordable properties for sale in Blackwall & Cubitt Town are MARSH WALL at an average of £152,563, Dominion Walk at an average of £385,225 and River Barge Close at an average of £434,333.
Which tube stations are available in or near Blackwall & Cubitt Town?
Some of the tube stations available in or near Blackwall & Cubitt Town are North Greenwich and Canary Wharf.
Property Price Paid in Blackwall & Cubitt Town by Year
The average sold property price by year was:
| Year | Average Sold Price | Price Change |
Sold Properties
|
|---|---|---|---|
| 2025 | £565,419 | 8% |
76 Properties |
| 2024 | £522,090 | -14% |
128 Properties |
| 2023 | £593,463 | 11% |
96 Properties |
| 2022 | £526,224 | -15% |
194 Properties |
| 2021 | £603,335 | 7% |
112 Properties |
| 2020 | £559,007 | 1% |
303 Properties |
| 2019 | £550,828 | 1% |
594 Properties |
| 2018 | £546,681 | -11% |
485 Properties |
| 2017 | £608,452 | 13% |
558 Properties |
| 2016 | £527,732 | 5% |
1,041 Properties |
| 2015 | £500,634 | 17% |
34 Properties |
| 2014 | £417,100 | - |
1 Property |
Property Price per Property Type in Blackwall & Cubitt Town
Here you can find historic sold price data in order to help with your property search.
The average Property Paid Price for specific property types in the last three years are:
| Property Type | Average Sold Price | Sold Properties |
|---|---|---|
| Terraced House | £1,103,514.00 | 9 Terraced Houses |
| Flat | £533,871.00 | 485 Flats |