
Houses for sale in Altrincham, Trafford
House Prices in Altrincham
Properties in Altrincham have an average house price of £566k and had 3,369 Property Transactions within the last 3 years.¹
Altrincham is an area in Trafford with 29,709 households², where the most expensive property was sold for £7M.
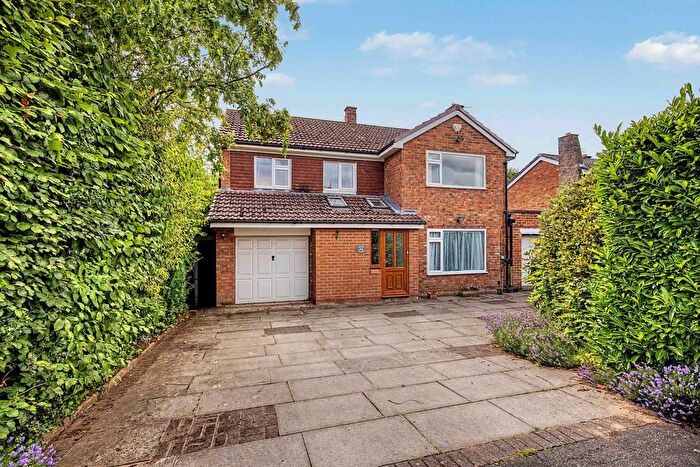
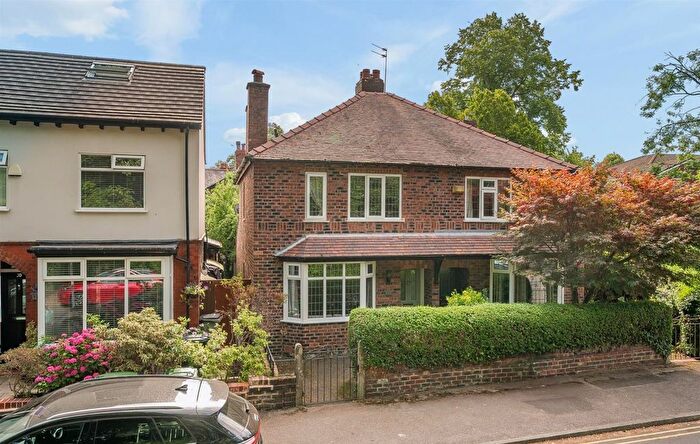
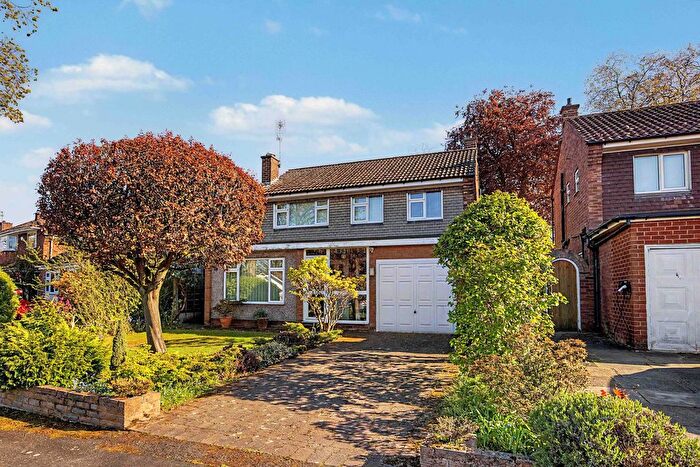
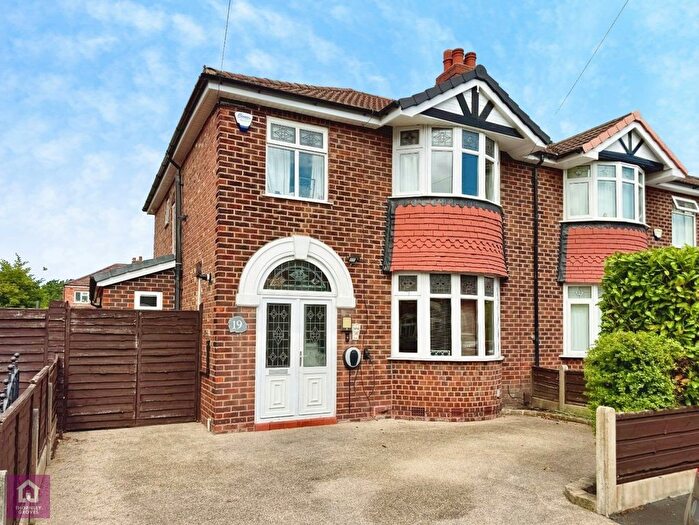
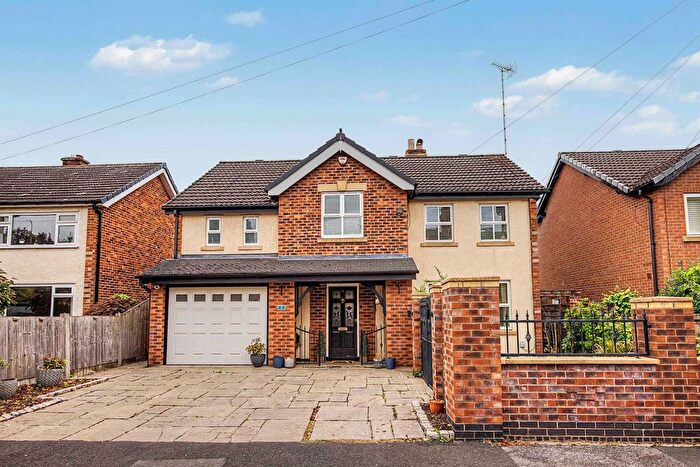
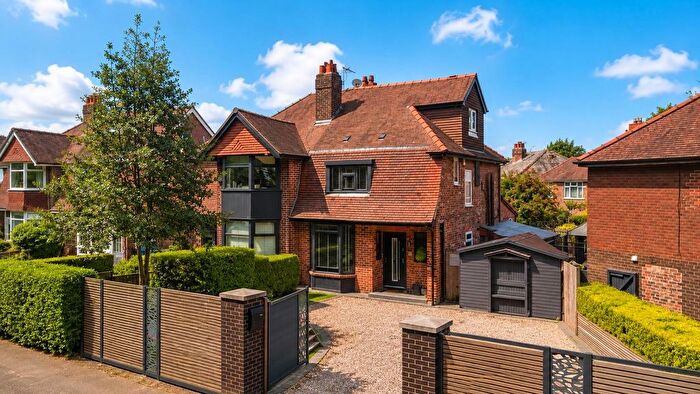
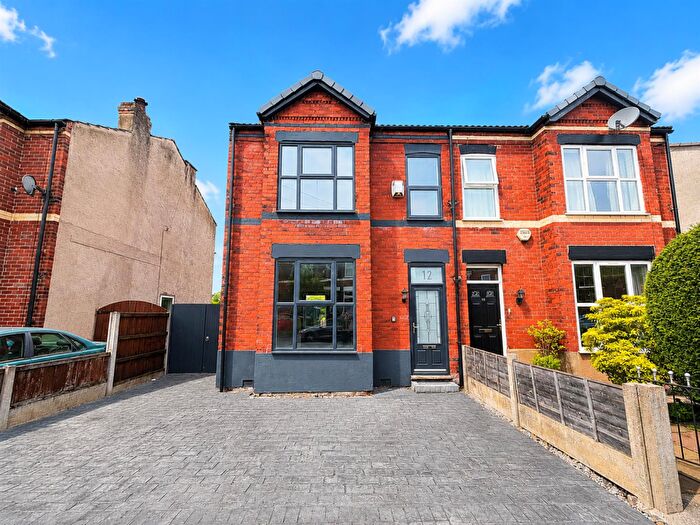
Properties for sale in Altrincham
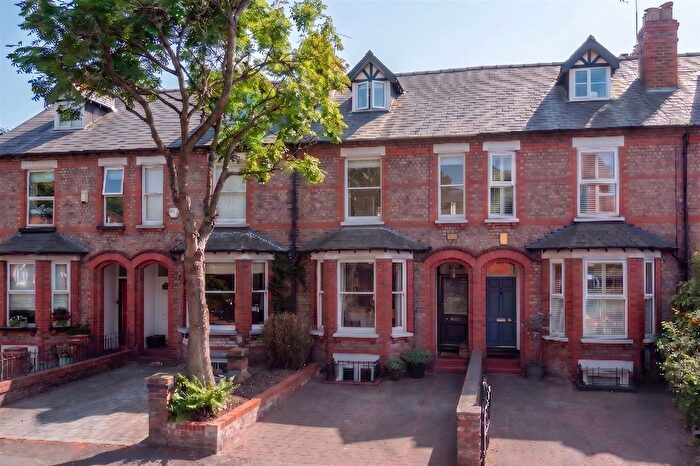
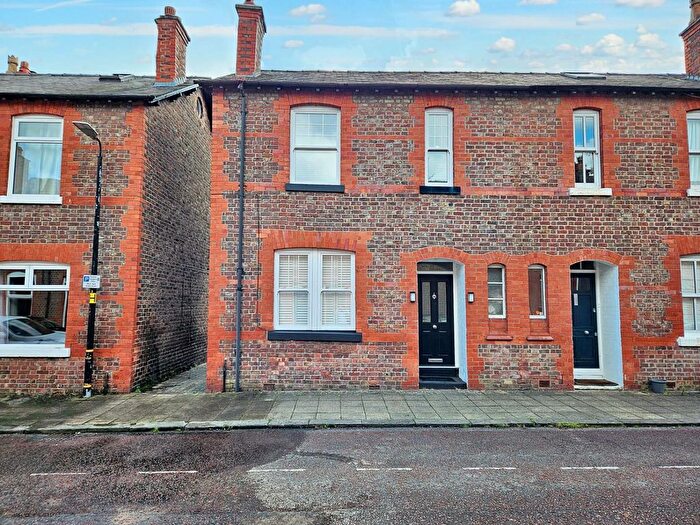
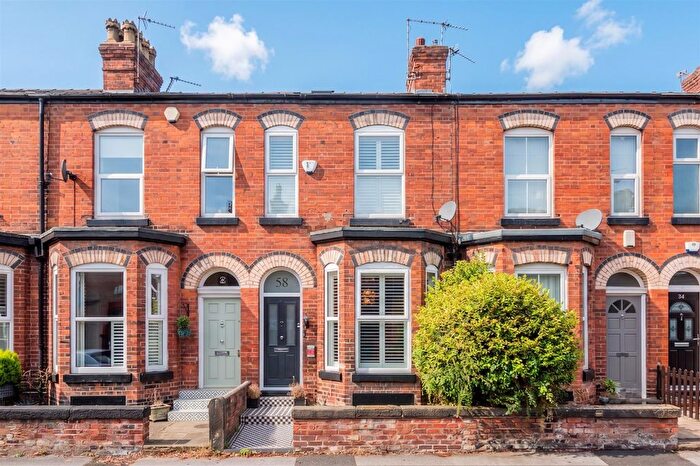
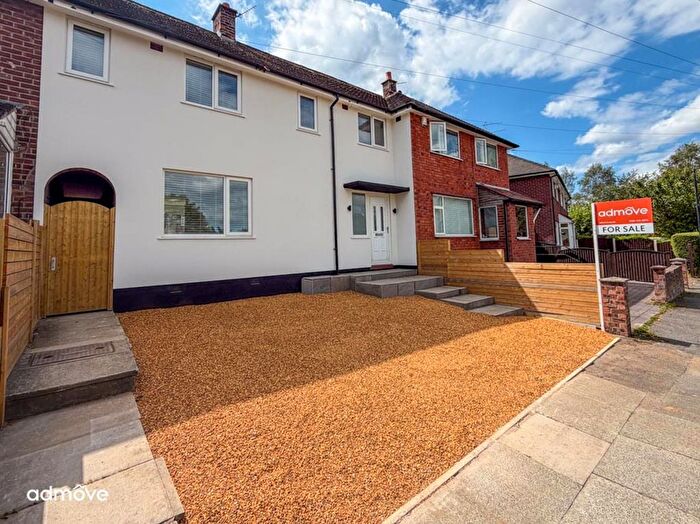
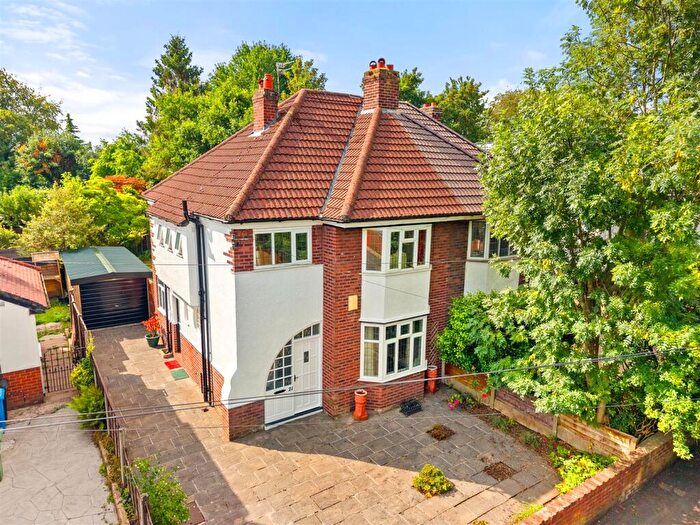
![]()
If you are looking to sell your house, let it out, or receive a property valuation, an expert can help you.
Click the button below to get started.
Neighbourhoods in Altrincham
Navigate through our locations to find the location of your next house in Altrincham, Trafford for sale or to rent.
Property price trends in Altrincham
According to the latest Land Registry data, the average home in Altrincham sold for £554,181 in 2026. That figure comes from a substantial record of 43,332 sales logged over the past 31 years.
Prices have softened over the last three years. Compared with 2023, when the typical sale came in around £580,625, that's a fall of roughly 4.6%.
Looking back five years, average prices are up about 4.7% since 2021, a gain of around £24,840 in cash terms.
Zoom out to the past decade for the fuller picture. Back in 2016, homes here averaged £420,602, so the typical sold price has climbed about 31.8% since then, roughly 2.8% a year. Stretch the view to fifteen years and that annual pace edges up closer to 3.2%.
Frequently asked questions about Altrincham
What is the average price for a property for sale in Altrincham?
The average price for a property for sale in Altrincham is £566,381. This amount is 31% higher than the average price in Trafford. There are 9,312 property listings for sale in Altrincham.
What locations have the most expensive properties for sale in Altrincham?
The locations with the most expensive properties for sale in Altrincham are Hale Barns at an average of £874,663, Bowdon at an average of £870,785 and Hale Central at an average of £701,850.
What locations have the most affordable properties for sale in Altrincham?
The locations with the most affordable properties for sale in Altrincham are Broadheath at an average of £358,177, Village at an average of £380,849 and Altrincham at an average of £418,772.
Which train stations are available in or near Altrincham?
Some of the train stations available in or near Altrincham are Altrincham, Navigation Road and Hale.
Property Price Paid in Altrincham by Year
The average sold property price by year was:
| Year | Average Sold Price | Price Change |
Sold Properties
|
|---|---|---|---|
| 2026 | £554,181 | -3% |
91 Properties |
| 2025 | £569,043 | 3% |
1,088 Properties |
| 2024 | £552,219 | -5% |
1,161 Properties |
| 2023 | £580,625 | -0,4% |
1,029 Properties |
| 2022 | £583,110 | 9% |
1,199 Properties |
| 2021 | £529,341 | 10% |
1,703 Properties |
| 2020 | £476,438 | 0,2% |
1,128 Properties |
| 2019 | £475,423 | 5% |
1,240 Properties |
| 2018 | £450,244 | 5% |
1,410 Properties |
| 2017 | £428,095 | 2% |
1,520 Properties |
Property Price per Property Type in Altrincham
Here you can find historic sold price data in order to help with your property search.
The average Property Paid Price for specific property types in the last three years are:
| Property Type | Average Sold Price | Sold Properties |
|---|---|---|
| Semi Detached House | £528,182.00 | 1,177 Semi Detached Houses |
| Terraced House | £460,055.00 | 763 Terraced Houses |
| Detached House | £1,035,214.00 | 695 Detached Houses |
| Flat | £294,240.00 | 734 Flats |
Transport in Altrincham
Please see below transportation links in this area:
