
Houses for sale in Sale, Trafford
House Prices in Sale
Properties in Sale have an average house price of £397k and had 2,473 Property Transactions within the last 3 years.¹
Sale is an area in Trafford with 25,378 households², where the most expensive property was sold for £1.43M.
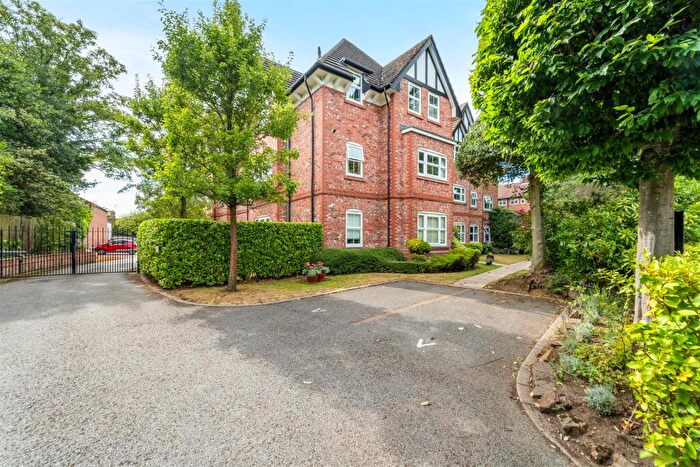
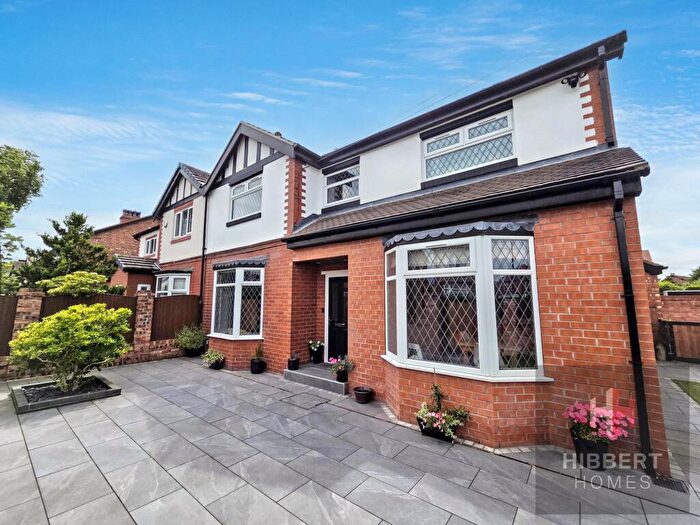
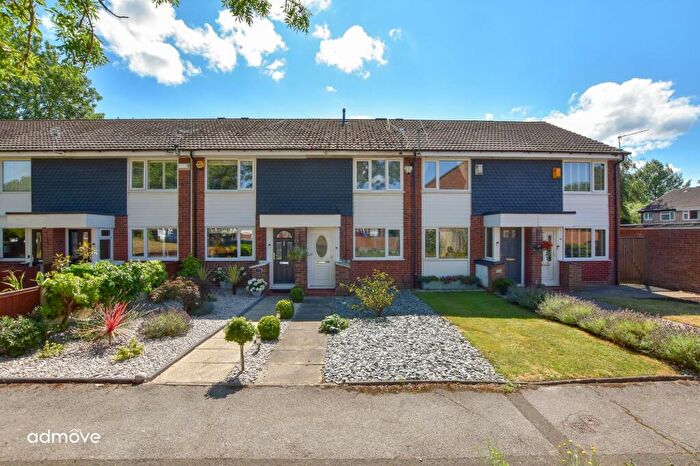
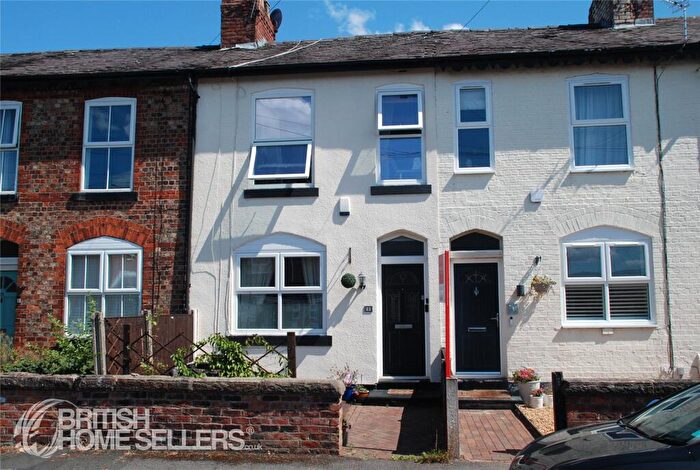
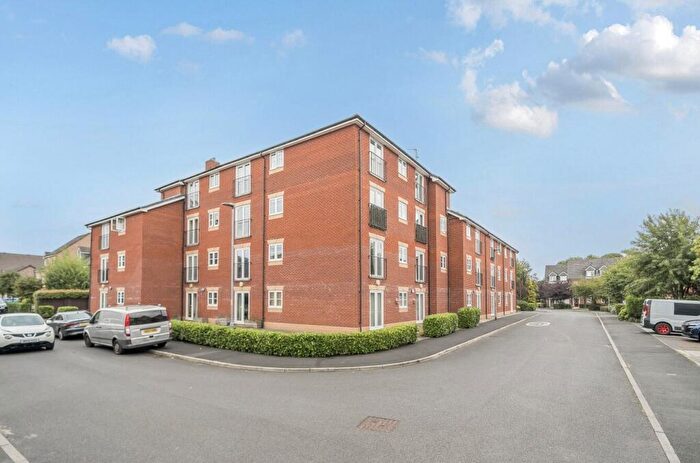
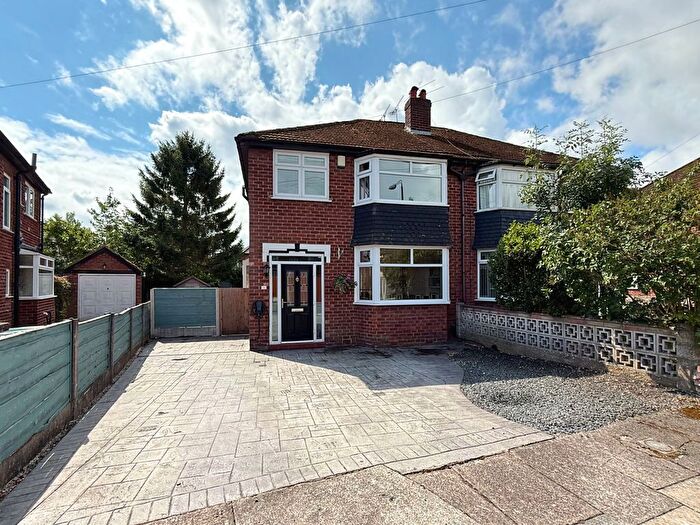
Properties for sale in Sale
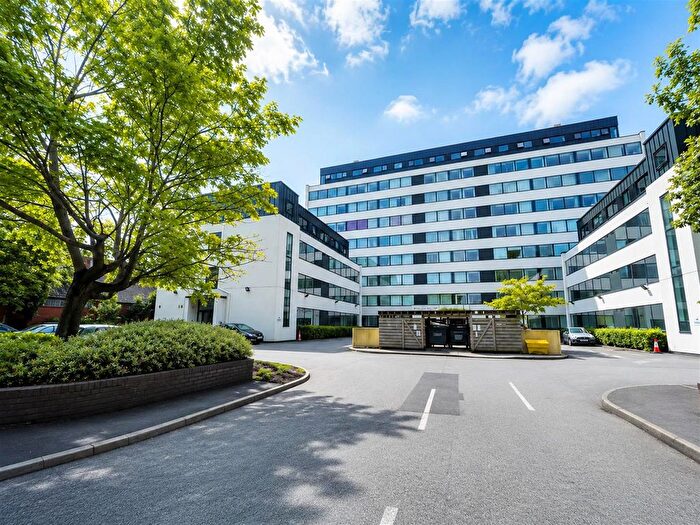
![]()
If you are looking to sell your house, let it out, or receive a property valuation, an expert can help you.
Click the button below to get started.


Neighbourhoods in Sale
Navigate through our locations to find the location of your next house in Sale, Trafford for sale or to rent.
Property price trends in Sale
According to the latest Land Registry data, the average home in Sale sold for £405,764 in 2026. That figure comes from a substantial record of 32,273 sales logged over the past 31 years.
Prices have moved up over the last three years. Compared with 2023, when the typical sale came in around £390,808, that's a rise of roughly 3.8%.
Looking back five years, average prices are up about 14.8% since 2021, a gain of around £52,193 in cash terms.
Zoom out to the past decade for the fuller picture. Back in 2016, homes here averaged £266,099, so the typical sold price has climbed about 52.5% since then, roughly 4.3% a year. Stretch the view to fifteen years and that annual pace holds at about 4.3%.
Frequently asked questions about Sale
What is the average price for a property for sale in Sale?
The average price for a property for sale in Sale is £397,192. This amount is 8% lower than the average price in Trafford. There are 9,432 property listings for sale in Sale.
What locations have the most expensive properties for sale in Sale?
The locations with the most expensive properties for sale in Sale are Village at an average of £729,627, Broadheath at an average of £444,104 and St Marys at an average of £443,430.
What locations have the most affordable properties for sale in Sale?
The locations with the most affordable properties for sale in Sale are Priory at an average of £342,858, Bucklow-st Martins at an average of £354,167 and Sale Moor at an average of £364,893.
Which train stations are available in or near Sale?
Some of the train stations available in or near Sale are Navigation Road, Humphrey Park and Urmston.
Property Price Paid in Sale by Year
The average sold property price by year was:
| Year | Average Sold Price | Price Change |
Sold Properties
|
|---|---|---|---|
| 2026 | £405,764 | 3% |
51 Properties |
| 2025 | £392,908 | -3% |
790 Properties |
| 2024 | £406,314 | 4% |
862 Properties |
| 2023 | £390,808 | -3% |
770 Properties |
| 2022 | £400,916 | 12% |
927 Properties |
| 2021 | £353,571 | 5% |
1,269 Properties |
| 2020 | £335,075 | 7% |
836 Properties |
| 2019 | £312,737 | 4% |
926 Properties |
| 2018 | £300,130 | 7% |
993 Properties |
| 2017 | £278,290 | 4% |
1,097 Properties |
Property Price per Property Type in Sale
Here you can find historic sold price data in order to help with your property search.
The average Property Paid Price for specific property types in the last three years are:
| Property Type | Average Sold Price | Sold Properties |
|---|---|---|
| Semi Detached House | £455,374.00 | 1,017 Semi Detached Houses |
| Terraced House | £329,900.00 | 663 Terraced Houses |
| Detached House | £648,879.00 | 319 Detached Houses |
| Flat | £197,098.00 | 474 Flats |
Transport in Sale
Please see below transportation links in this area:
