Houses for sale & to rent in Bucklow-st Martins, Sale
House Prices in Bucklow-st Martins
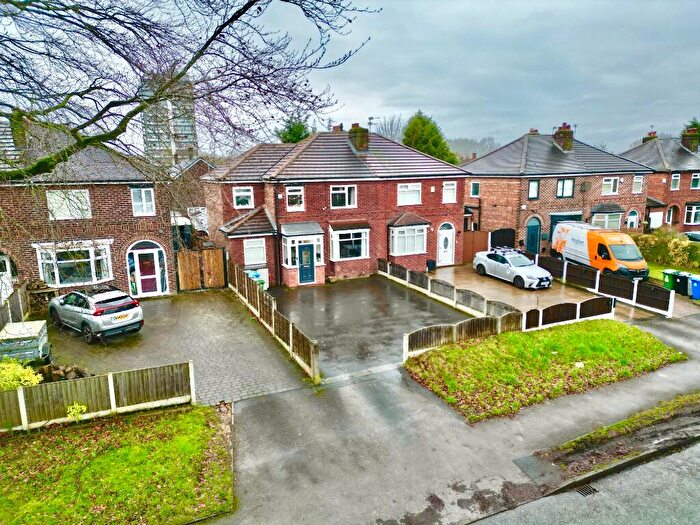
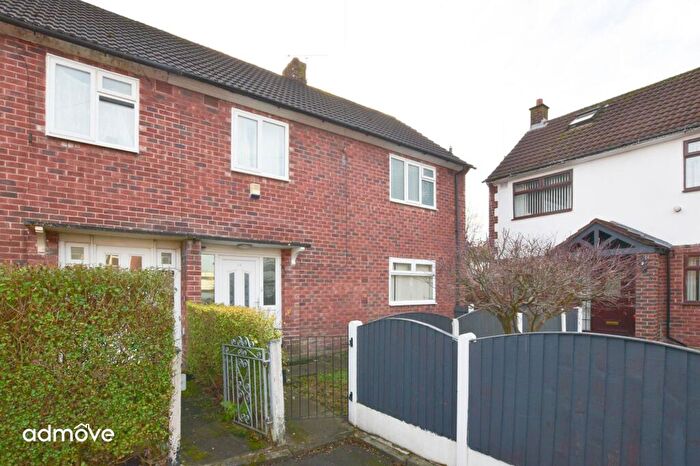
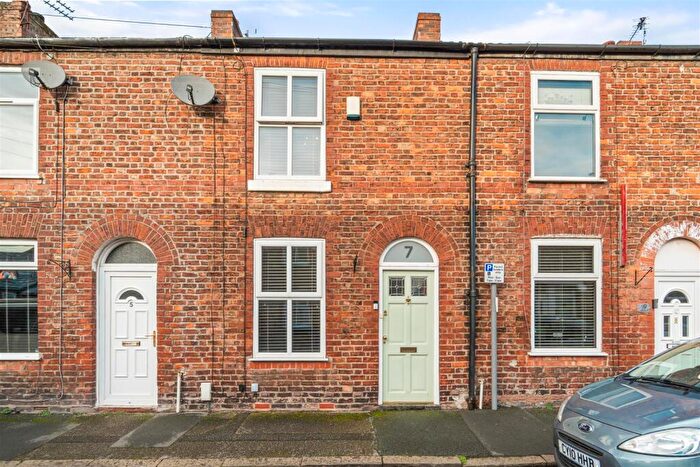
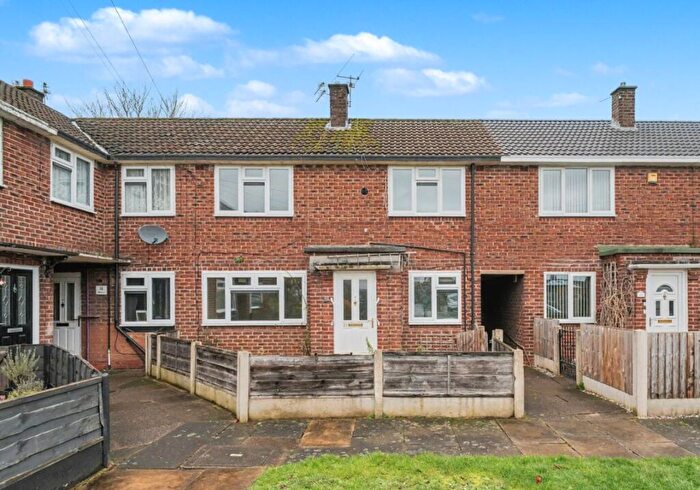
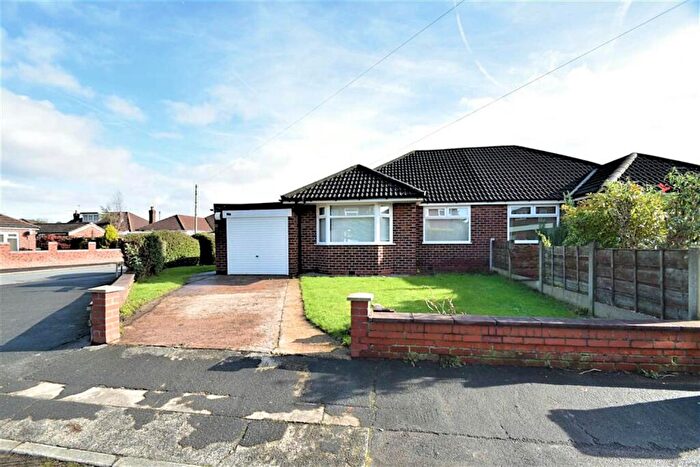
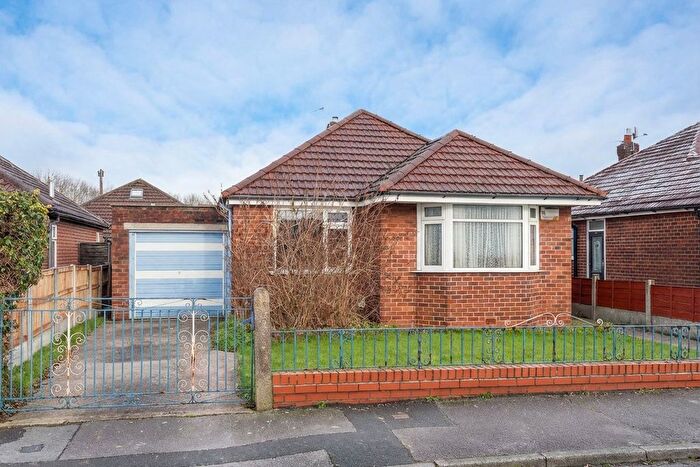
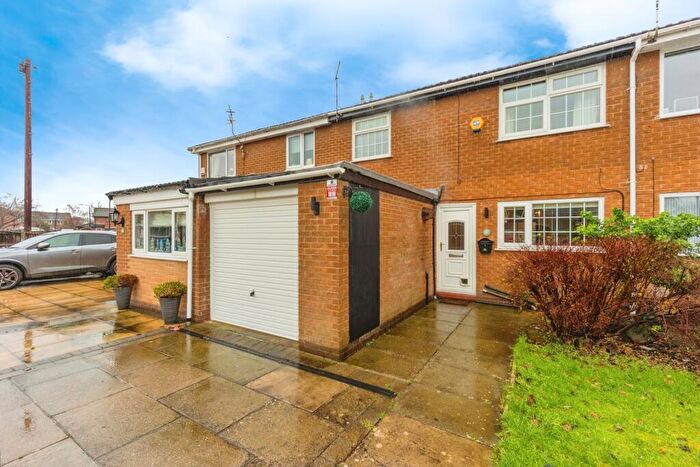
Properties in Bucklow-st Martins have an average house price of £356,462.00 and had 70 Property Transactions within the last 3 years¹.
Bucklow-st Martins is an area in Sale, Trafford with 954 households², where the most expensive property was sold for £950,000.00.
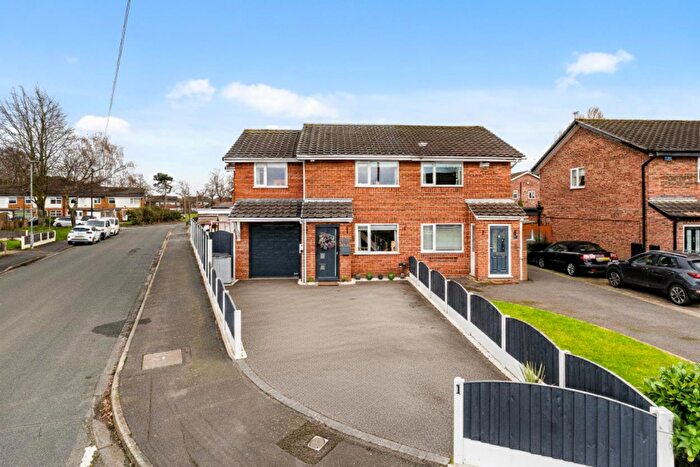
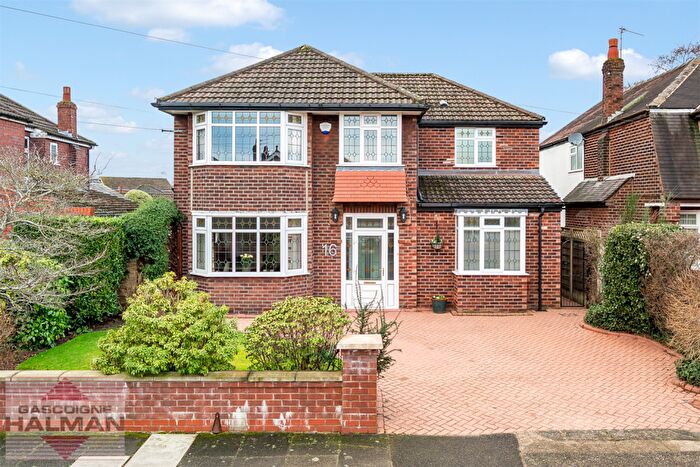
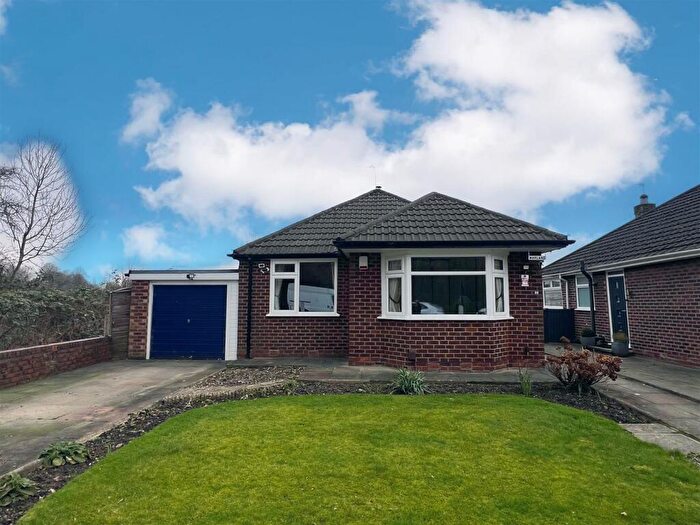
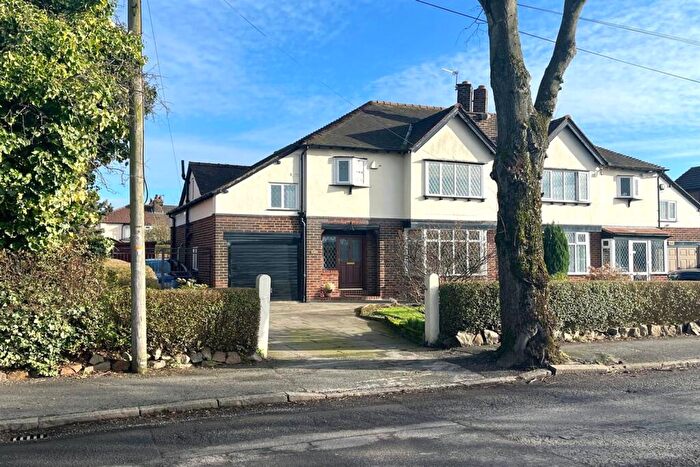
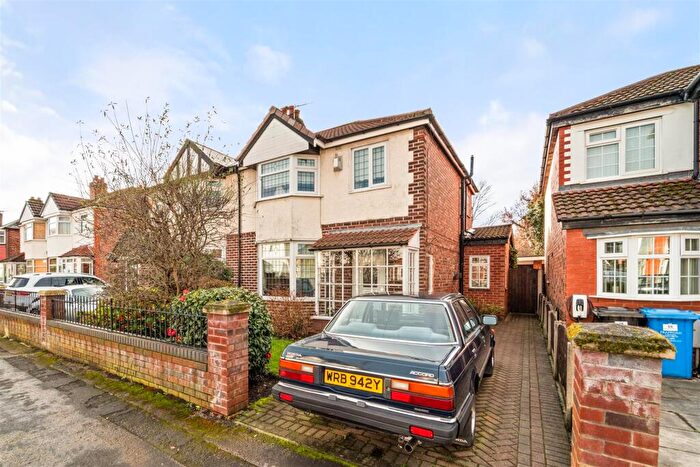
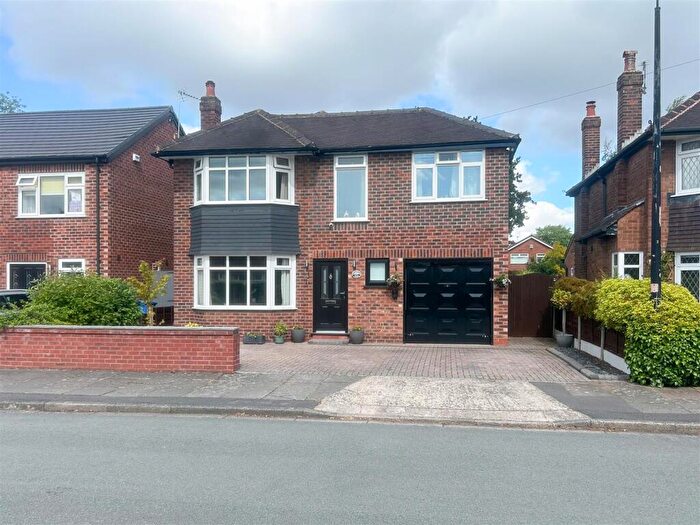
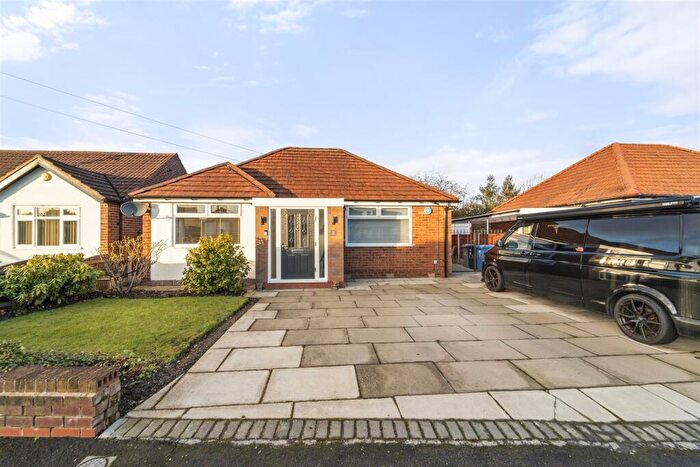
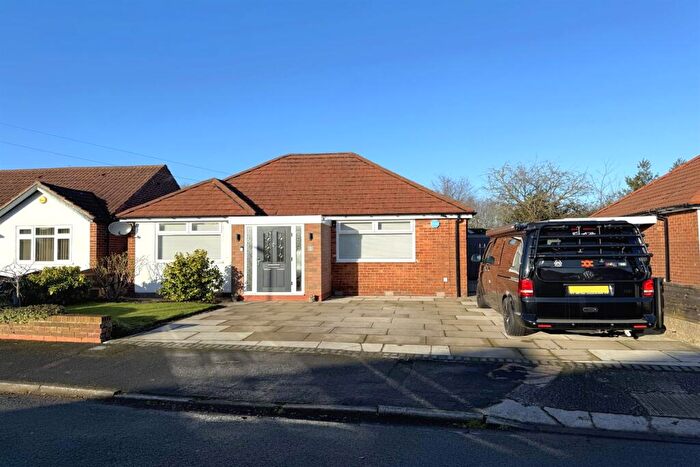
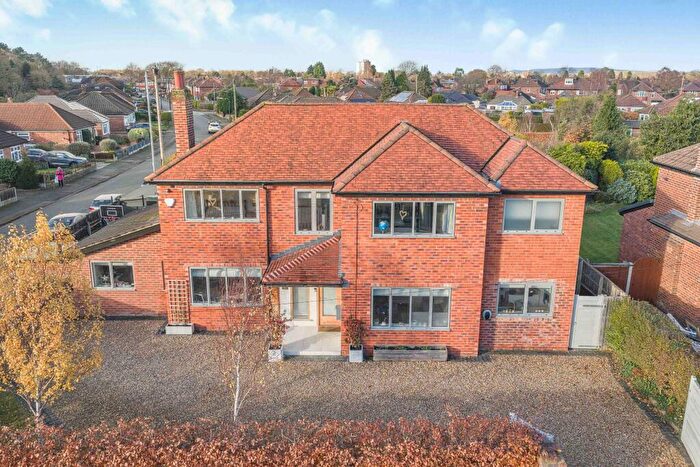
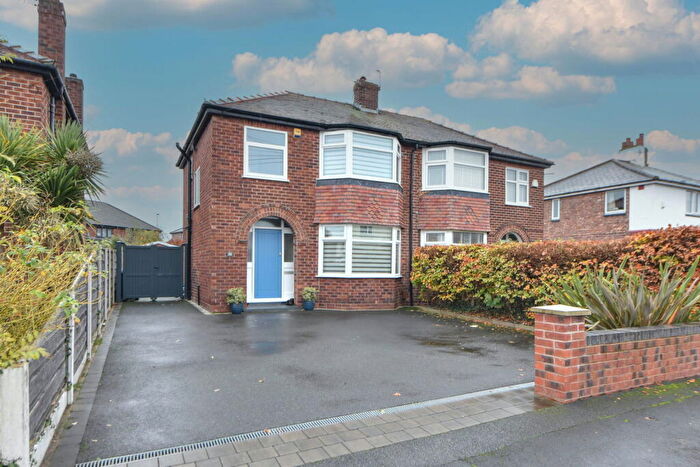
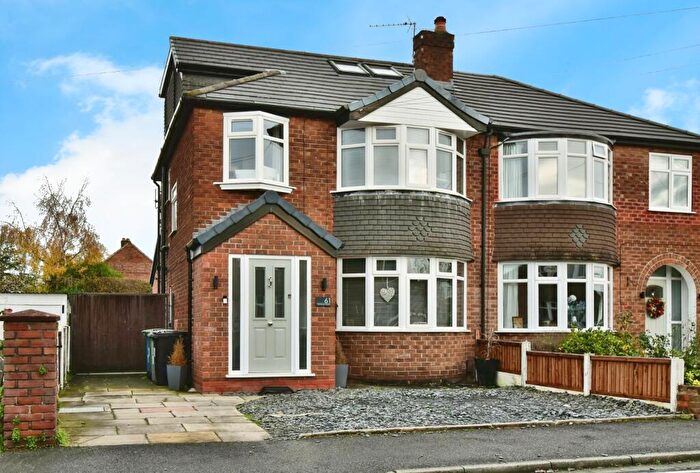
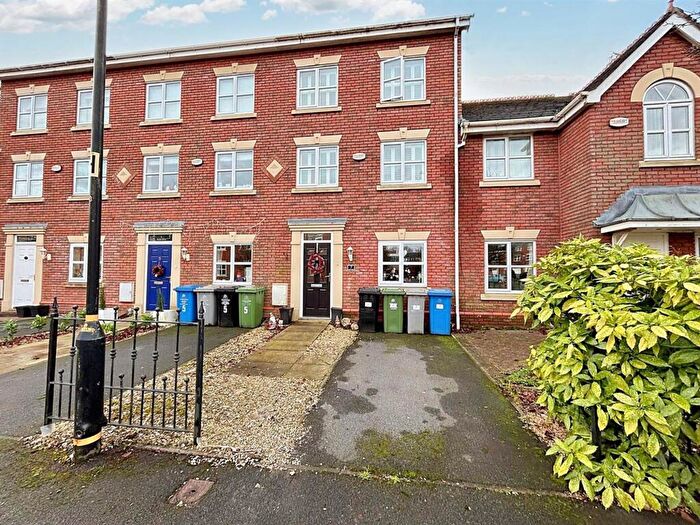
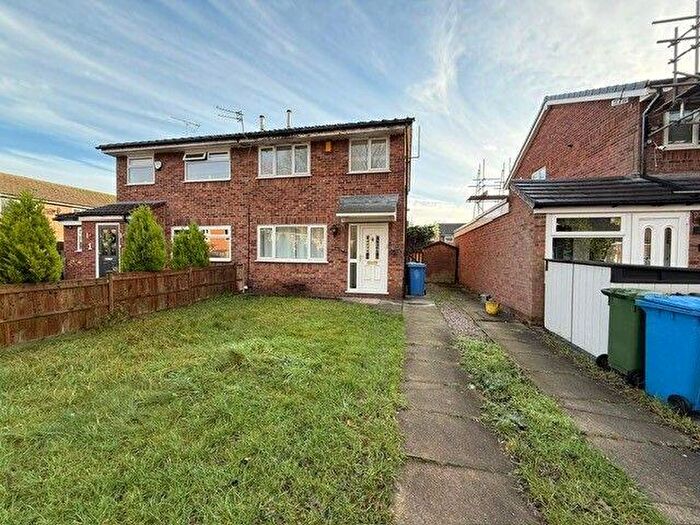
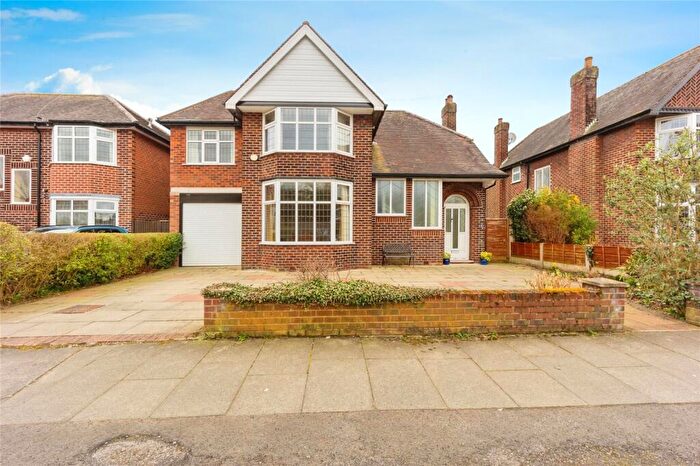
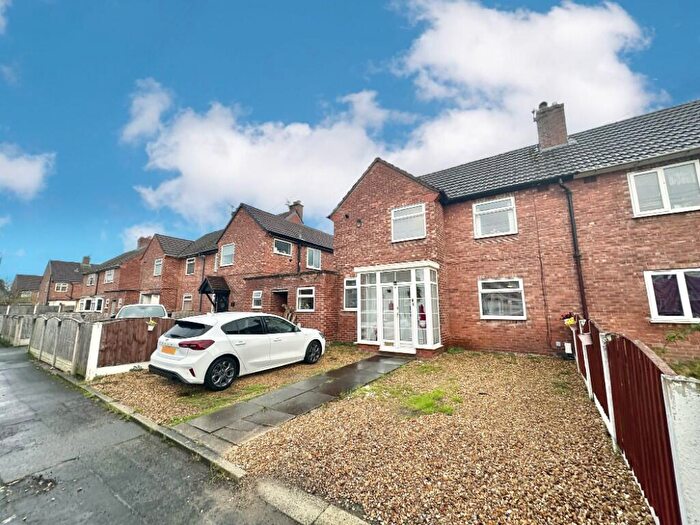
Properties for sale in Bucklow-st Martins
Roads and Postcodes in Bucklow-st Martins
Navigate through our locations to find the location of your next house in Bucklow-st Martins, Sale for sale or to rent.
| Streets | Postcodes |
|---|---|
| Apple Tree Walk | M33 5NT |
| Arden Walk | M33 5NY |
| Ash Walk | M33 5LA |
| Berberis Walk | M33 5EP |
| Bodmin Road | M33 5JH |
| Bracken Close | M33 5EX |
| Bramble Walk | M33 5LL |
| Branscombe Drive | M33 5JN |
| Carradale Drive | M33 5JP |
| Carrington Lane | M33 5NJ M33 5UN M33 5WJ M33 5WL M33 5BL M33 5NL |
| Cedar Road | M33 5NW |
| Christchurch Road | M33 5GF M33 5JF M33 5JL |
| Churchfields | M33 5NS |
| Copplestone Drive | M33 5JJ |
| Cottonwood Drive | M33 5EW M33 5GD |
| Cypress Walk | M33 5NZ |
| Douglas Walk | M33 5ES |
| Epping Drive | M33 5LH M33 5LR M33 5LS M33 5LY M33 5EU M33 5FT M33 5LN |
| Evergreen Walk | M33 5LZ |
| Exmouth Road | M33 5FP |
| Firethorn Walk | M33 5SU |
| Hambleton Drive | M33 5JE |
| Hawthorn Lane | M33 5NN M33 5WW |
| Heatherway | M33 5ER M33 5JY M33 5JZ M33 5LB M33 5LE |
| Hedgelands Walk | M33 5LF |
| Hockerley Close | M33 5SH |
| Honeysuckle Walk | M33 5NB |
| Hornbeam Close | M33 5LJ |
| Hydrangea Close | M33 5EQ |
| Laburnum Walk | M33 5ET |
| Lavender Close | M33 5NU |
| Magnolia Close | M33 5LQ M33 5LG |
| Mahogany Walk | M33 5FU |
| Manor Avenue | M33 5JG M33 5JQ M33 5JR M33 5JS M33 5JX |
| Mountain Ash Close | M33 5LD |
| Mulberry Walk | M33 5NA |
| Norton Avenue | M33 5HE |
| Olive Walk | M33 5LW |
| Ollerton Avenue | M33 5HB M33 5HD |
| Palm Close | M33 5LU |
| Pear Tree Walk | M33 5LT |
| Pine Grove | M33 5WN |
| Plymouth Road | M33 5JD |
| Saxthorpe Close | M33 5GE |
| Sidmouth Road | M33 5JB |
| Spruce Walk | M33 5LP |
| Tavistock Road | M33 5JA |
| The Moss | M33 5RJ |
| Totnes Road | M33 5HG |
| Vine Close | M33 5EN |
| Whitebeam Walk | M33 5JW |
Transport near Bucklow-st Martins
-
Chassen Road Station
-
Urmston Station
-
Flixton Station
-
Humphrey Park Station
-
Navigation Road Station
-
Trafford Park Station
-
Altrincham Station
- FAQ
- Price Paid By Year
- Property Type Price
Frequently asked questions about Bucklow-st Martins
What is the average price for a property for sale in Bucklow-st Martins?
The average price for a property for sale in Bucklow-st Martins is £356,462. This amount is 10% lower than the average price in Sale. There are 707 property listings for sale in Bucklow-st Martins.
What streets have the most expensive properties for sale in Bucklow-st Martins?
The streets with the most expensive properties for sale in Bucklow-st Martins are Churchfields at an average of £760,000, Carrington Lane at an average of £490,350 and Cedar Road at an average of £459,000.
What streets have the most affordable properties for sale in Bucklow-st Martins?
The streets with the most affordable properties for sale in Bucklow-st Martins are Hydrangea Close at an average of £123,000, Arden Walk at an average of £200,000 and Bramble Walk at an average of £228,750.
Which train stations are available in or near Bucklow-st Martins?
Some of the train stations available in or near Bucklow-st Martins are Chassen Road, Urmston and Flixton.
Property Price Paid in Bucklow-st Martins by Year
The average sold property price by year was:
| Year | Average Sold Price | Price Change |
Sold Properties
|
|---|---|---|---|
| 2025 | £384,160 | 11% |
25 Properties |
| 2024 | £342,720 | 1% |
25 Properties |
| 2023 | £339,020 | -12% |
20 Properties |
| 2022 | £379,499 | 22% |
27 Properties |
| 2021 | £295,483 | 11% |
35 Properties |
| 2020 | £261,677 | 4% |
27 Properties |
| 2019 | £251,880 | 8% |
25 Properties |
| 2018 | £231,611 | 6% |
27 Properties |
| 2017 | £216,860 | 18% |
25 Properties |
| 2016 | £177,052 | -1% |
34 Properties |
| 2015 | £178,916 | 8% |
25 Properties |
| 2014 | £165,137 | 8% |
25 Properties |
| 2013 | £152,033 | 10% |
28 Properties |
| 2012 | £136,541 | -10% |
23 Properties |
| 2011 | £149,997 | 7% |
21 Properties |
| 2010 | £138,905 | -37% |
19 Properties |
| 2009 | £190,981 | 33% |
18 Properties |
| 2008 | £127,041 | -25% |
12 Properties |
| 2007 | £158,836 | 4% |
34 Properties |
| 2006 | £152,282 | 5% |
39 Properties |
| 2005 | £145,035 | 9% |
19 Properties |
| 2004 | £131,856 | 19% |
41 Properties |
| 2003 | £107,181 | 11% |
44 Properties |
| 2002 | £95,903 | 15% |
59 Properties |
| 2001 | £81,621 | 8% |
21 Properties |
| 2000 | £74,806 | -1% |
32 Properties |
| 1999 | £75,628 | 31% |
30 Properties |
| 1998 | £51,983 | -24% |
15 Properties |
| 1997 | £64,319 | 20% |
23 Properties |
| 1996 | £51,632 | 8% |
23 Properties |
| 1995 | £47,296 | - |
14 Properties |
Property Price per Property Type in Bucklow-st Martins
Here you can find historic sold price data in order to help with your property search.
The average Property Paid Price for specific property types in the last three years are:
| Property Type | Average Sold Price | Sold Properties |
|---|---|---|
| Semi Detached House | £391,129.00 | 34 Semi Detached Houses |
| Detached House | £647,083.00 | 6 Detached Houses |
| Terraced House | £261,775.00 | 29 Terraced Houses |
| Flat | £180,000.00 | 1 Flat |

