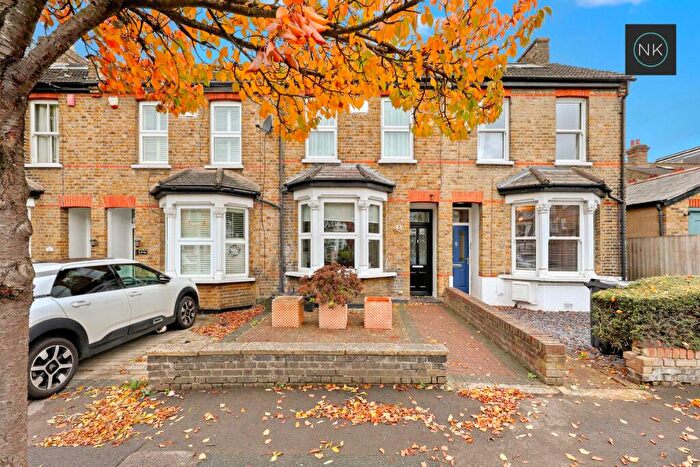
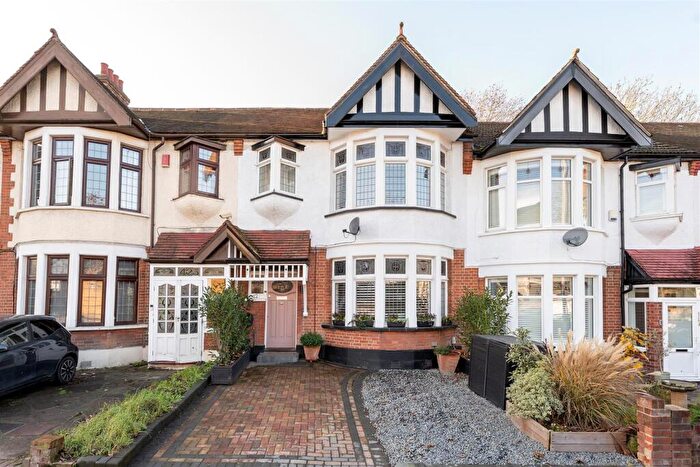
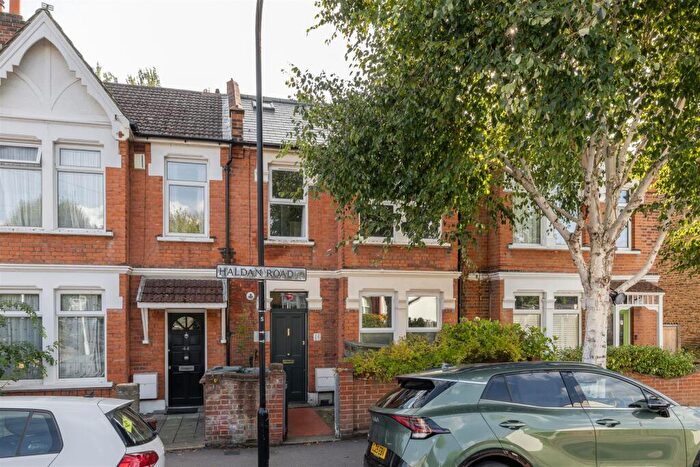
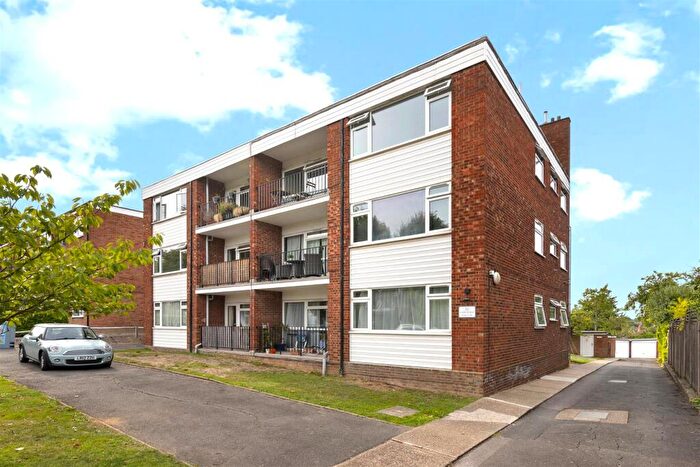
Houses for sale & to rent in Hale End And Highams Park, Woodford Green
House Prices in Hale End And Highams Park
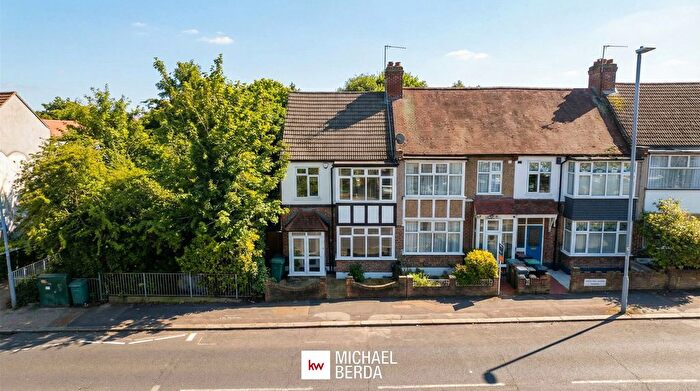
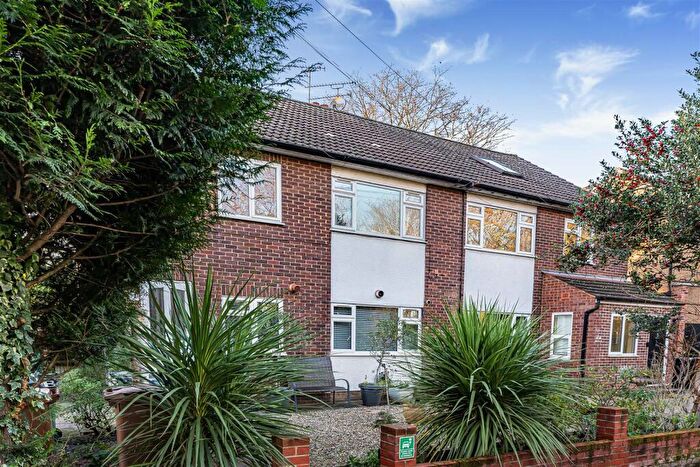
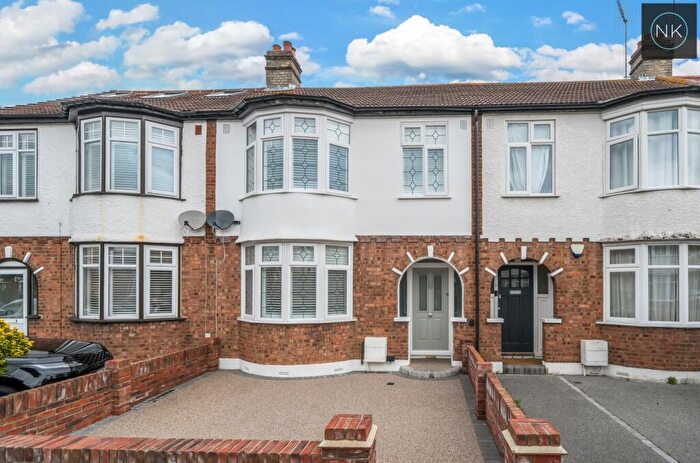
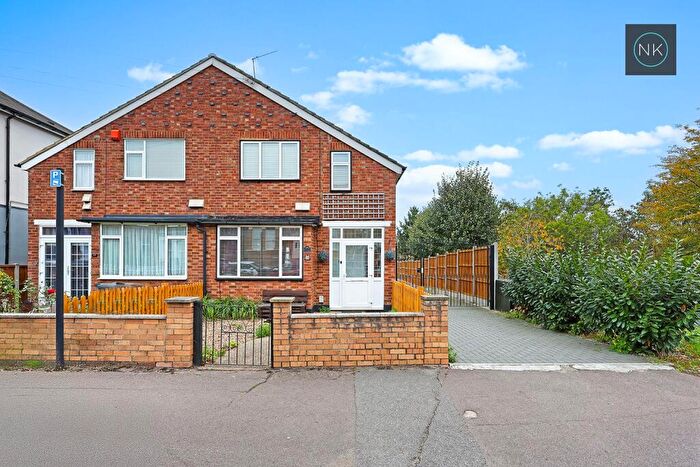
Properties in this part of Hale End And Highams Park within Woodford Green have an average house price of £700,013.00 and had 92 Property Transactions within the last 3 years¹. This area has 1,150 households² , where the most expensive property was sold for £3,615,000.00.
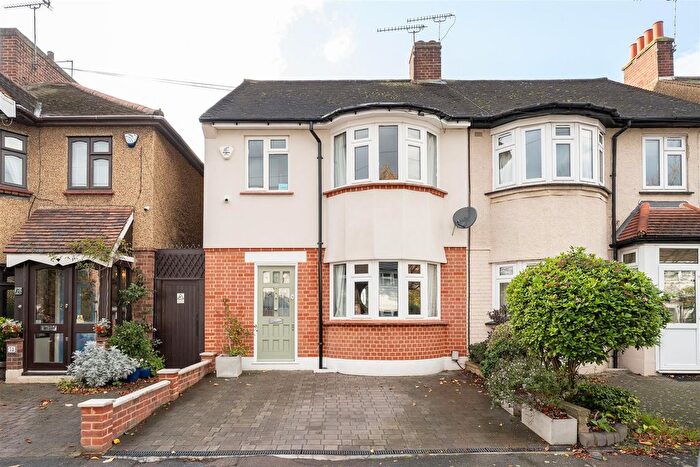
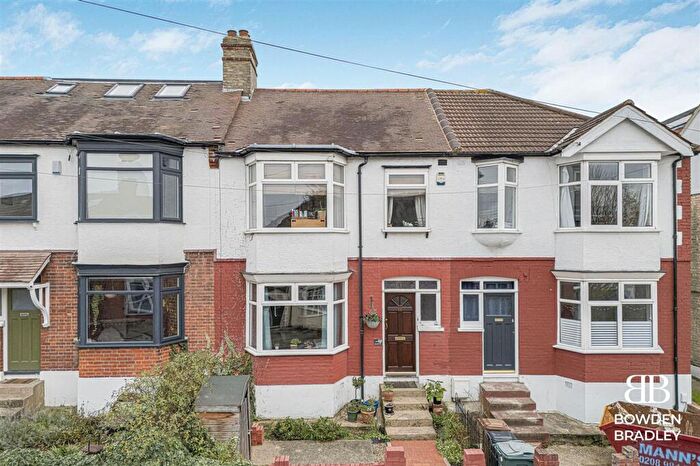
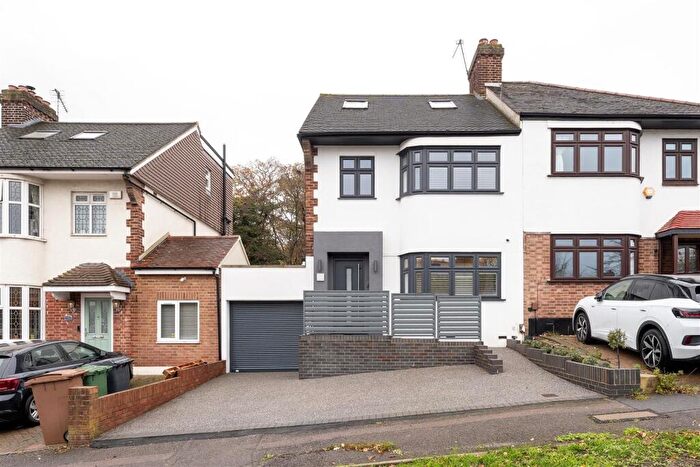
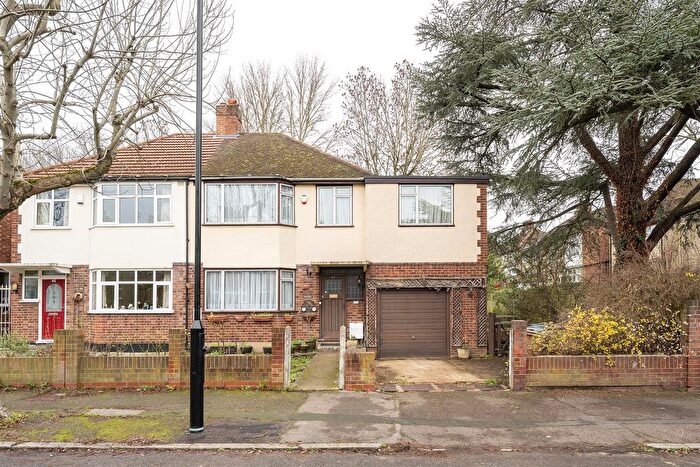
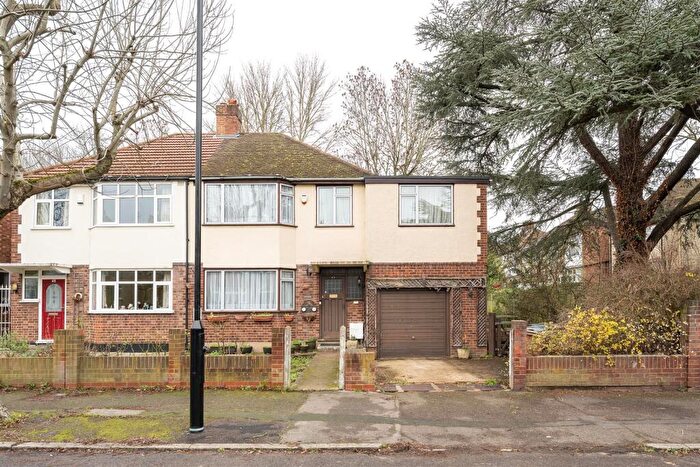
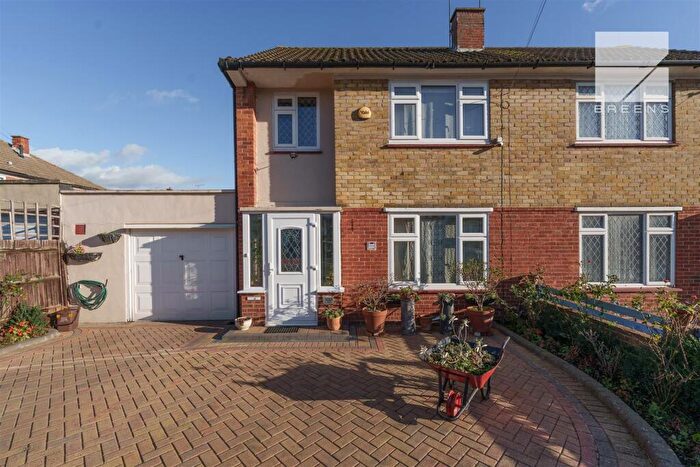
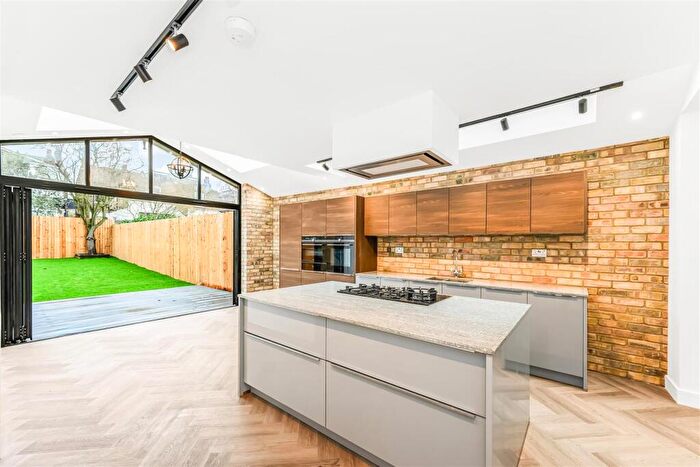
Properties for sale in Hale End And Highams Park
Roads and Postcodes in Hale End And Highams Park
Navigate through our locations to find the location of your next house in Hale End And Highams Park, Woodford Green for sale or to rent.
| Streets | Postcodes |
|---|---|
| Alders Avenue | IG8 9PY |
| Armstrong Avenue | IG8 9PT IG8 9PU |
| Bridle Path | IG8 9LF IG8 9LX IG8 9LY IG8 9NH IG8 9NQ |
| Brook Meadow Close | IG8 9NR |
| Brookfield Path | IG8 9PS |
| Churchills Mews | IG8 9DP |
| Conyers Close | IG8 9PX |
| Forest Drive | IG8 9NG |
| Frinton Drive | IG8 9ND |
| Galeborough Avenue | IG8 9PL |
| Gascoigne Gardens | IG8 9NT IG8 9NU |
| Hale End Road | IG8 9LL IG8 9LP IG8 9LR IG8 9LS IG8 9LU IG8 9LW IG8 9LZ IG8 9NB IG8 9LH IG8 9LN |
| Harman Avenue | IG8 9DS |
| High Road | IG8 9LA IG8 9LB |
| Holly Crescent | IG8 9PD |
| Hollywood Way | IG8 9LG IG8 9LQ |
| Lodge Villas | IG8 9DR |
| Mapperley Drive | IG8 9NZ |
| Mill Broke Mews | IG8 9FE |
| Montserrat Avenue | IG8 9PJ |
| Nesta Road | IG8 9RG |
| Oak Hill | IG8 9NS IG8 9NX IG8 9PA IG8 9PB IG8 9PE IG8 9PF IG8 9PG IG8 9NY |
| Oak Hill Close | IG8 9PH |
| Oak Hill Crescent | IG8 9PN IG8 9PQ IG8 9PR IG8 9PW |
| Oak Hill Gardens | IG8 9DY |
| Sky Peals Road | IG8 9NE IG8 9NF |
| Tamworth Avenue | IG8 9RF |
| The Bridle Path | IG8 9LD |
| The Charter Road | IG8 9QU IG8 9RD IG8 9RE |
Transport near Hale End And Highams Park
-
Highams Park Station
-
Woodford Station
-
South Woodford Station
-
Wood Street Station
-
Snaresbrook Station
-
Roding Valley Station
-
Walthamstow Central Station
-
Chingford Station
-
Walthamstow Queens Road Station
-
Wanstead Station
- FAQ
- Price Paid By Year
- Property Type Price
Frequently asked questions about Hale End And Highams Park
What is the average price for a property for sale in Hale End And Highams Park?
The average price for a property for sale in Hale End And Highams Park is £700,013. This amount is 15% higher than the average price in Woodford Green. There are 1,600 property listings for sale in Hale End And Highams Park.
What streets have the most expensive properties for sale in Hale End And Highams Park?
The streets with the most expensive properties for sale in Hale End And Highams Park are High Road at an average of £3,615,000, The Charter Road at an average of £936,071 and Hollywood Way at an average of £833,000.
What streets have the most affordable properties for sale in Hale End And Highams Park?
The streets with the most affordable properties for sale in Hale End And Highams Park are Bridle Path at an average of £315,571, Oak Hill at an average of £577,589 and Alders Avenue at an average of £588,998.
Which train stations are available in or near Hale End And Highams Park?
Some of the train stations available in or near Hale End And Highams Park are Highams Park, Wood Street and Walthamstow Central.
Which tube stations are available in or near Hale End And Highams Park?
Some of the tube stations available in or near Hale End And Highams Park are Woodford, South Woodford and Snaresbrook.
Property Price Paid in Hale End And Highams Park by Year
The average sold property price by year was:
| Year | Average Sold Price | Price Change |
Sold Properties
|
|---|---|---|---|
| 2025 | £919,617 | 25% |
17 Properties |
| 2024 | £693,313 | 1% |
17 Properties |
| 2023 | £689,630 | 14% |
27 Properties |
| 2022 | £592,303 | -7% |
31 Properties |
| 2021 | £631,066 | 2% |
53 Properties |
| 2020 | £620,523 | 4% |
34 Properties |
| 2019 | £596,769 | -5% |
26 Properties |
| 2018 | £625,525 | 6% |
39 Properties |
| 2017 | £586,885 | 4% |
35 Properties |
| 2016 | £560,691 | 15% |
39 Properties |
| 2015 | £478,888 | 17% |
34 Properties |
| 2014 | £397,940 | 7% |
53 Properties |
| 2013 | £368,813 | -1% |
43 Properties |
| 2012 | £374,110 | 14% |
27 Properties |
| 2011 | £321,416 | -4% |
30 Properties |
| 2010 | £335,227 | 12% |
34 Properties |
| 2009 | £296,298 | -10% |
26 Properties |
| 2008 | £326,043 | -3% |
23 Properties |
| 2007 | £337,138 | 15% |
54 Properties |
| 2006 | £286,274 | -3% |
55 Properties |
| 2005 | £294,631 | 11% |
59 Properties |
| 2004 | £261,672 | 15% |
52 Properties |
| 2003 | £222,360 | 8% |
46 Properties |
| 2002 | £203,871 | 16% |
60 Properties |
| 2001 | £171,721 | 7% |
56 Properties |
| 2000 | £159,583 | 12% |
39 Properties |
| 1999 | £141,094 | 11% |
55 Properties |
| 1998 | £125,046 | 1% |
58 Properties |
| 1997 | £123,917 | 12% |
66 Properties |
| 1996 | £109,198 | 13% |
46 Properties |
| 1995 | £95,496 | - |
40 Properties |
Property Price per Property Type in Hale End And Highams Park
Here you can find historic sold price data in order to help with your property search.
The average Property Paid Price for specific property types in the last three years are:
| Property Type | Average Sold Price | Sold Properties |
|---|---|---|
| Semi Detached House | £752,746.00 | 32 Semi Detached Houses |
| Detached House | £1,337,916.00 | 6 Detached Houses |
| Terraced House | £687,145.00 | 40 Terraced Houses |
| Flat | £342,859.00 | 14 Flats |

