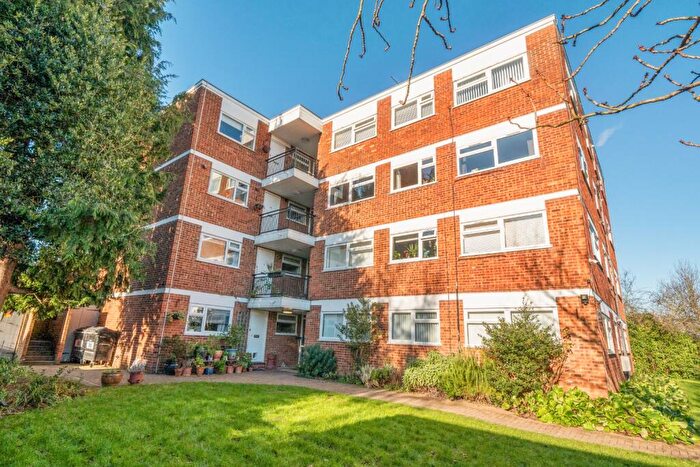
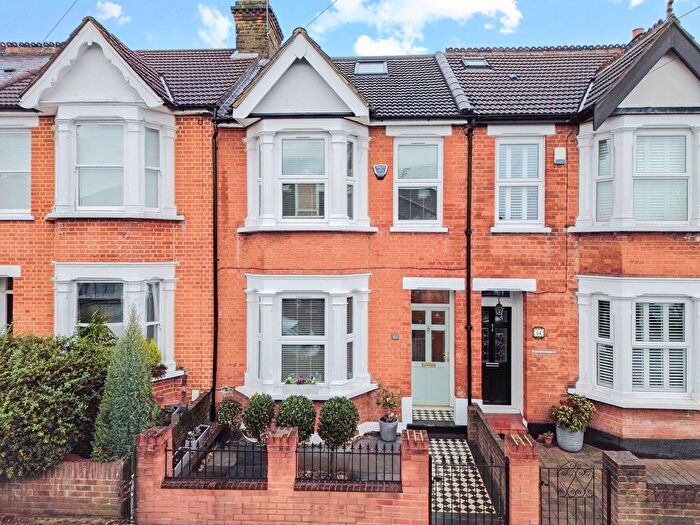
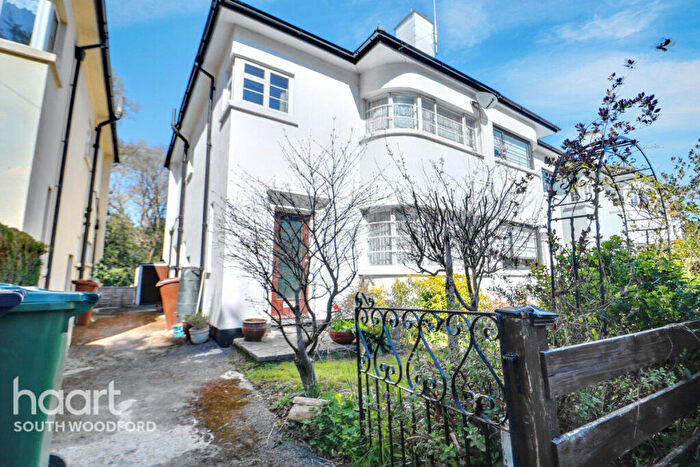
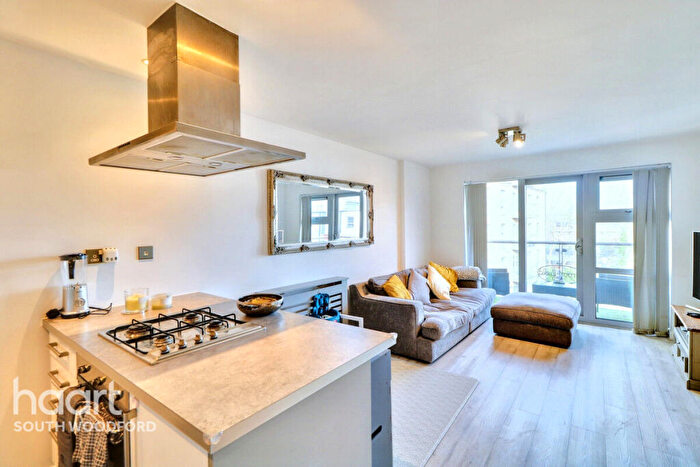
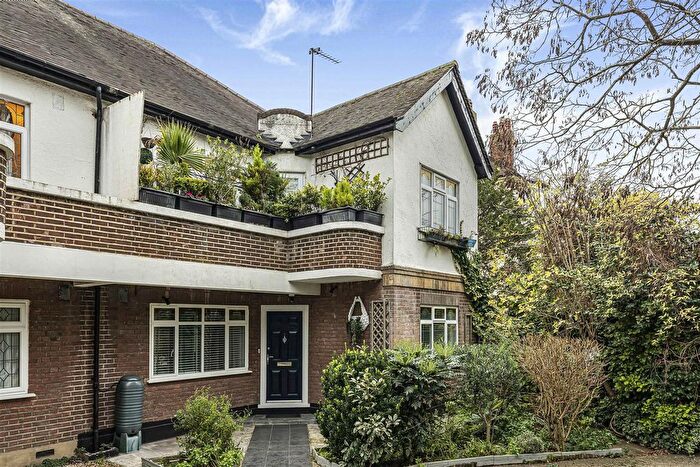
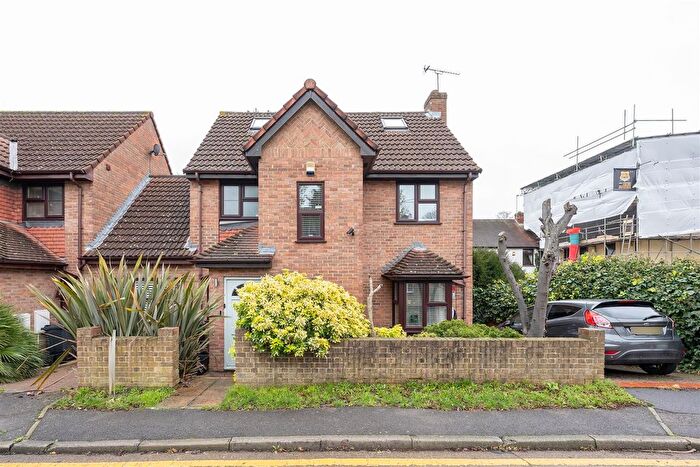
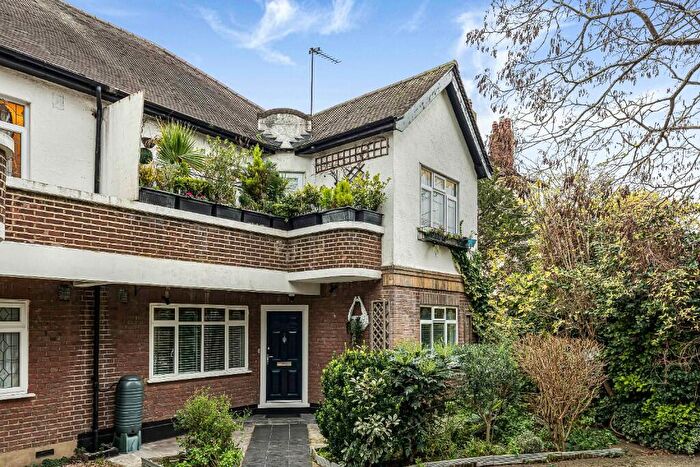
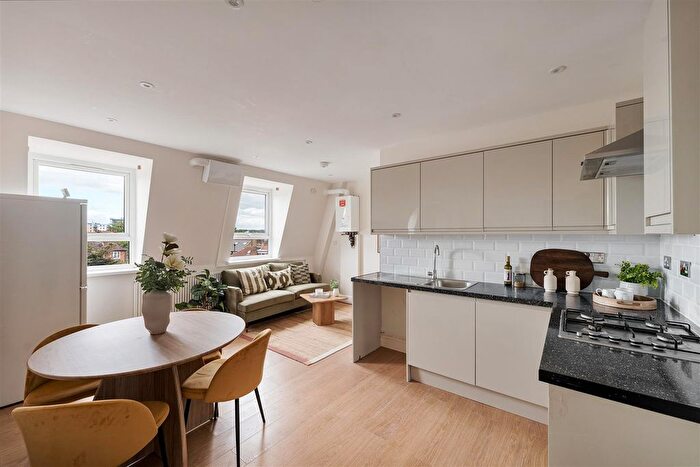
Houses for sale & to rent in Church End, Woodford Green
House Prices in Church End
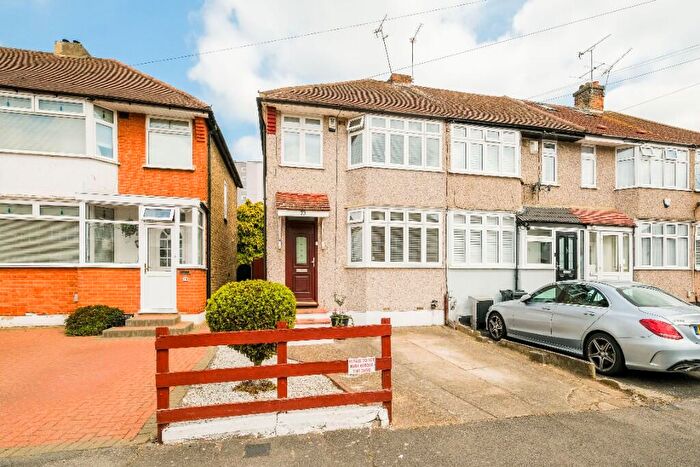
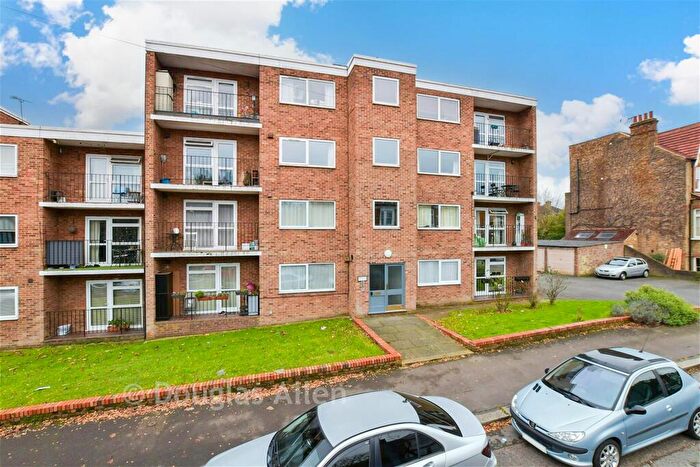
Properties in this part of Church End within Woodford Green have an average house price of £747,044.00 and had 157 Property Transactions within the last 3 years¹. This area has 1,272 households² , where the most expensive property was sold for £1,600,000.00.
Properties for sale in Church End
Roads and Postcodes in Church End
Navigate through our locations to find the location of your next house in Church End, Woodford Green for sale or to rent.
| Streets | Postcodes |
|---|---|
| Abbotsford Gardens | IG8 9HN IG8 9HP IG8 9HW |
| Arlington Road | IG8 9DE |
| Arundel Drive | IG8 9BY IG8 9BZ |
| Beverley Crescent | IG8 9DD |
| Broomhill Walk | IG8 9HF |
| Cavendish Avenue | IG8 9DA IG8 9DB |
| Clementine Walk | IG8 9GT |
| Darnley Road | IG8 9HU IG8 9HY |
| Eagle Terrace | IG8 9AT |
| Empress Avenue | IG8 9DZ IG8 9EA |
| Fairlawn Drive | IG8 9AW |
| Forest Approach | IG8 9BP IG8 9BS IG8 9BU IG8 9BW |
| Fullers Avenue | IG8 9EB |
| Harold Road | IG8 9HX |
| High Road | IG8 9EF IG8 9EG IG8 9FB IG8 9HH IG8 9HJ IG8 9HQ |
| Ingatestone Road | IG8 9AL IG8 9AN |
| Landscape Road | IG8 9AU |
| Parkland Road | IG8 9AP |
| Rokeby Gardens | IG8 9HR IG8 9HS IG8 9HT |
| Salway Close | IG8 9HL |
| Shenfield Road | IG8 9AR IG8 9AS |
| Somerset Close | IG8 9HZ |
| St Albans Crescent | IG8 9EH IG8 9EL |
| St Albans Road | IG8 9EQ |
| St Ronans Crescent | IG8 9DF IG8 9DG IG8 9DQ |
| The Roses | IG8 9BN |
| The Vale | IG8 9BT IG8 9BX |
| Trevor Road | IG8 9AJ |
| Warley Road | IG8 9AX |
| Wensley Avenue | IG8 9HE |
| Woodford New Road | IG8 9DX |
Transport near Church End
-
Woodford Station
-
South Woodford Station
-
Highams Park Station
-
Roding Valley Station
-
Snaresbrook Station
-
Wood Street Station
-
Wanstead Station
-
Redbridge Station
-
Buckhurst Hill Station
-
Chingford Station
- FAQ
- Price Paid By Year
- Property Type Price
Frequently asked questions about Church End
What is the average price for a property for sale in Church End?
The average price for a property for sale in Church End is £747,044. This amount is 16% higher than the average price in Woodford Green. There are 2,170 property listings for sale in Church End.
What streets have the most expensive properties for sale in Church End?
The streets with the most expensive properties for sale in Church End are Wensley Avenue at an average of £962,055, Darnley Road at an average of £934,000 and St Ronans Crescent at an average of £900,875.
What streets have the most affordable properties for sale in Church End?
The streets with the most affordable properties for sale in Church End are The Roses at an average of £380,110, Clementine Walk at an average of £385,700 and Cavendish Avenue at an average of £472,444.
Which train stations are available in or near Church End?
Some of the train stations available in or near Church End are Highams Park, Wood Street and Chingford.
Which tube stations are available in or near Church End?
Some of the tube stations available in or near Church End are Woodford, South Woodford and Roding Valley.
Property Price Paid in Church End by Year
The average sold property price by year was:
| Year | Average Sold Price | Price Change |
Sold Properties
|
|---|---|---|---|
| 2025 | £746,023 | 1% |
30 Properties |
| 2024 | £740,223 | 3% |
52 Properties |
| 2023 | £717,072 | -7% |
22 Properties |
| 2022 | £766,754 | 15% |
53 Properties |
| 2021 | £652,428 | 4% |
42 Properties |
| 2020 | £625,291 | -2% |
30 Properties |
| 2019 | £640,683 | 3% |
43 Properties |
| 2018 | £620,594 | -2% |
34 Properties |
| 2017 | £631,305 | 8% |
35 Properties |
| 2016 | £583,662 | 13% |
43 Properties |
| 2015 | £507,274 | 10% |
39 Properties |
| 2014 | £456,002 | 4% |
39 Properties |
| 2013 | £435,508 | 7% |
58 Properties |
| 2012 | £404,838 | -1% |
31 Properties |
| 2011 | £407,599 | 6% |
35 Properties |
| 2010 | £381,706 | 12% |
46 Properties |
| 2009 | £335,079 | -5% |
37 Properties |
| 2008 | £352,422 | -12% |
48 Properties |
| 2007 | £394,827 | 11% |
66 Properties |
| 2006 | £351,703 | 13% |
62 Properties |
| 2005 | £306,495 | 10% |
59 Properties |
| 2004 | £277,312 | -9% |
99 Properties |
| 2003 | £301,131 | 15% |
53 Properties |
| 2002 | £255,442 | 15% |
62 Properties |
| 2001 | £216,428 | 13% |
59 Properties |
| 2000 | £189,349 | 13% |
47 Properties |
| 1999 | £165,500 | 18% |
63 Properties |
| 1998 | £135,129 | 16% |
68 Properties |
| 1997 | £113,274 | 1% |
66 Properties |
| 1996 | £112,649 | 10% |
56 Properties |
| 1995 | £101,363 | - |
51 Properties |
Property Price per Property Type in Church End
Here you can find historic sold price data in order to help with your property search.
The average Property Paid Price for specific property types in the last three years are:
| Property Type | Average Sold Price | Sold Properties |
|---|---|---|
| Semi Detached House | £858,741.00 | 70 Semi Detached Houses |
| Detached House | £1,031,200.00 | 10 Detached Houses |
| Terraced House | £768,425.00 | 47 Terraced Houses |
| Flat | £358,200.00 | 30 Flats |

