
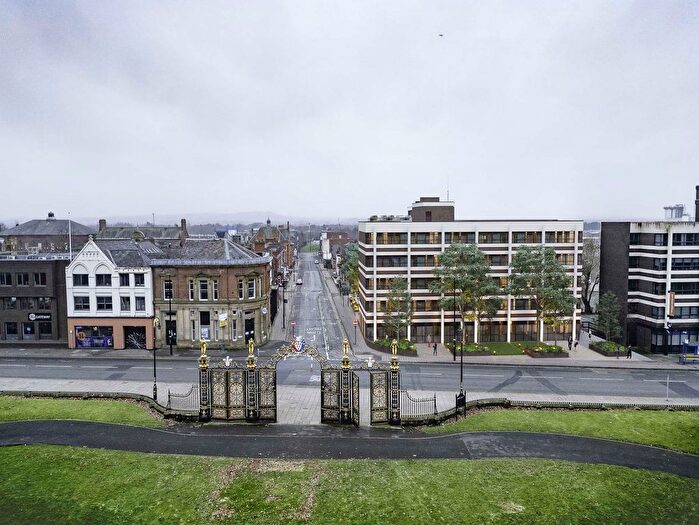
Houses for sale & to rent in Bewsey And Whitecross, Warrington
House Prices in Bewsey And Whitecross
Properties in Bewsey And Whitecross have an average house price of £156k and had 600 Property Transactions within the last 3 years¹.
Bewsey And Whitecross is an area in Warrington, Warrington with 5,508 households², where the most expensive property was sold for £395k.
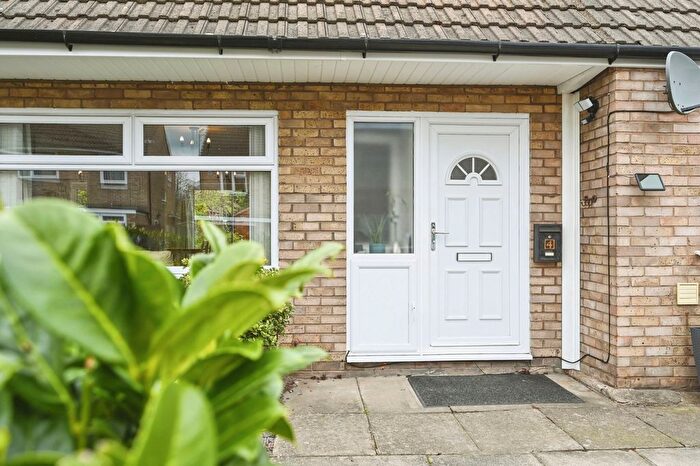
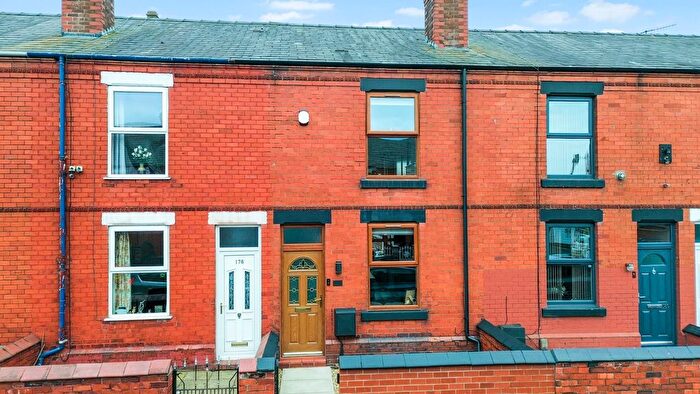
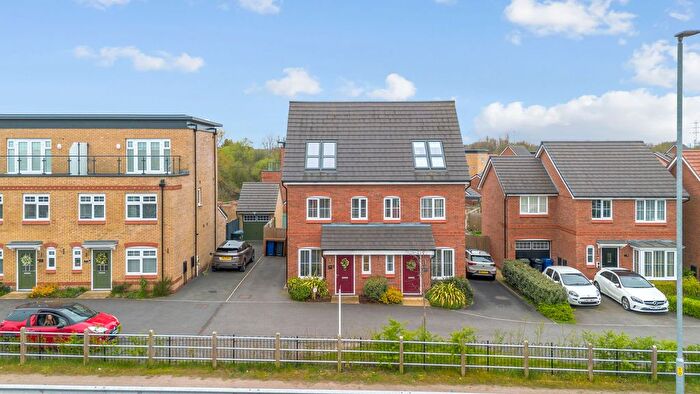
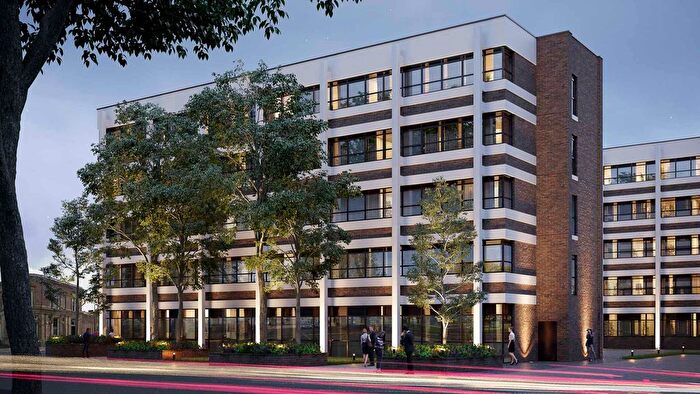
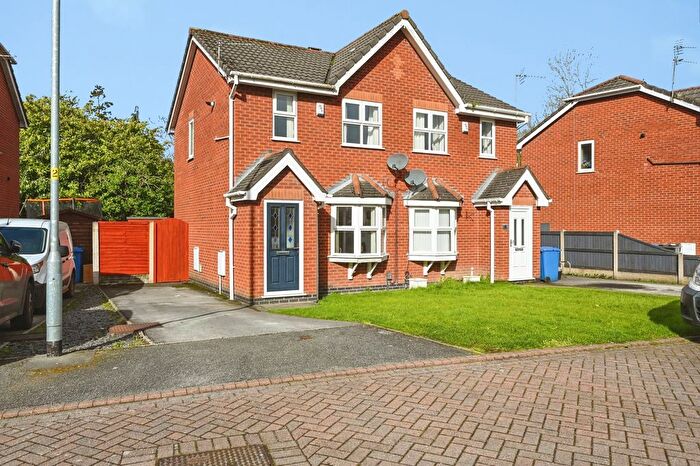
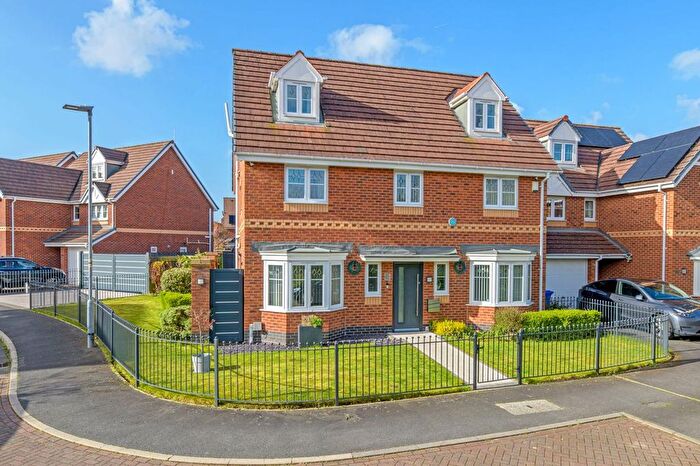
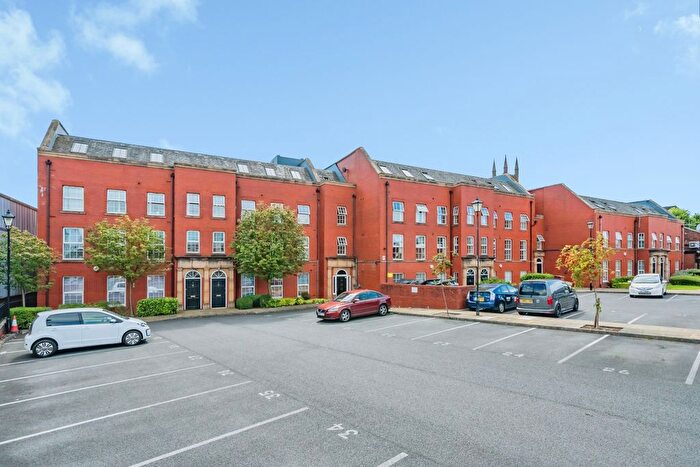
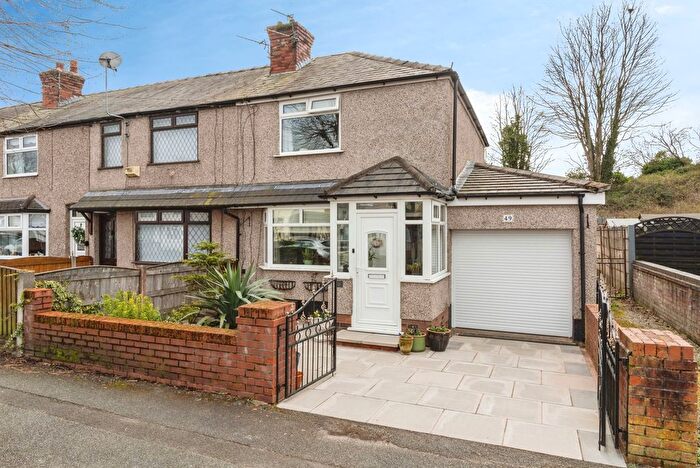
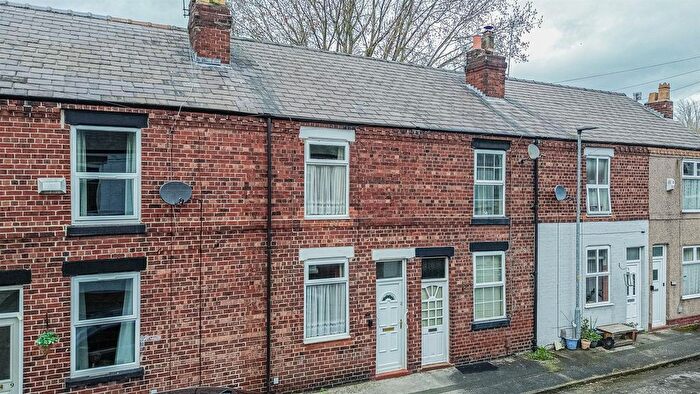
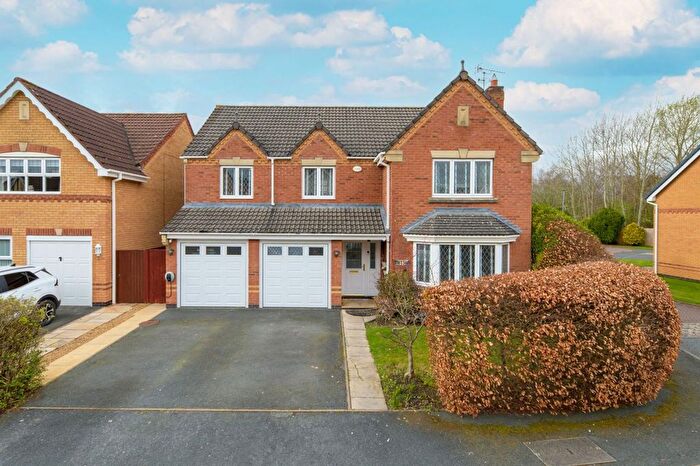
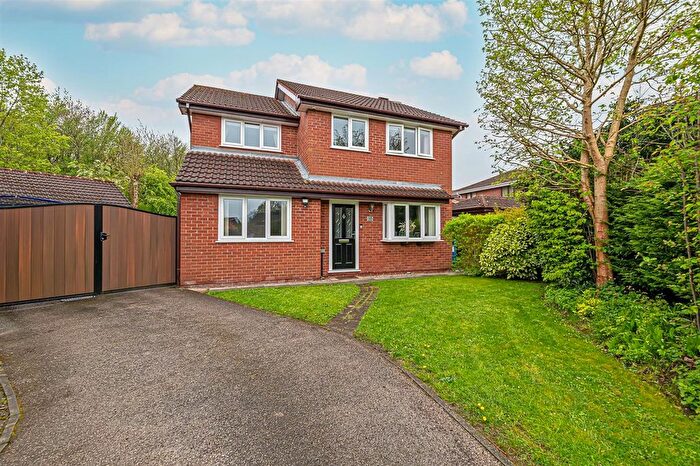
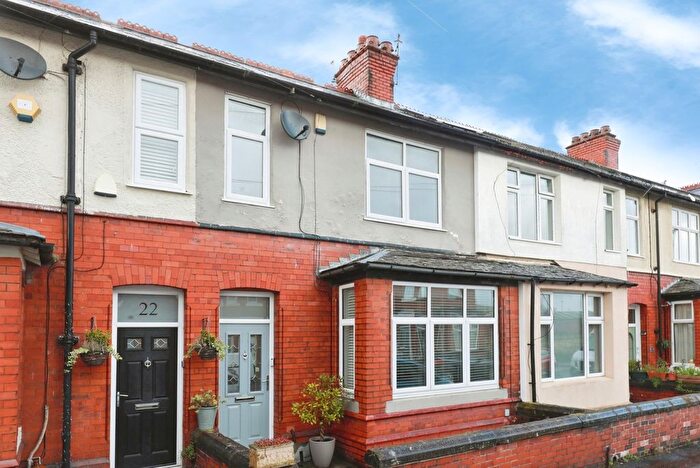
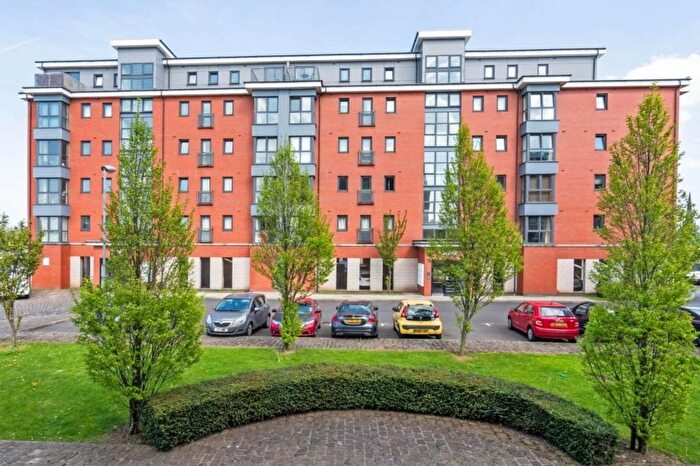
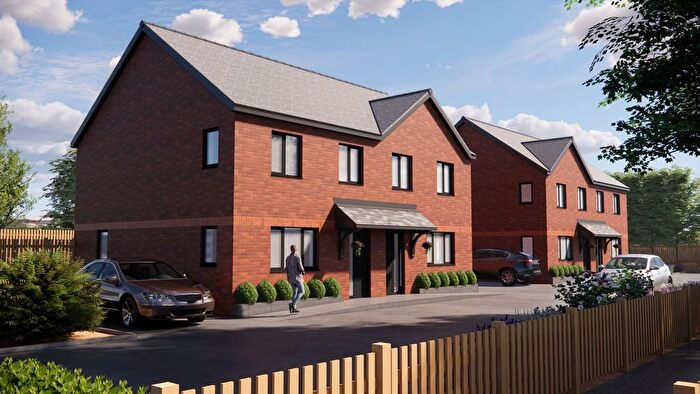
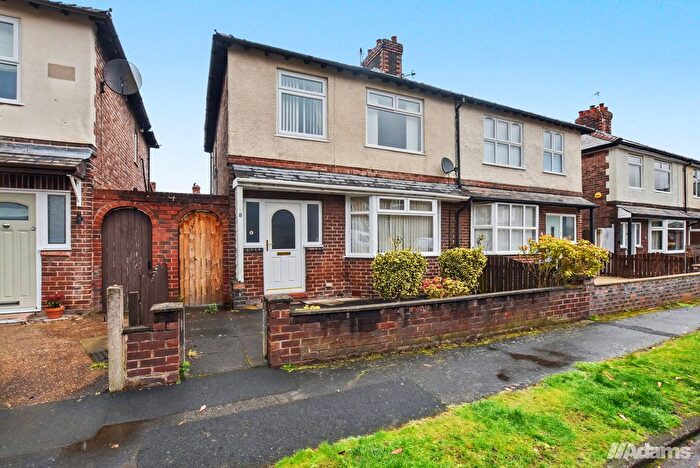
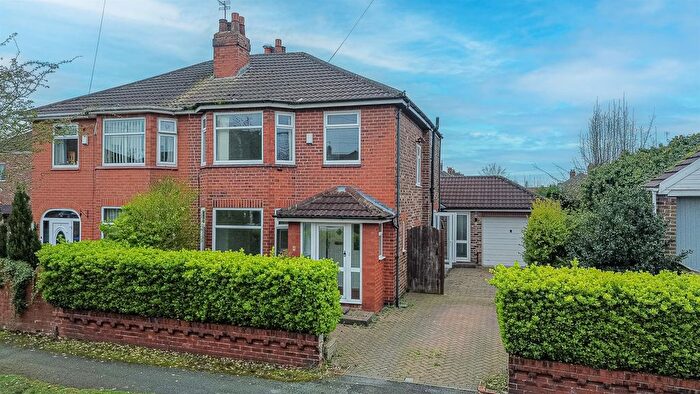
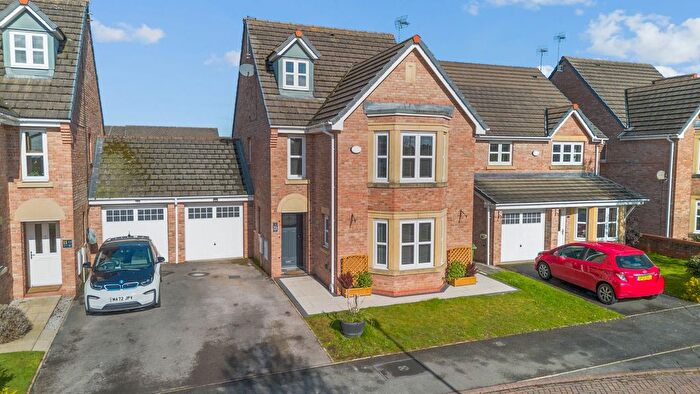
Properties for sale in Bewsey And Whitecross
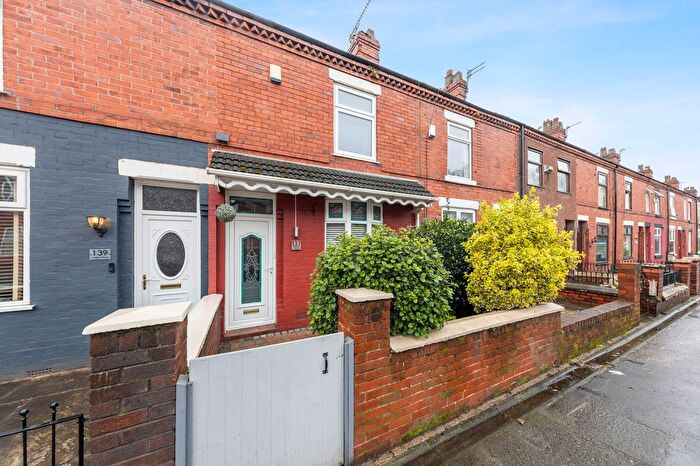
![]()
If you are looking to sell your house, let it out, or receive a property valuation, an expert can help you.
Click the button below to get started.

Roads and Postcodes in Bewsey And Whitecross
Navigate through our locations to find the location of your next house in Bewsey And Whitecross, Warrington for sale or to rent.
Transport near Bewsey And Whitecross

- FAQ
- Price Paid By Year
- Property Type Price
Frequently asked questions about Bewsey And Whitecross
What is the average price for a property for sale in Bewsey And Whitecross?
The average price for a property for sale in Bewsey And Whitecross is £155,839. This amount is 41% lower than the average price in Warrington. There are 2,644 property listings for sale in Bewsey And Whitecross.
What streets have the most expensive properties for sale in Bewsey And Whitecross?
The streets with the most expensive properties for sale in Bewsey And Whitecross are Danby Close at an average of £319,000, Honeysuckle Avenue at an average of £316,237 and Bold Street at an average of £290,000.
What streets have the most affordable properties for sale in Bewsey And Whitecross?
The streets with the most affordable properties for sale in Bewsey And Whitecross are Rylands Street at an average of £72,000, Baxter Street at an average of £72,000 and High Gates Close at an average of £89,333.
Which train stations are available in or near Bewsey And Whitecross?
Some of the train stations available in or near Bewsey And Whitecross are Warrington Central, Warrington Bank Quay and Sankey For Penketh.
Property Price Paid in Bewsey And Whitecross by Year
The average sold property price by year was:
| Year | Average Sold Price | Price Change |
Sold Properties
|
|---|---|---|---|
| 2026 | £212,000 | 21% |
2 Properties |
| 2025 | £168,198 | 16% |
187 Properties |
| 2024 | £142,022 | -11% |
202 Properties |
| 2023 | £157,597 | -3% |
209 Properties |
| 2022 | £161,992 | 15% |
253 Properties |
| 2021 | £137,408 | 7% |
236 Properties |
| 2020 | £127,915 | 5% |
188 Properties |
| 2019 | £121,798 | -2% |
181 Properties |
| 2018 | £124,151 | 11% |
202 Properties |
| 2017 | £109,925 | -1% |
281 Properties |
| 2016 | £111,260 | 2% |
296 Properties |
| 2015 | £108,990 | 14% |
215 Properties |
| 2014 | £93,828 | 1% |
185 Properties |
| 2013 | £92,759 | -10% |
141 Properties |
| 2012 | £102,323 | 3% |
142 Properties |
| 2011 | £99,332 | -4% |
121 Properties |
| 2010 | £103,170 | -7% |
122 Properties |
| 2009 | £110,625 | -11% |
129 Properties |
| 2008 | £122,318 | -8% |
285 Properties |
| 2007 | £132,118 | 4% |
542 Properties |
| 2006 | £127,386 | 10% |
499 Properties |
| 2005 | £114,285 | 23% |
295 Properties |
| 2004 | £87,983 | 14% |
246 Properties |
| 2003 | £75,841 | 20% |
404 Properties |
| 2002 | £60,564 | 22% |
316 Properties |
| 2001 | £47,170 | 2% |
237 Properties |
| 2000 | £46,281 | 14% |
201 Properties |
| 1999 | £39,779 | -17% |
158 Properties |
| 1998 | £46,444 | 5% |
230 Properties |
| 1997 | £44,042 | 15% |
199 Properties |
| 1996 | £37,387 | 6% |
168 Properties |
| 1995 | £35,302 | - |
147 Properties |
Property Price per Property Type in Bewsey And Whitecross
Here you can find historic sold price data in order to help with your property search.
The average Property Paid Price for specific property types in the last three years are:
| Property Type | Average Sold Price | Sold Properties |
|---|---|---|
| Semi Detached House | £179,764.00 | 106 Semi Detached Houses |
| Detached House | £276,310.00 | 33 Detached Houses |
| Terraced House | £150,269.00 | 332 Terraced Houses |
| Flat | £119,695.00 | 129 Flats |