
Houses for sale & to rent in Orford, Warrington
House Prices in Orford
Properties in Orford have an average house price of £182k and had 347 Property Transactions within the last 3 years¹.
Orford is an area in Warrington, Warrington with 4,537 households², where the most expensive property was sold for £720k.
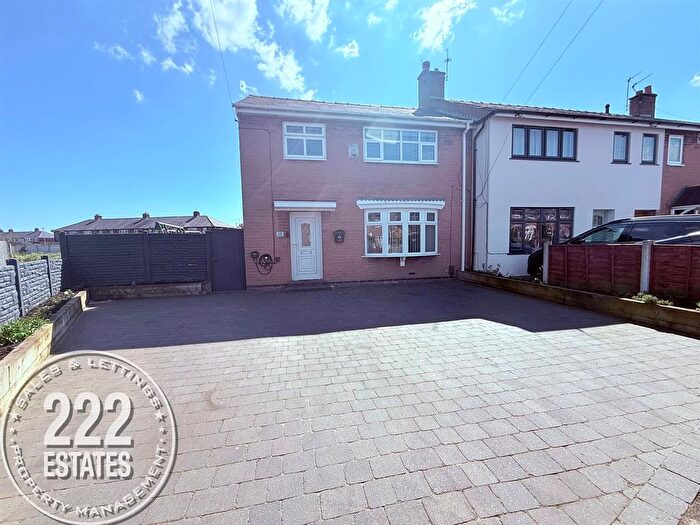
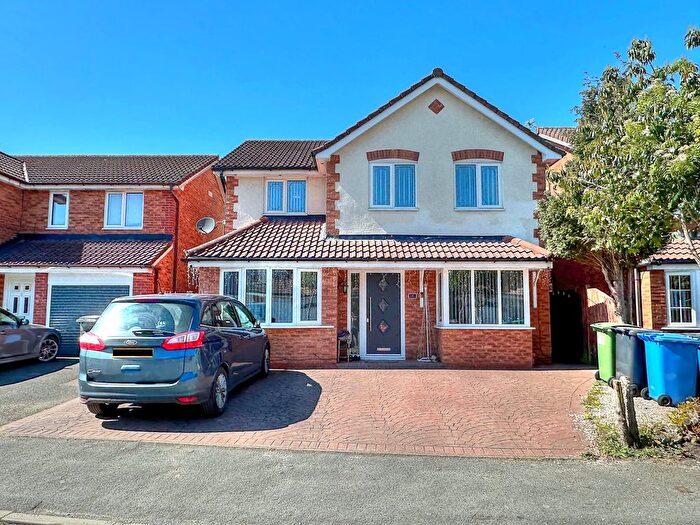
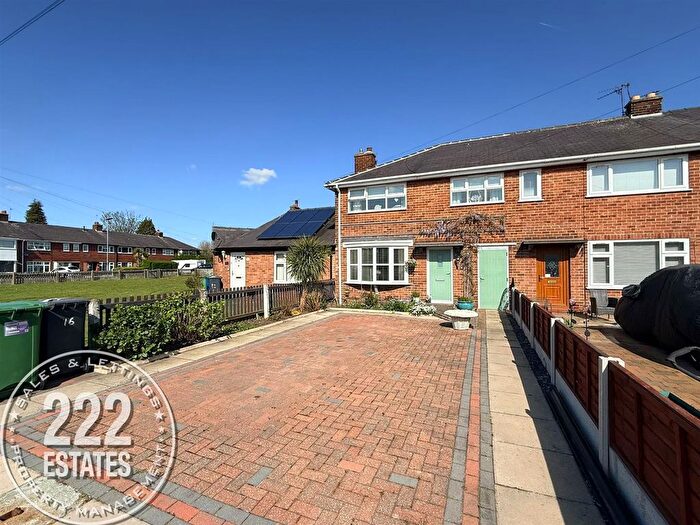
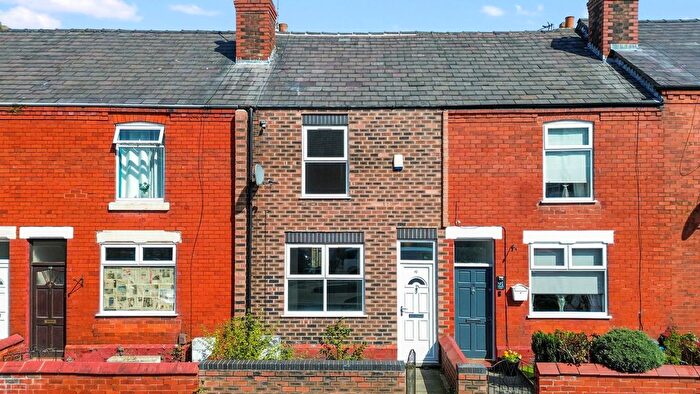
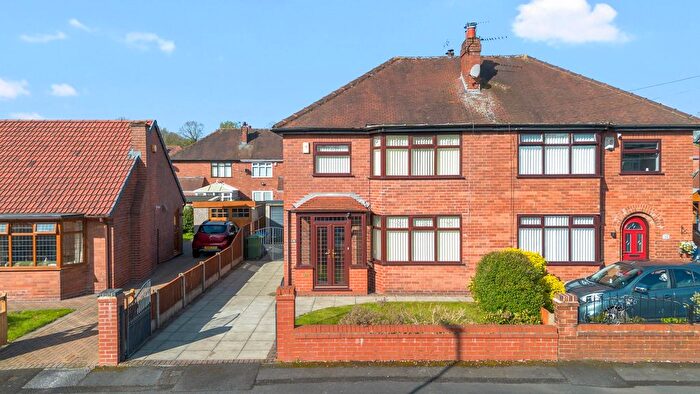
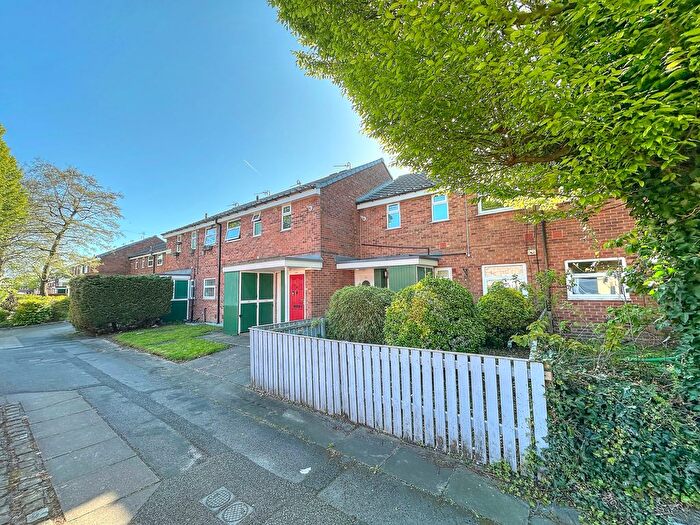
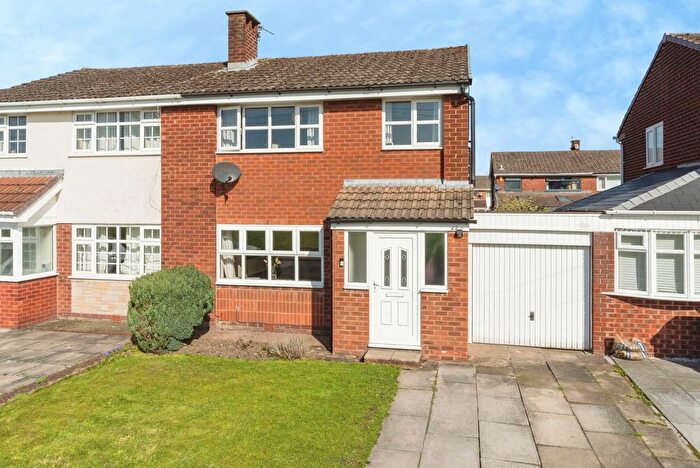
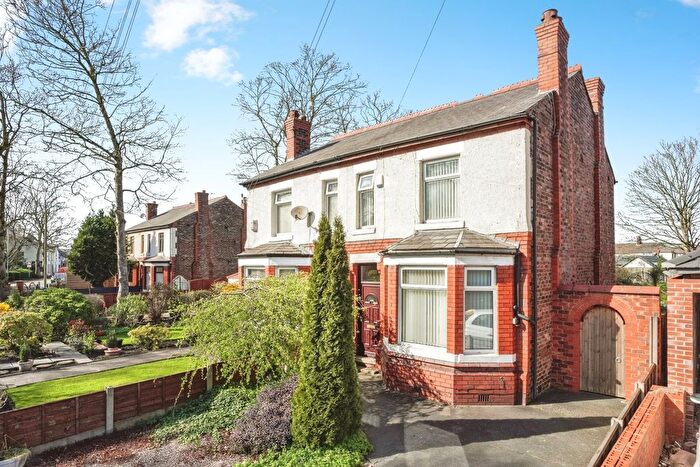
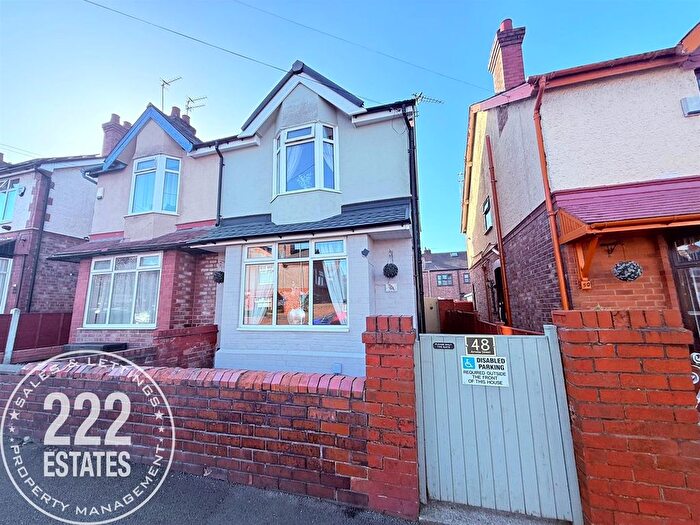
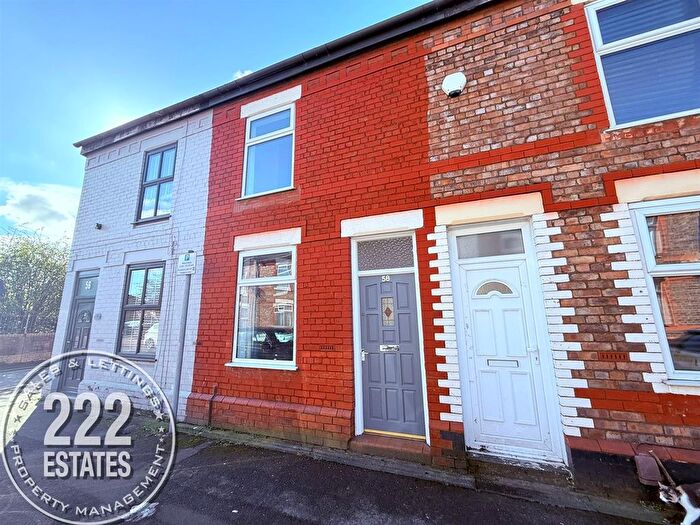
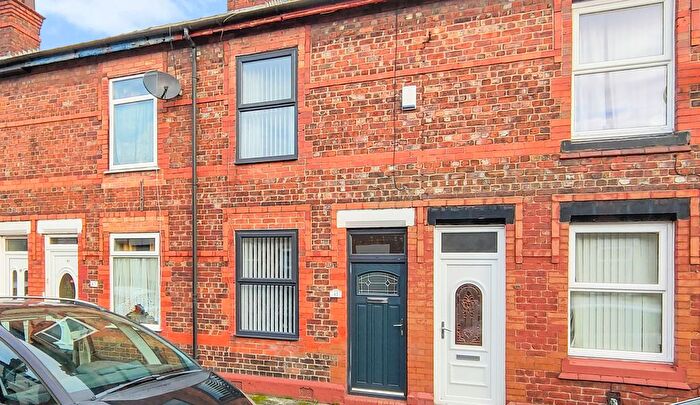
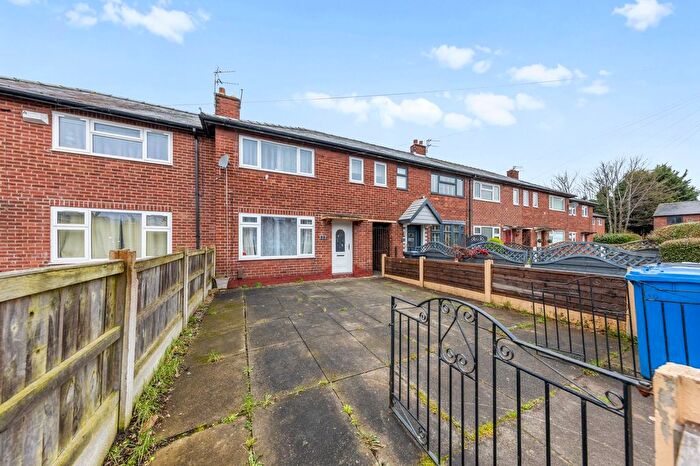
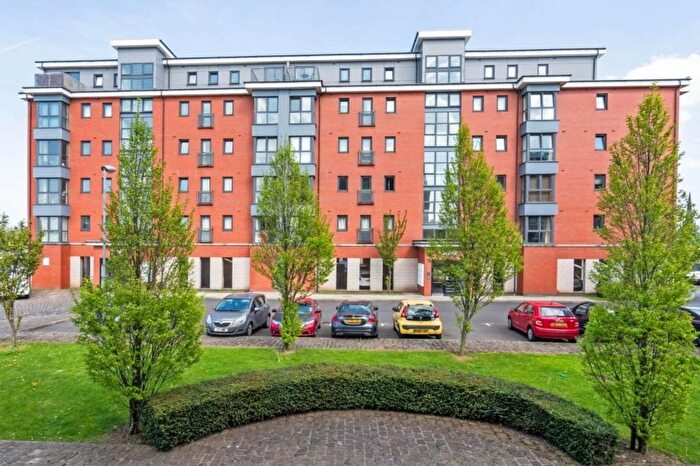
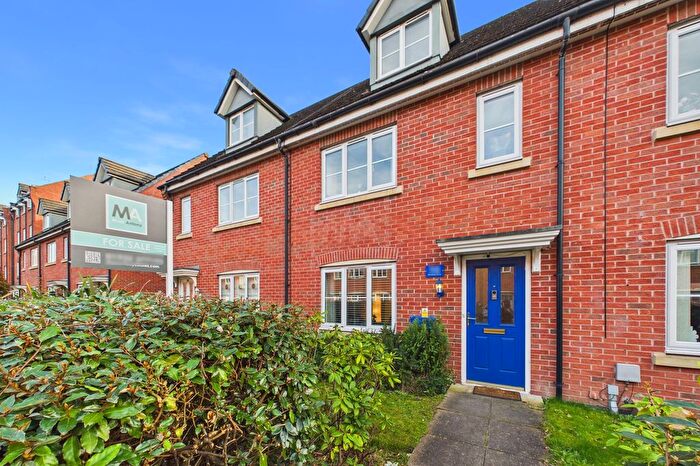
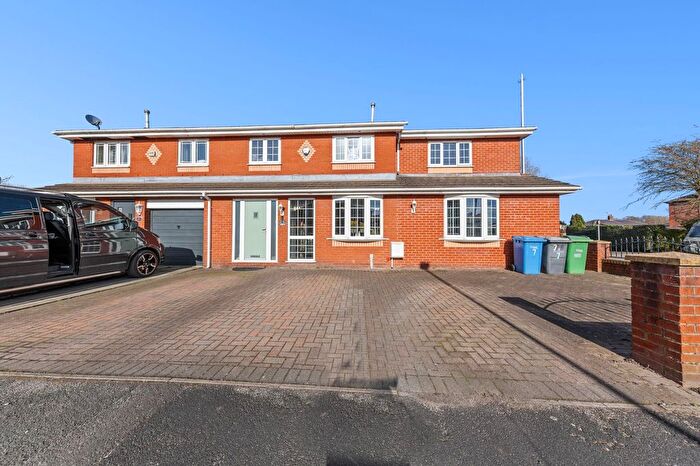
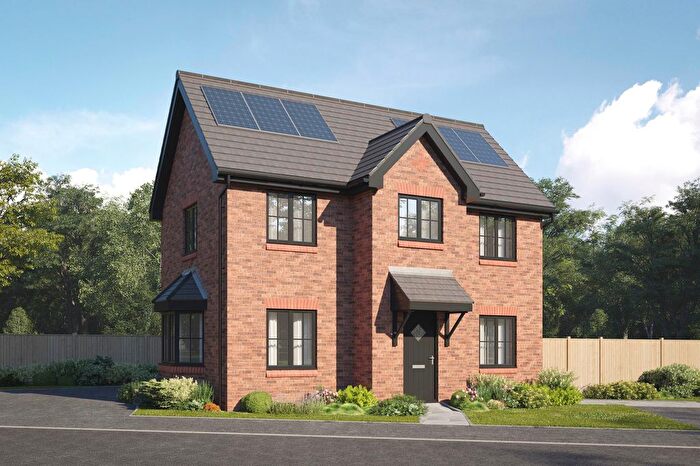
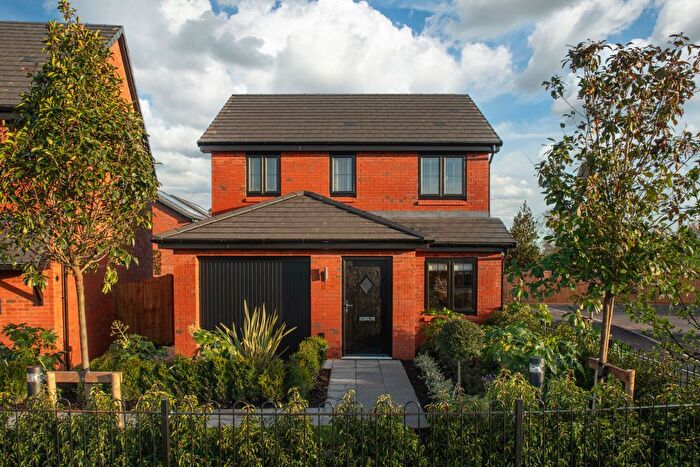
Properties for sale in Orford
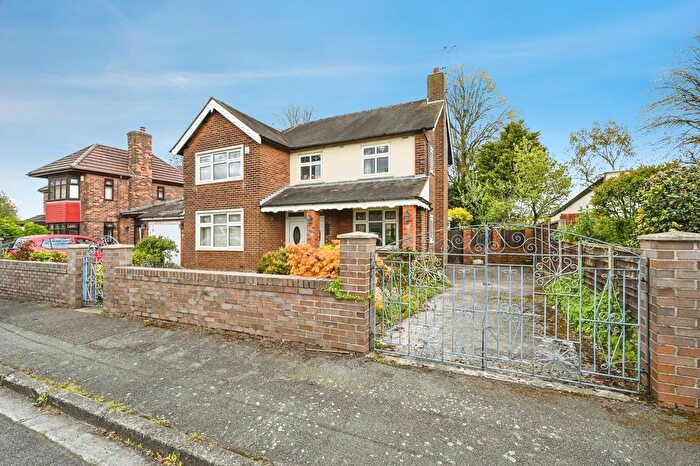
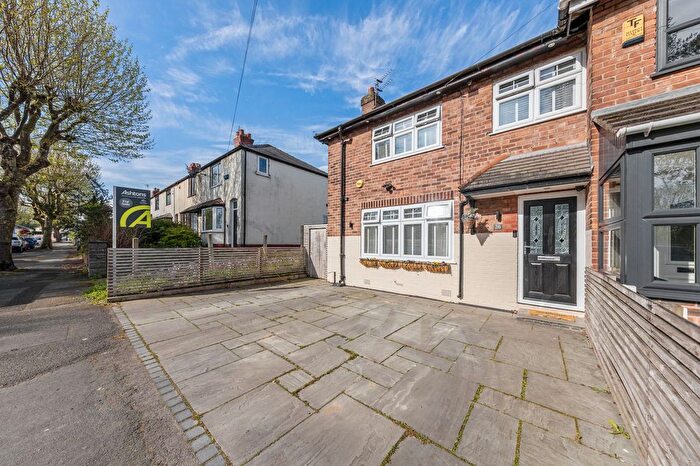
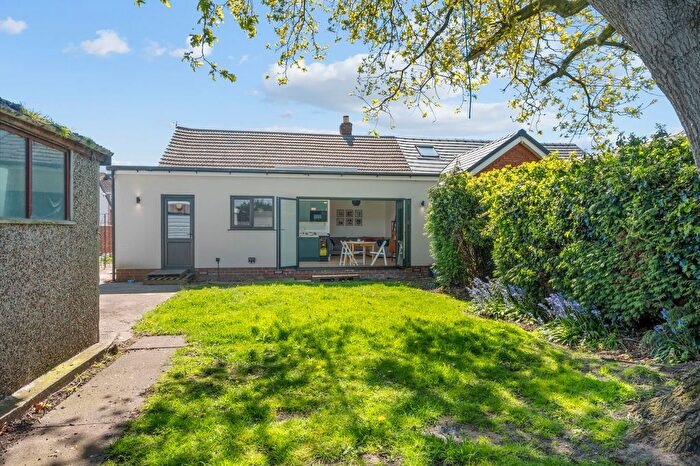
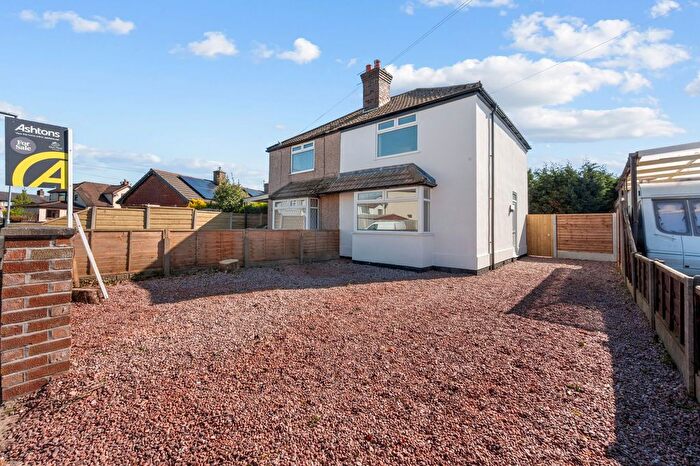
![]()
If you are looking to sell your house, let it out, or receive a property valuation, an expert can help you.
Click the button below to get started.

Roads and Postcodes in Orford
Navigate through our locations to find the location of your next house in Orford, Warrington for sale or to rent.
| Streets | Postcodes |
|---|---|
| Achilles Avenue | WA2 9RW |
| Adam Street | WA2 7QF |
| Ajax Avenue | WA2 9RN |
| Alamein Crescent | WA2 7PU |
| Alder Crescent | WA2 8AQ |
| Alder Lane | WA2 8AB WA2 8AG WA2 8AH WA2 8AP WA2 8AW WA2 8BU WA2 8BH WA2 8HP WA2 8HR WA2 8HS WA2 8HT WA2 8HU |
| Amelia Street | WA2 7QA WA2 7QD |
| Armour Avenue | WA2 9QR |
| Arnhem Crescent | WA2 7PT |
| Ashbrook Crescent | WA2 8DZ |
| Beatty Avenue | WA2 9NY |
| Birtles Road | WA2 9AG WA2 9AQ |
| Brandwood Avenue | WA2 9RP |
| Brian Avenue | WA2 8HA |
| Bruce Avenue | WA2 9BB |
| Burns Grove | WA2 9DT |
| Burton Road | WA2 9AJ |
| Byron Court | WA2 9DS |
| Caldbeck Avenue | WA2 9EN |
| Capesthorne Road | WA2 9AF WA2 9AP WA2 9AU WA2 9AW WA2 9AR WA2 9LN |
| Central Avenue | WA2 7PR WA2 8AE WA2 8AJ WA2 8BD |
| Clive Avenue | WA2 9NX |
| Clough Avenue | WA2 9PH |
| Cooper Avenue | WA2 9RA |
| Corbet Avenue | WA2 8BW |
| Cossack Avenue | WA2 9PB |
| Cowdell Street | WA2 7PP |
| Cross Street | WA2 7PL |
| Crowe Avenue | WA2 9RD WA2 9RE |
| Currans Road | WA2 9RS |
| Dean Crescent | WA2 9QU |
| Densham Avenue | WA2 9PW WA2 9PX WA2 9PY WA2 9PL WA2 9PN WA2 9PP WA2 9PR |
| Dorothea Street | WA2 7PS |
| Dryden Place | WA2 9DA |
| Earl Street | WA2 7PW |
| East Avenue | WA2 8AD |
| Ferguson Drive | WA2 8EQ |
| Festival Avenue | WA2 9EG WA2 9EP WA2 9ER WA2 9EQ |
| Festival Crescent | WA2 9ES |
| Fieldview Drive | WA2 9BP |
| Fisher Avenue | WA2 9PA WA2 9PF WA2 9PQ WA2 9PG |
| Fitzherbert Street | WA2 7PN WA2 7QG |
| Floyd Drive | WA2 8DB |
| Garner Street | WA2 7RB |
| Gough Avenue | WA2 9QS WA2 9RL WA2 9RR WA2 9QP |
| Grace Avenue | WA2 8BT |
| Hale Street | WA2 7PH |
| Hallfields Road | WA2 8DL WA2 8DN WA2 8DS WA2 8DH |
| Hallows Avenue | WA2 8DU WA2 8EE WA2 8EG WA2 8EJ |
| Halsall Avenue | WA2 8EY |
| Hughes Avenue | WA2 9EH WA2 9EL WA2 9EW |
| Hughes Place | WA2 9EJ |
| Hunter Avenue | WA2 9RQ |
| Ireland Street | WA2 8HL |
| Jubilee Way | WA2 8HE |
| Keats Grove | WA2 9DU |
| Kipling Avenue | WA2 9DD |
| Lathom Avenue | WA2 8AL WA2 8AZ |
| Locker Avenue | WA2 9PS WA2 9PT |
| Long Lane | WA2 8PS WA2 8PT WA2 8PU WA2 8PX WA2 8PY WA2 8QB |
| Longfield Gardens | WA2 8LU |
| Longfield Road | WA2 8LY |
| Longford Street | WA2 7PX WA2 7PG WA2 7QZ |
| Lyndale Avenue | WA2 8EP |
| Malcolm Avenue | WA2 8EF |
| Marina Drive | WA2 9NU |
| Marron Avenue | WA2 9QT |
| Marsh House Lane | WA2 7QP |
| Mckee Avenue | WA2 9QX WA2 9RG |
| Melville Close | WA2 7DS |
| Milvain Drive | WA2 9NZ |
| Morgan Avenue | WA2 9DW WA2 9DN |
| Mortimer Avenue | WA2 8AN WA2 8BA |
| Neville Avenue | WA2 9AX WA2 9AY WA2 9BE WA2 9BG WA2 9BH WA2 9BQ |
| Norbury Avenue | WA2 8EB |
| Norris Street | WA2 7RJ WA2 7RL |
| North Avenue | WA2 8BJ WA2 8BN WA2 8BS WA2 8BL |
| Northway | WA2 9PZ WA2 9QA WA2 9QB WA2 9QD WA2 9QH WA2 9QQ WA2 9QG |
| O'leary Street | WA2 7RH |
| Oliver Street | WA2 7FY |
| Orford Avenue | WA2 7QH WA2 7QJ WA2 7QL WA2 7QN WA2 7QQ |
| Orford Green | WA2 8PA WA2 8PB WA2 8PD WA2 8PF WA2 8PJ WA2 8PL WA2 8PQ WA2 8PE WA2 8PH |
| Orford Lane | WA2 7BB WA2 7AB WA2 7AH |
| Orford Road | WA2 7SY WA2 7TH |
| Osborne Avenue | WA2 9BJ |
| Park Road | WA2 9AN WA2 9AZ WA2 9BA WA2 9BD |
| Poole Avenue | WA2 9QZ WA2 9RB |
| Poole Crescent | WA2 9PU |
| Poplars Avenue | WA2 9LH WA2 9LJ WA2 9LL WA2 9LW WA2 9LX |
| Poplars Place | WA2 9LP |
| Povey Road | WA2 9AE |
| Primrose Close | WA2 9BS |
| Rhodes Street | WA2 7QE |
| Roome Street | WA2 7RA |
| Roscoe Avenue | WA2 8DX WA2 8DY |
| Ruskin Avenue | WA2 9DB |
| Sandy Lane | WA2 9BX WA2 9BY WA2 9DE WA2 9DX WA2 9HU WA2 9JA WA2 9BN WA2 9DR WA2 9HX |
| Sandy Lane West | WA2 9SA |
| School Road | WA2 8PN WA2 9AB WA2 9AD WA2 9BW |
| Shakespeare Grove | WA2 9PD |
| Shaws Avenue | WA2 8AF WA2 8AT WA2 8AU WA2 8AX WA2 8BB |
| Sinclair Avenue | WA2 9QY WA2 9RF |
| Small Avenue | WA2 9ET WA2 9EU |
| Small Crescent | WA2 9EX |
| Smith Crescent | WA2 8EN |
| Smith Drive | WA2 8EL WA2 8ER WA2 8ES WA2 8EW |
| South Avenue | WA2 8AR WA2 8AS WA2 8BQ |
| St Benedicts Close | WA2 7AQ |
| St Margarets Avenue | WA2 8DT |
| St Stephens Avenue | WA2 9RH |
| Stapleton Avenue | WA2 8EZ |
| Statham Avenue | WA2 9DP WA2 9ED WA2 9EF |
| Sylvia Crescent | WA2 8EH |
| Synge Street | WA2 7QB |
| Tennyson Drive | WA2 9BZ |
| The Coppins | WA2 9DY |
| Tomlinson Avenue | WA2 8EA WA2 8ED |
| Vale Avenue | WA2 8AY |
| Vale Owen Road | WA2 8PG |
| Wainwright Court | WA2 9AS |
| Walpole Grove | WA2 9PE |
| Warren Road | WA2 9AL |
| Warrington Business Park | WA2 8TX |
| West Avenue | WA2 8BE WA2 8BG |
| Wilkinson Street | WA2 7RD WA2 7RF WA2 7RG |
| Winstanley Industrial Estate | WA2 8PR |
| Winwick Road | WA2 8QE WA2 8QF WA2 7PE WA2 7PF WA2 8HH WA2 8HN WA2 8HW WA2 8HY WA2 8QA |
| Withers Avenue | WA2 8ET WA2 8EU WA2 8EX |
| Woodcote Close | WA2 9AH |
Transport near Orford
-
 Warrington Central Station
 -
Padgate Station
-
Warrington Bank Quay Station
-
Birchwood Station
-
Sankey For Penketh Station
- FAQ
- Price Paid By Year
- Property Type Price
Frequently asked questions about Orford
What is the average price for a property for sale in Orford?
The average price for a property for sale in Orford is £181,861. This amount is 32% lower than the average price in Warrington. There are 1,150 property listings for sale in Orford.
What streets have the most expensive properties for sale in Orford?
The streets with the most expensive properties for sale in Orford are Marina Drive at an average of £292,500, Longfield Gardens at an average of £290,000 and Tomlinson Avenue at an average of £257,000.
What streets have the most affordable properties for sale in Orford?
The streets with the most affordable properties for sale in Orford are Clough Avenue at an average of £90,000, Marsh House Lane at an average of £103,000 and Cross Street at an average of £112,500.
Which train stations are available in or near Orford?
Some of the train stations available in or near Orford are Warrington Central, Padgate and Warrington Bank Quay.
Property Price Paid in Orford by Year
The average sold property price by year was:
| Year | Average Sold Price | Price Change |
Sold Properties
|
|---|---|---|---|
| 2026 | £191,900 | 3% |
10 Properties |
| 2025 | £186,511 | 5% |
114 Properties |
| 2024 | £177,389 | -2% |
123 Properties |
| 2023 | £181,056 | 5% |
100 Properties |
| 2022 | £171,935 | 16% |
146 Properties |
| 2021 | £145,021 | 9% |
139 Properties |
| 2020 | £131,937 | 6% |
111 Properties |
| 2019 | £124,251 | 4% |
129 Properties |
| 2018 | £119,708 | 5% |
107 Properties |
| 2017 | £113,859 | 7% |
147 Properties |
| 2016 | £105,354 | -0,3% |
128 Properties |
| 2015 | £105,632 | 5% |
106 Properties |
| 2014 | £100,227 | 3% |
120 Properties |
| 2013 | £97,509 | 3% |
102 Properties |
| 2012 | £94,306 | 2% |
82 Properties |
| 2011 | £92,529 | - |
77 Properties |
| 2010 | £92,574 | -6% |
68 Properties |
| 2009 | £97,684 | -15% |
47 Properties |
| 2008 | £112,039 | 2% |
72 Properties |
| 2007 | £109,385 | 4% |
195 Properties |
| 2006 | £105,043 | 3% |
180 Properties |
| 2005 | £101,724 | 7% |
120 Properties |
| 2004 | £94,773 | 15% |
168 Properties |
| 2003 | £80,960 | 27% |
185 Properties |
| 2002 | £58,825 | 19% |
189 Properties |
| 2001 | £47,888 | 4% |
138 Properties |
| 2000 | £45,941 | 10% |
175 Properties |
| 1999 | £41,334 | 4% |
135 Properties |
| 1998 | £39,630 | 3% |
117 Properties |
| 1997 | £38,609 | -0,4% |
124 Properties |
| 1996 | £38,755 | -2% |
105 Properties |
| 1995 | £39,385 | - |
97 Properties |
Property Price per Property Type in Orford
Here you can find historic sold price data in order to help with your property search.
The average Property Paid Price for specific property types in the last three years are:
| Property Type | Average Sold Price | Sold Properties |
|---|---|---|
| Flat | £93,500.00 | 2 Flats |
| Semi Detached House | £200,342.00 | 177 Semi Detached Houses |
| Detached House | £263,650.00 | 10 Detached Houses |
| Terraced House | £157,099.00 | 158 Terraced Houses |