Houses for sale & to rent in Atherstone North, Atherstone
House Prices in Atherstone North
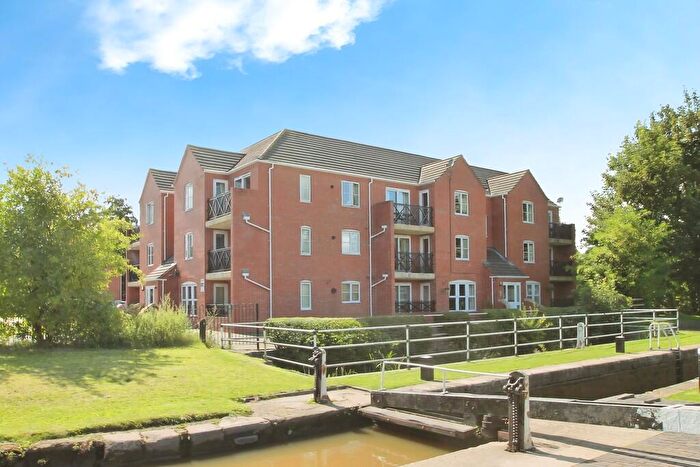
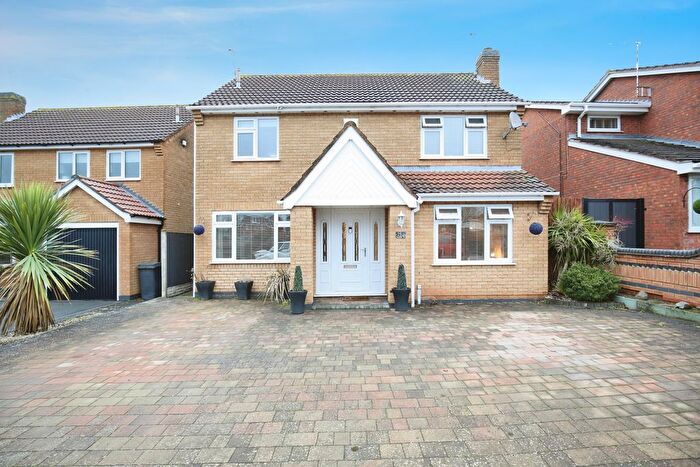
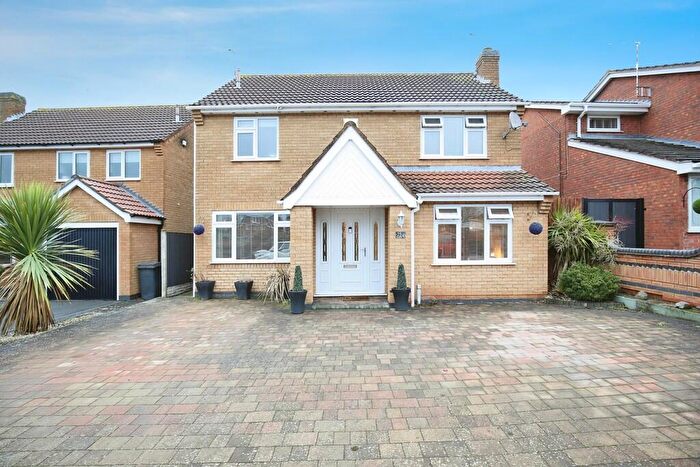
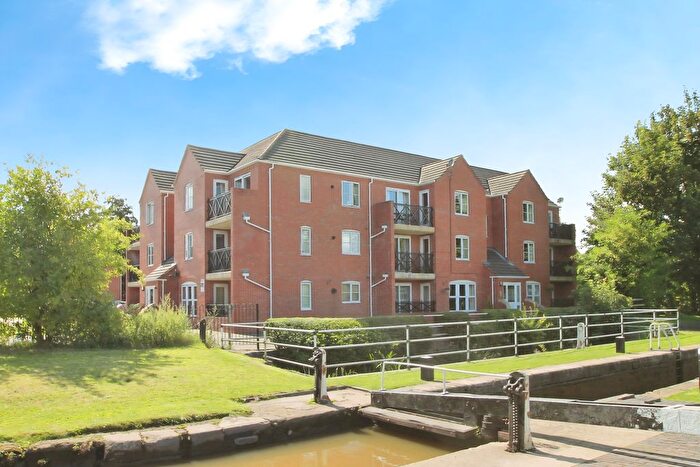
Properties in Atherstone North have an average house price of £253,015.00 and had 108 Property Transactions within the last 3 years¹.
Atherstone North is an area in Atherstone, Warwickshire with 1,435 households², where the most expensive property was sold for £440,000.00.
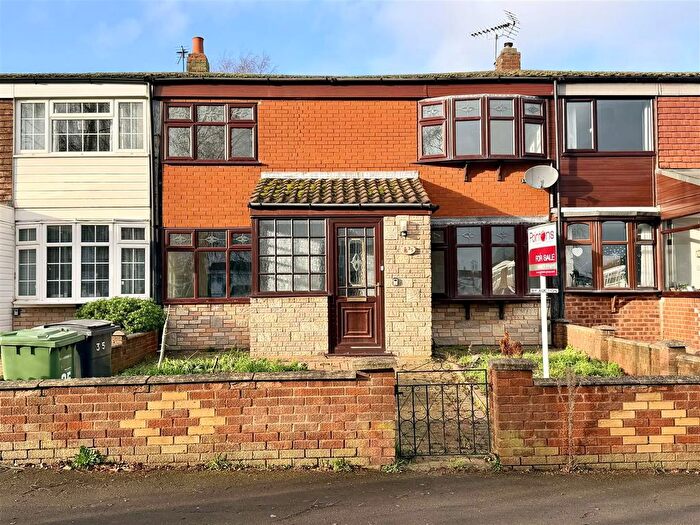
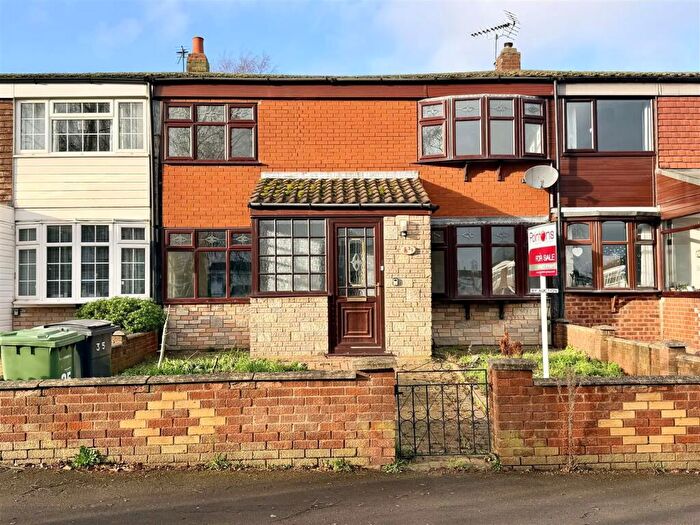
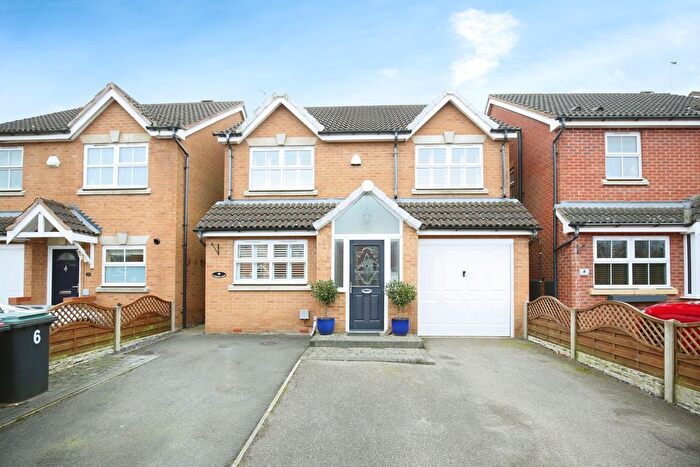
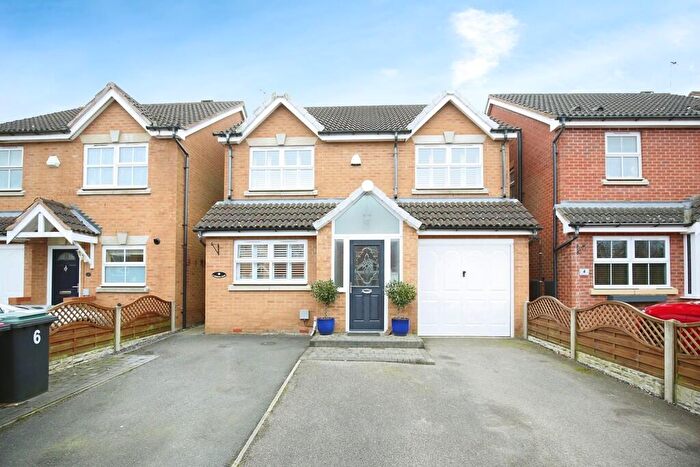
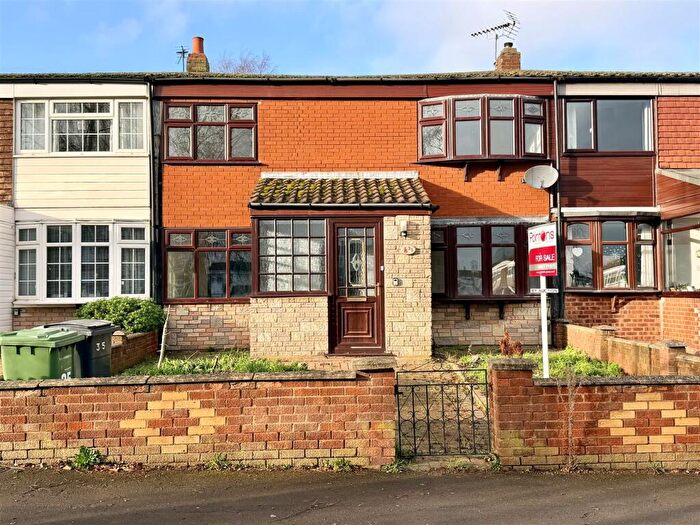
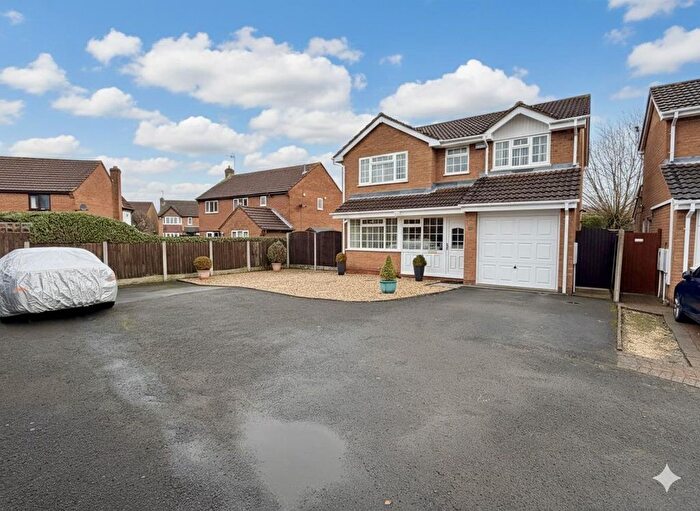
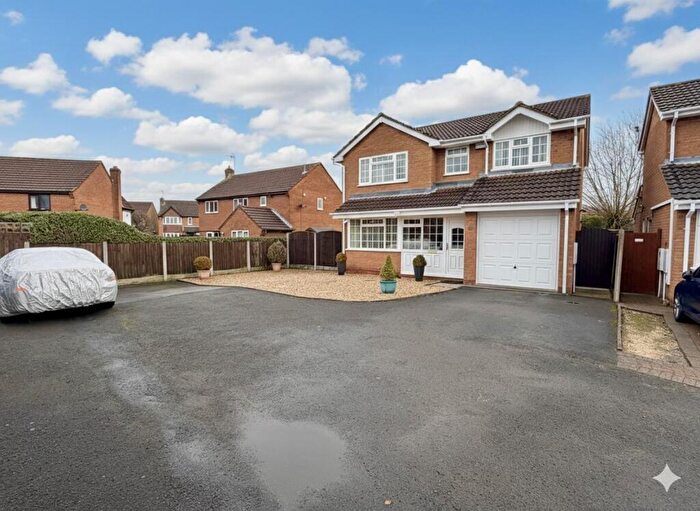
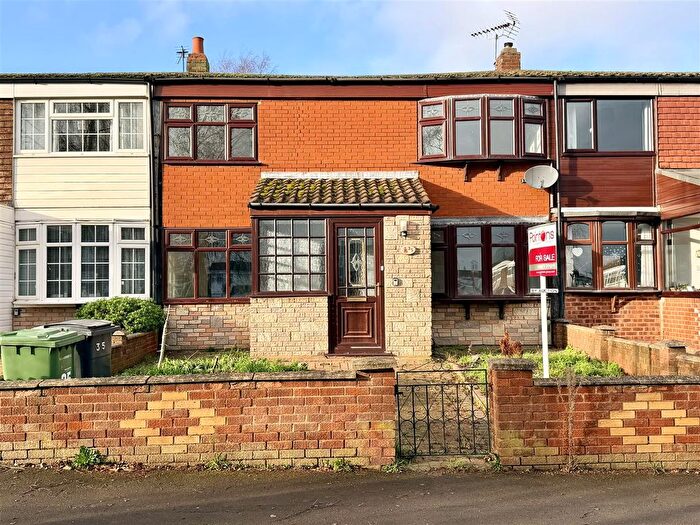
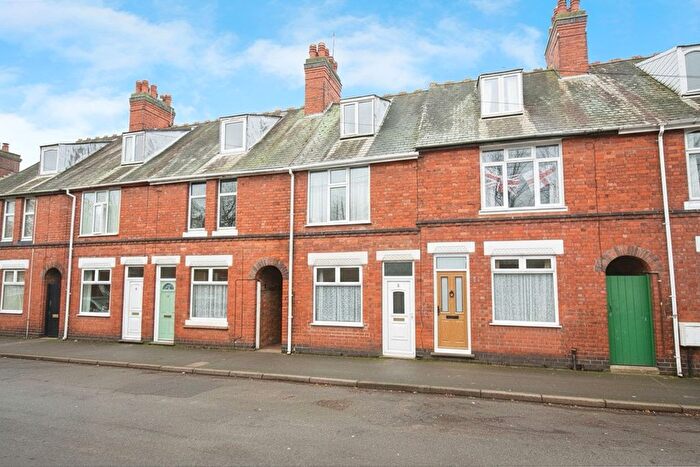
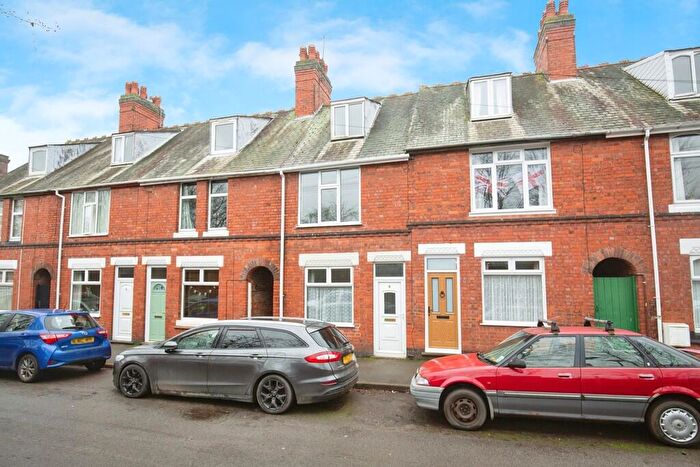
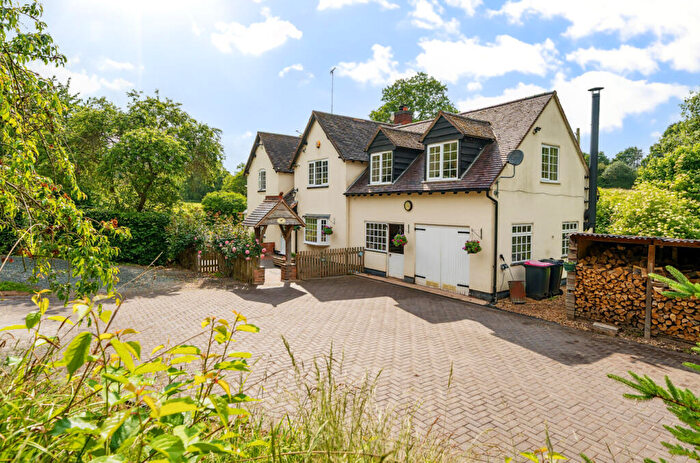
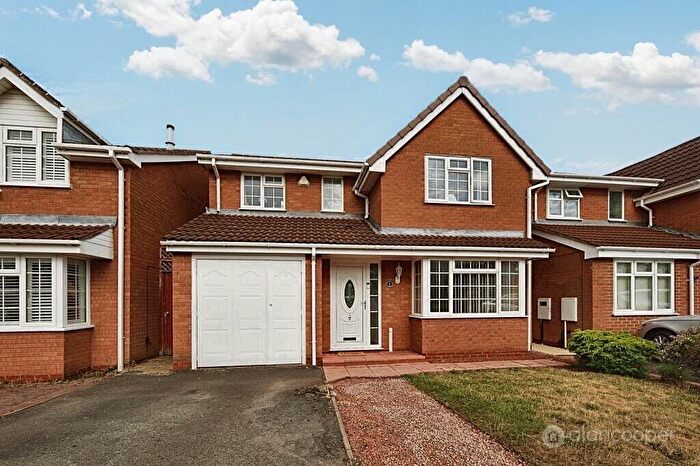
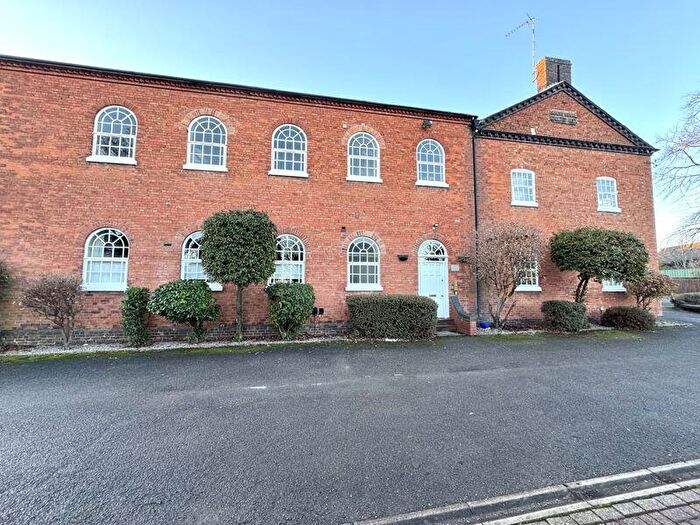
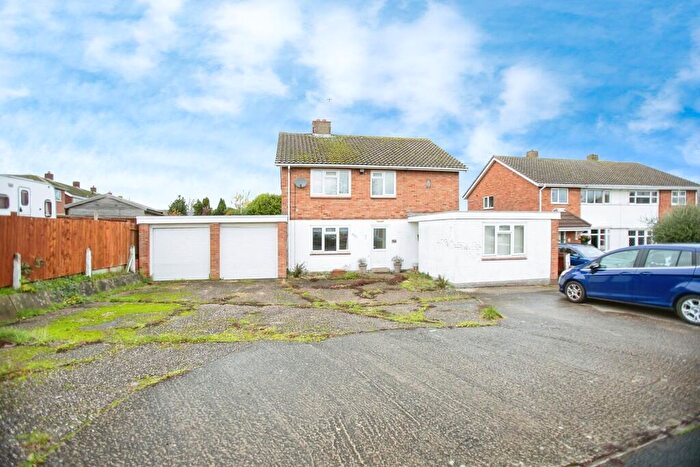
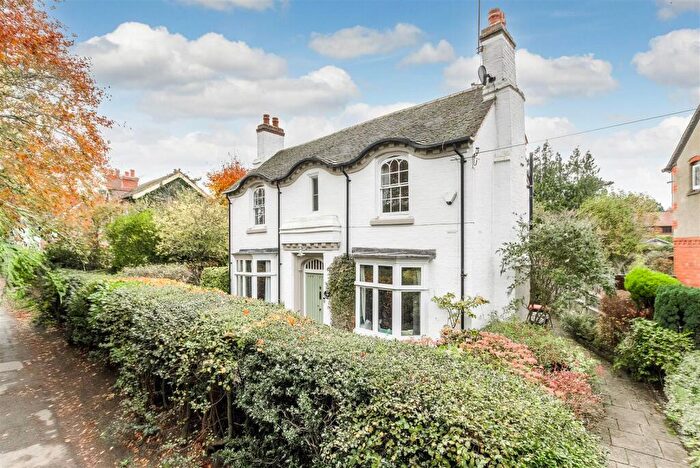
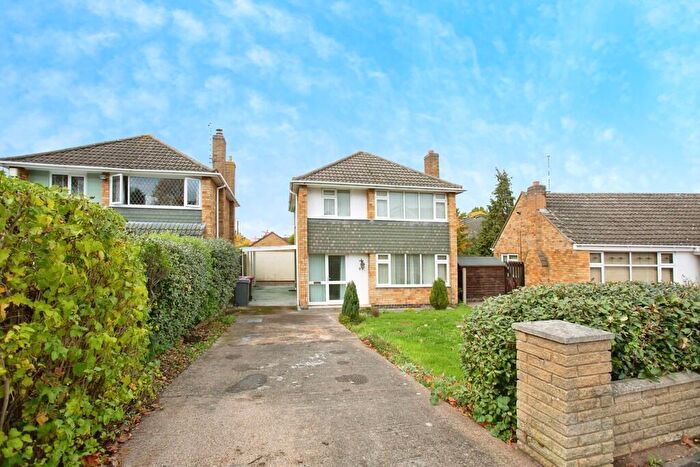
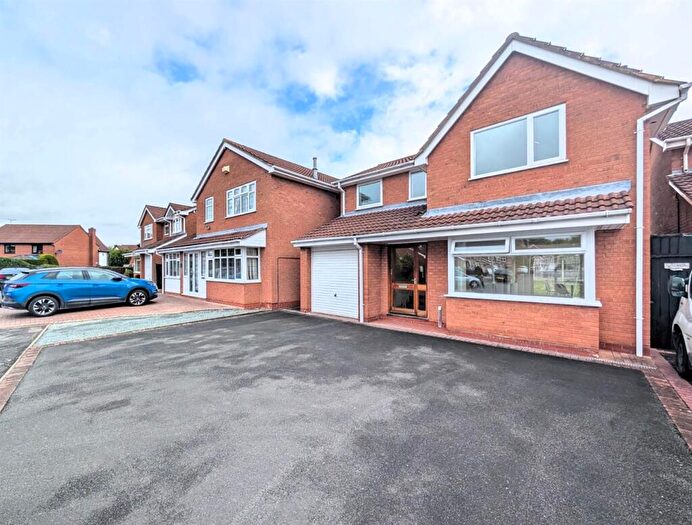
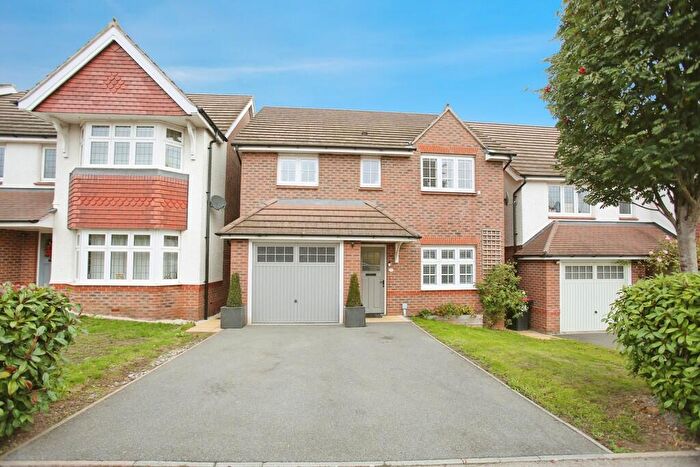
Properties for sale in Atherstone North
Roads and Postcodes in Atherstone North
Navigate through our locations to find the location of your next house in Atherstone North, Atherstone for sale or to rent.
| Streets | Postcodes |
|---|---|
| Abeles Way | CV9 2QU CV9 2QX CV9 2QZ |
| Bourne Close | CV9 3DJ |
| Bowler Close | CV9 3HL |
| Brindley Close | CV9 2GA |
| Carlyon Road | CV9 1JE CV9 1JJ CV9 1JD CV9 1JH CV9 1LQ |
| Choyce Close | CV9 3AY |
| Church Street | CV9 1HA CV9 1GB CV9 1GF CV9 1FG |
| Croft Road | CV9 1HG CV9 1HQ |
| Derby Lane | CV9 1FE |
| Dragons Court | CV9 3DG |
| Fielding Close | CV9 3SN |
| Flint Close | CV9 3AN |
| Florence Close | CV9 1HR |
| Fourways | CV9 1JG CV9 1LG CV9 1LH |
| Friars Gate | CV9 1EY |
| Friary Road | CV9 3AG CV9 3AL CV9 3AQ CV9 3AE CV9 3AF |
| Grendon Villas | CV9 2PA |
| Gypsy Lane | CV9 3AB |
| Hatters Drive | CV9 3SJ |
| Holly Lane | CV9 2RY CV9 2SQ |
| Holte Road | CV9 1HN CV9 1HW |
| Jenner Court | CV9 3DQ |
| Leicester Crescent | CV9 3BH |
| Lister Road | CV9 3BT CV9 3BU CV9 3BX CV9 3DF |
| Long Street | CV9 1AU CV9 1AX CV9 1AT CV9 1BA CV9 1BJ |
| Loveday Close | CV9 3AT |
| Market Street | CV9 1ET CV9 1EX |
| Martins Drive | CV9 3AU |
| Mill Race View | CV9 3AR |
| Mythe View | CV9 3BY CV9 3BZ |
| Nightingale Close | CV9 3DE |
| North Street | CV9 1JL |
| Northcote Walk | CV9 3SL |
| Old Holly Lane | CV9 2HD |
| Panama Drive | CV9 3HJ |
| Parkinson Drive | CV9 3DL |
| Racemeadow Road | CV9 1LJ |
| Radford Close | CV9 3LA |
| Ratcliffe Road | CV9 1LE CV9 1LF CV9 1LX CV9 1HY CV9 1JA CV9 1LT CV9 1PJ |
| Repington Avenue | CV9 3AW |
| River Drive | CV9 3SR |
| Riversdale Road | CV9 1FA |
| Royal Meadow Drive | CV9 3BE CV9 3BG CV9 3BL CV9 3BN CV9 3BQ CV9 3BW |
| Sanders Close | CV9 3AJ |
| Sheepy Road | CV9 1HD CV9 1HH CV9 1HJ CV9 3AA CV9 3AD CV9 3AH |
| Simmonds Way | CV9 3AX |
| St Georges Road | CV9 3BA CV9 3BB CV9 3BJ CV9 3BP CV9 3BS |
| St Michaels Close | CV9 1LU |
| The Willows | CV9 3DH |
| Thurlow Close | CV9 3AZ |
| Trafford Close | CV9 3AP |
| Trilby Road | CV9 3HG |
| Tudor Crescent | CV9 3DA |
| Warwick Drive | CV9 3AS |
| Well Spring Close | CV9 1HU |
| Willday Drive | CV9 3SH |
| Windmill Road | CV9 1HL CV9 1HP |
| York Avenue | CV9 3BD CV9 3DB CV9 3DD |
Transport near Atherstone North
-
Atherstone Station
-
Polesworth Station
-
Nuneaton Station
-
Wilnecote Station
-
Bermuda Park Station
-
Tamworth Low Level Station
-
Bedworth Station
-
Hinckley Station
-
Coleshill Parkway Station
-
Water Orton Station
- FAQ
- Price Paid By Year
- Property Type Price
Frequently asked questions about Atherstone North
What is the average price for a property for sale in Atherstone North?
The average price for a property for sale in Atherstone North is £253,015. This amount is 2% lower than the average price in Atherstone. There are 374 property listings for sale in Atherstone North.
What streets have the most expensive properties for sale in Atherstone North?
The streets with the most expensive properties for sale in Atherstone North are River Drive at an average of £411,125, The Willows at an average of £373,000 and Choyce Close at an average of £348,283.
What streets have the most affordable properties for sale in Atherstone North?
The streets with the most affordable properties for sale in Atherstone North are Radford Close at an average of £155,285, Leicester Crescent at an average of £171,750 and Mythe View at an average of £172,000.
Which train stations are available in or near Atherstone North?
Some of the train stations available in or near Atherstone North are Atherstone, Polesworth and Nuneaton.
Property Price Paid in Atherstone North by Year
The average sold property price by year was:
| Year | Average Sold Price | Price Change |
Sold Properties
|
|---|---|---|---|
| 2025 | £261,243 | 9% |
30 Properties |
| 2024 | £238,233 | -10% |
40 Properties |
| 2023 | £262,080 | 3% |
38 Properties |
| 2022 | £255,263 | 3% |
36 Properties |
| 2021 | £248,296 | 14% |
80 Properties |
| 2020 | £212,855 | -5% |
38 Properties |
| 2019 | £223,309 | 20% |
45 Properties |
| 2018 | £179,492 | -11% |
51 Properties |
| 2017 | £199,746 | 7% |
46 Properties |
| 2016 | £185,745 | -8% |
45 Properties |
| 2015 | £201,116 | 7% |
83 Properties |
| 2014 | £186,688 | 12% |
77 Properties |
| 2013 | £164,931 | 9% |
40 Properties |
| 2012 | £150,627 | -8% |
33 Properties |
| 2011 | £162,547 | 4% |
27 Properties |
| 2010 | £156,181 | 0,1% |
30 Properties |
| 2009 | £156,011 | 1% |
22 Properties |
| 2008 | £154,769 | -10% |
31 Properties |
| 2007 | £170,082 | 3% |
51 Properties |
| 2006 | £164,938 | 8% |
59 Properties |
| 2005 | £151,989 | 2% |
41 Properties |
| 2004 | £149,693 | 9% |
51 Properties |
| 2003 | £135,953 | 23% |
60 Properties |
| 2002 | £104,510 | 16% |
96 Properties |
| 2001 | £88,166 | -4% |
60 Properties |
| 2000 | £91,645 | 14% |
54 Properties |
| 1999 | £78,897 | 9% |
52 Properties |
| 1998 | £71,491 | 1% |
40 Properties |
| 1997 | £70,722 | -3% |
61 Properties |
| 1996 | £72,508 | 18% |
67 Properties |
| 1995 | £59,101 | - |
35 Properties |
Property Price per Property Type in Atherstone North
Here you can find historic sold price data in order to help with your property search.
The average Property Paid Price for specific property types in the last three years are:
| Property Type | Average Sold Price | Sold Properties |
|---|---|---|
| Semi Detached House | £246,338.00 | 13 Semi Detached Houses |
| Detached House | £320,061.00 | 50 Detached Houses |
| Terraced House | £182,619.00 | 44 Terraced Houses |
| Flat | £85,000.00 | 1 Flat |

