Houses for sale & to rent in Atherstone South And Mancetter, Atherstone
House Prices in Atherstone South And Mancetter
Properties in Atherstone South And Mancetter have an average house price of £282,278.00 and had 111 Property Transactions within the last 3 years¹.
Atherstone South And Mancetter is an area in Atherstone, Warwickshire with 1,379 households², where the most expensive property was sold for £1,000,000.00.
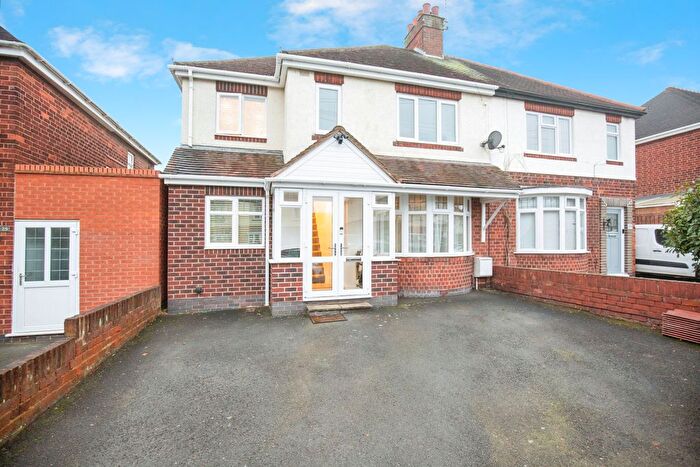
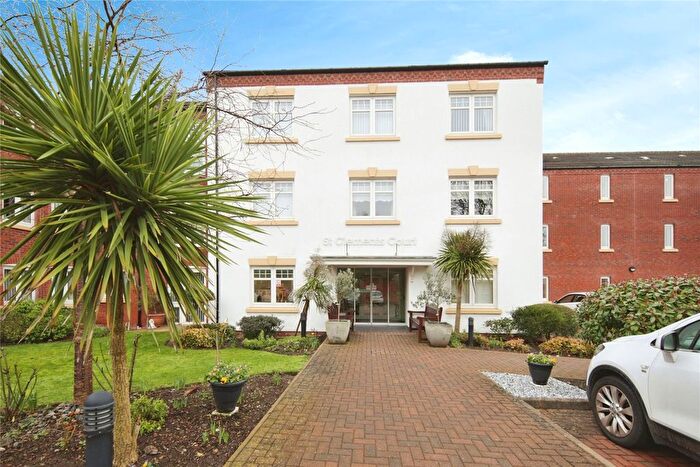
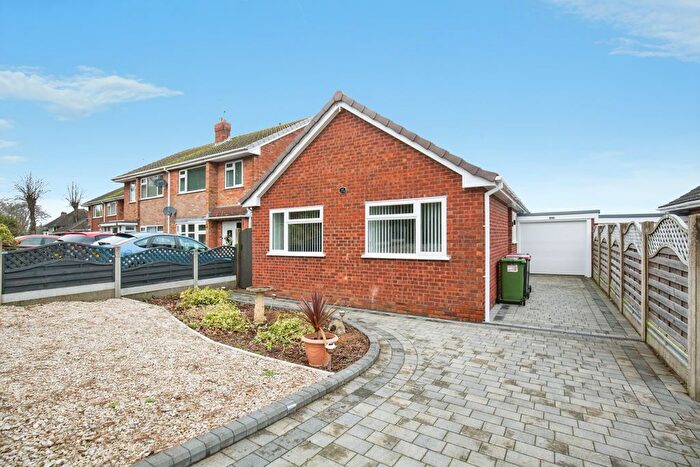
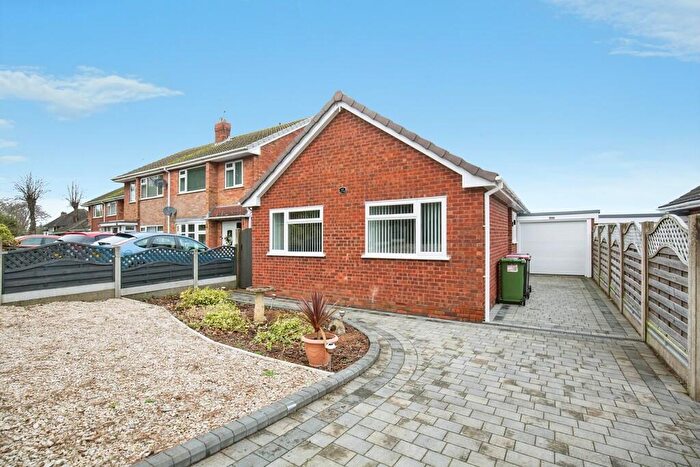
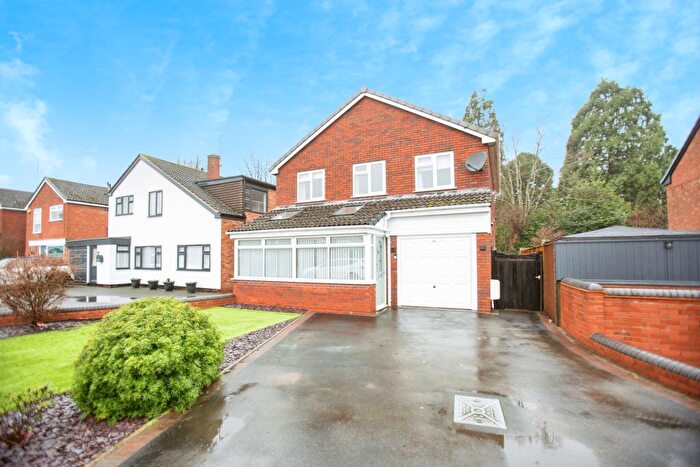
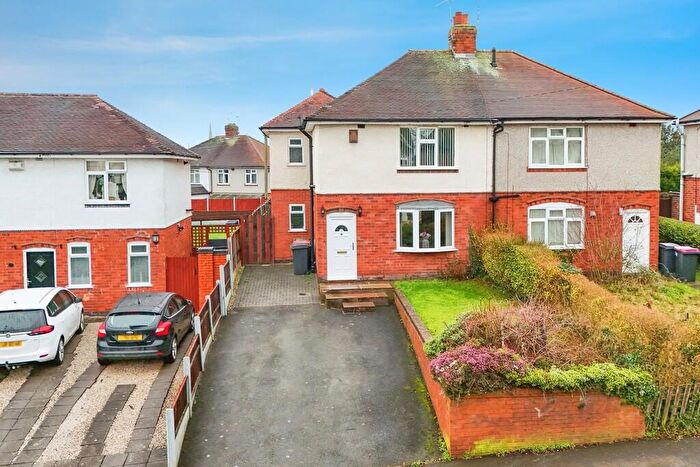
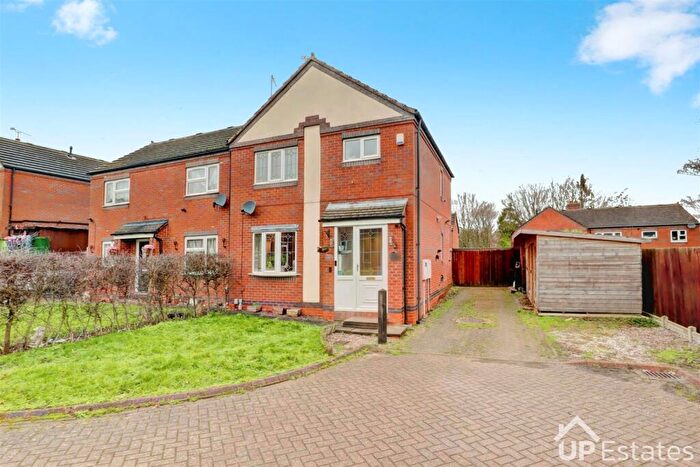
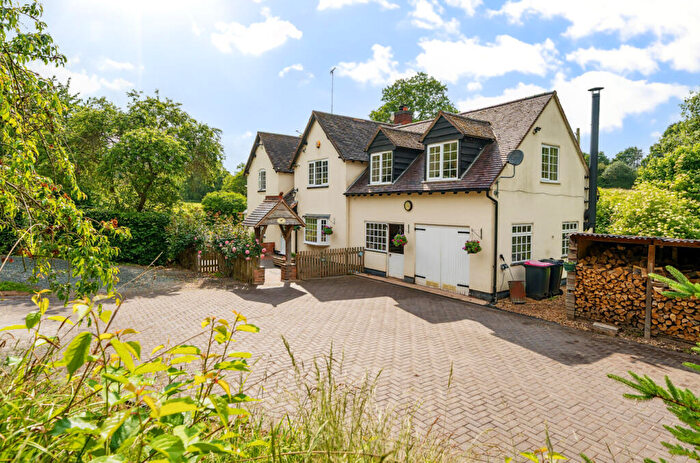
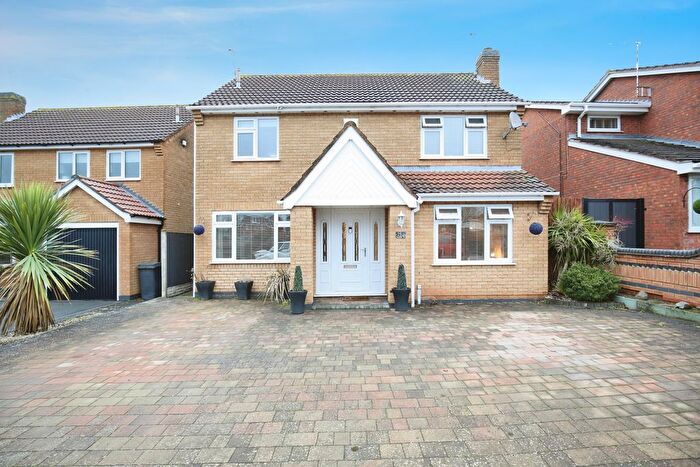
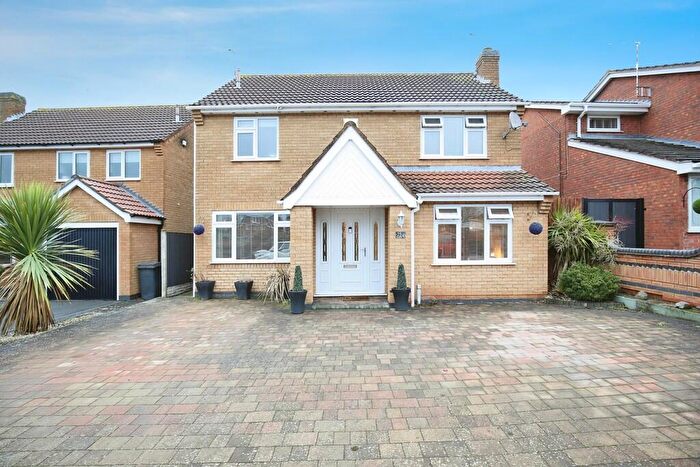
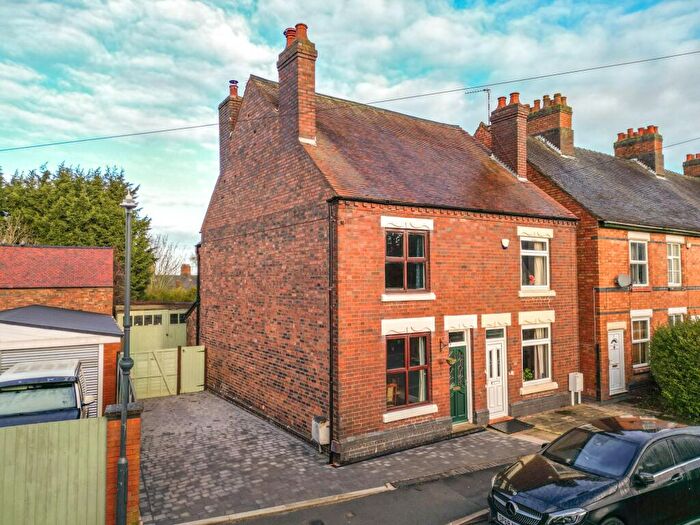
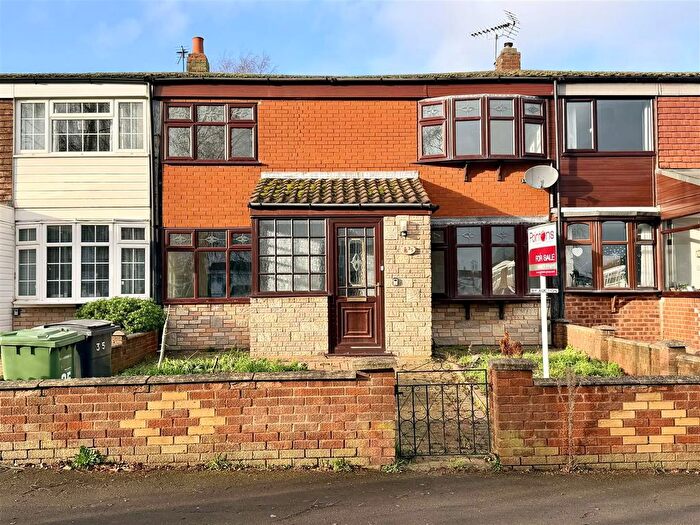
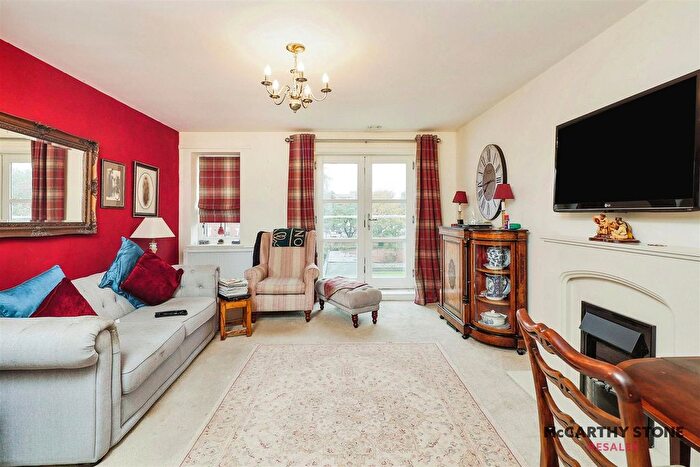
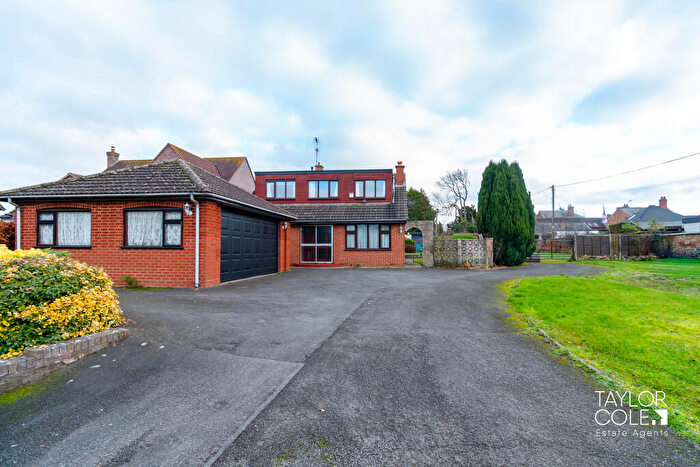
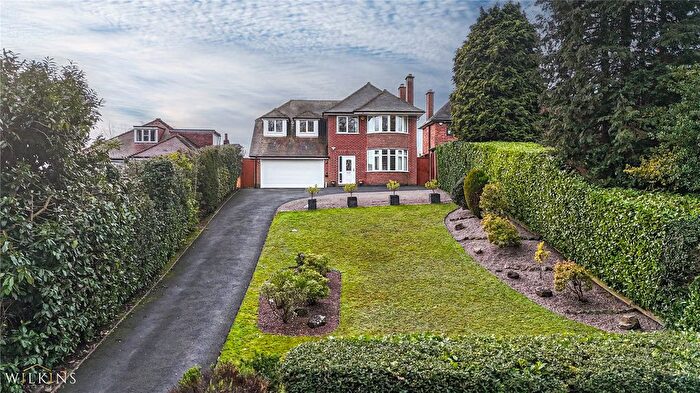
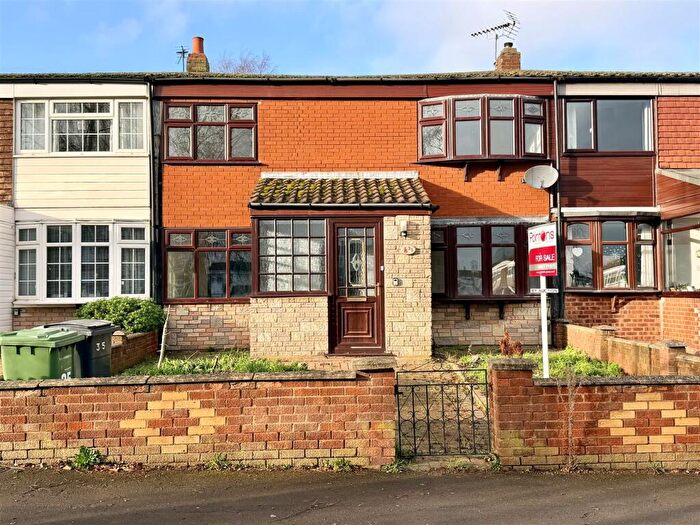
Properties for sale in Atherstone South And Mancetter
Roads and Postcodes in Atherstone South And Mancetter
Navigate through our locations to find the location of your next house in Atherstone South And Mancetter, Atherstone for sale or to rent.
| Streets | Postcodes |
|---|---|
| Adrians Close | CV9 1RH |
| Arden Avenue | CV9 1EA |
| Arden Street | CV9 1EB |
| Bath Road | CV9 1EQ |
| Brook Walk | CV9 1QE |
| Cadman Close | CV9 1RL |
| Carlyon Road | CV9 1PD |
| Charles Road | CV9 1PX |
| Charlotte Way | CV9 1AS CV9 1AW |
| Church Walk | CV9 1AJ CV9 1NX CV9 1PP CV9 1PS CV9 1PU CV9 1PY CV9 1QD CV9 1PZ CV9 1QZ CV9 1RA |
| Convent Close | CV9 1PW |
| Convent Lane | CV9 1AL |
| Daniel Road | CV9 1PA |
| Findley Close | CV9 1QX |
| Fishers Walk | CV9 1DT |
| Glovers Close | CV9 1QF |
| Gramer Court | CV9 1NU |
| Greendale Close | CV9 1PR |
| Greendale Road | CV9 1EG |
| Harpers Lane | CV9 1NG |
| Hollands Mead | CV9 1BY |
| Ivor Road | CV9 1NB |
| Lewis Close | CV9 1QU |
| Lodge Close | CV9 1NR |
| Long Street | CV9 1AH CV9 1RP |
| Mancetter Road | CV9 1NH CV9 1NY CV9 1NZ |
| Manor Road | CV9 1QJ CV9 1QL CV9 1QR CV9 1NS CV9 1QS CV9 1QY CV9 1RB CV9 1RJ CV9 1TE |
| Margaret Road | CV9 1EE CV9 1EF |
| Marie Close | CV9 1NF |
| Mill Lane | CV9 1NP |
| Monks Park Lane | CV9 2RH |
| Nuneaton Road | CV9 1NN CV9 1NW CV9 1RF |
| Nursery Road | CV9 1PN |
| Oakfield Gardens | CV9 1SA |
| Old Farm Road | CV9 1QN CV9 1QW |
| Priory Walk | CV9 1QA CV9 1QB |
| Purley Chase Lane | CV9 2RQ |
| Purley View | CV9 1QG CV9 1QQ |
| Quarry Lane | CV9 1NL CV9 2RA CV9 2RB CV9 2RD CV9 2RF |
| Ramsden Road | CV9 1PB |
| Rawn View | CV9 1QH |
| Rose Hill | CV9 1PT |
| School Court | CV9 1EW |
| South Street | CV9 1ED |
| Southlands | CV9 1EH |
| St Peters Road | CV9 1NQ |
| Steppey Lane | CV9 2RG |
| The Coppice | CV9 1RT |
| The Green | CV9 1NJ |
| The Rowans | CV9 1LS |
| The Spinney | CV9 1RS |
| Vicarage Close | CV9 1QT |
| Victoria Road | CV9 1QP |
| Walnut Drive | CV9 1NT |
| Watling Street | CV9 1NE CV9 1RE |
| Welcome Street | CV9 1DX |
| Witherley Road | CV9 1LY CV9 1LZ CV9 1NA CV9 1ND |
| Woodhayes Grange | CV9 1DZ |
| Woodview Road | CV9 1EJ |
| CV9 2RL |
Transport near Atherstone South And Mancetter
-
Atherstone Station
-
Nuneaton Station
-
Polesworth Station
-
Bermuda Park Station
-
Wilnecote Station
-
Bedworth Station
-
Hinckley Station
-
Tamworth Low Level Station
-
Coleshill Parkway Station
-
Coventry Arena Station
- FAQ
- Price Paid By Year
- Property Type Price
Frequently asked questions about Atherstone South And Mancetter
What is the average price for a property for sale in Atherstone South And Mancetter?
The average price for a property for sale in Atherstone South And Mancetter is £282,278. This amount is 10% higher than the average price in Atherstone. There are 548 property listings for sale in Atherstone South And Mancetter.
What streets have the most expensive properties for sale in Atherstone South And Mancetter?
The streets with the most expensive properties for sale in Atherstone South And Mancetter are Monks Park Lane at an average of £736,000, The Coppice at an average of £685,000 and Oakfield Gardens at an average of £582,500.
What streets have the most affordable properties for sale in Atherstone South And Mancetter?
The streets with the most affordable properties for sale in Atherstone South And Mancetter are Long Street at an average of £90,496, School Court at an average of £103,750 and Old Farm Road at an average of £125,000.
Which train stations are available in or near Atherstone South And Mancetter?
Some of the train stations available in or near Atherstone South And Mancetter are Atherstone, Nuneaton and Polesworth.
Property Price Paid in Atherstone South And Mancetter by Year
The average sold property price by year was:
| Year | Average Sold Price | Price Change |
Sold Properties
|
|---|---|---|---|
| 2025 | £266,983 | -17% |
30 Properties |
| 2024 | £312,214 | 15% |
40 Properties |
| 2023 | £264,264 | -4% |
41 Properties |
| 2022 | £275,355 | -6% |
54 Properties |
| 2021 | £291,693 | 29% |
66 Properties |
| 2020 | £206,887 | -21% |
32 Properties |
| 2019 | £250,462 | 12% |
29 Properties |
| 2018 | £220,076 | 4% |
54 Properties |
| 2017 | £211,578 | 17% |
35 Properties |
| 2016 | £175,945 | -0,2% |
57 Properties |
| 2015 | £176,276 | 6% |
60 Properties |
| 2014 | £165,932 | -4% |
45 Properties |
| 2013 | £172,433 | 2% |
31 Properties |
| 2012 | £168,133 | - |
37 Properties |
| 2011 | £168,122 | -1% |
36 Properties |
| 2010 | £169,361 | -25% |
36 Properties |
| 2009 | £210,897 | -2% |
21 Properties |
| 2008 | £214,276 | 28% |
47 Properties |
| 2007 | £153,884 | -14% |
68 Properties |
| 2006 | £175,133 | 10% |
49 Properties |
| 2005 | £156,923 | 4% |
45 Properties |
| 2004 | £150,873 | 2% |
50 Properties |
| 2003 | £148,292 | 27% |
45 Properties |
| 2002 | £108,631 | 21% |
54 Properties |
| 2001 | £86,001 | -22% |
52 Properties |
| 2000 | £104,503 | 11% |
47 Properties |
| 1999 | £92,505 | 27% |
45 Properties |
| 1998 | £67,672 | -15% |
31 Properties |
| 1997 | £77,680 | 21% |
47 Properties |
| 1996 | £61,716 | -6% |
36 Properties |
| 1995 | £65,122 | - |
38 Properties |
Property Price per Property Type in Atherstone South And Mancetter
Here you can find historic sold price data in order to help with your property search.
The average Property Paid Price for specific property types in the last three years are:
| Property Type | Average Sold Price | Sold Properties |
|---|---|---|
| Semi Detached House | £231,730.00 | 26 Semi Detached Houses |
| Detached House | £459,581.00 | 40 Detached Houses |
| Terraced House | £187,024.00 | 29 Terraced Houses |
| Flat | £93,809.00 | 16 Flats |

