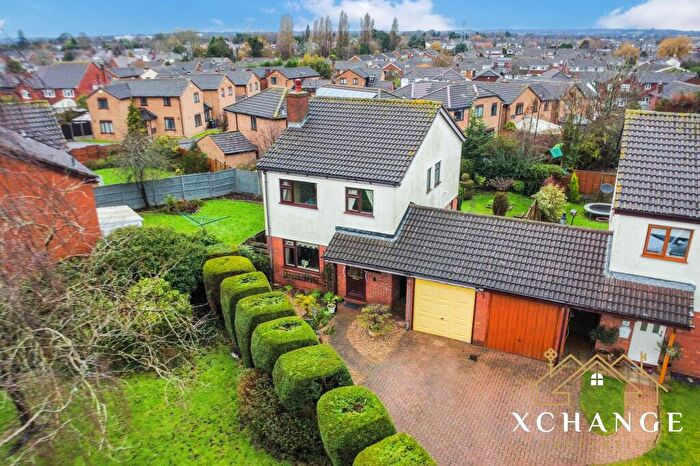
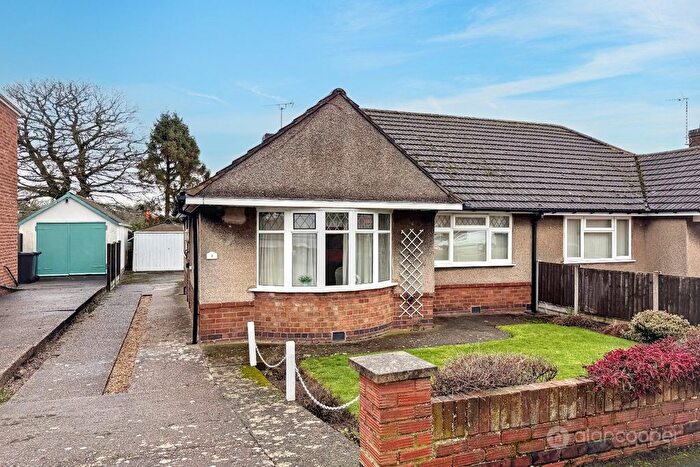
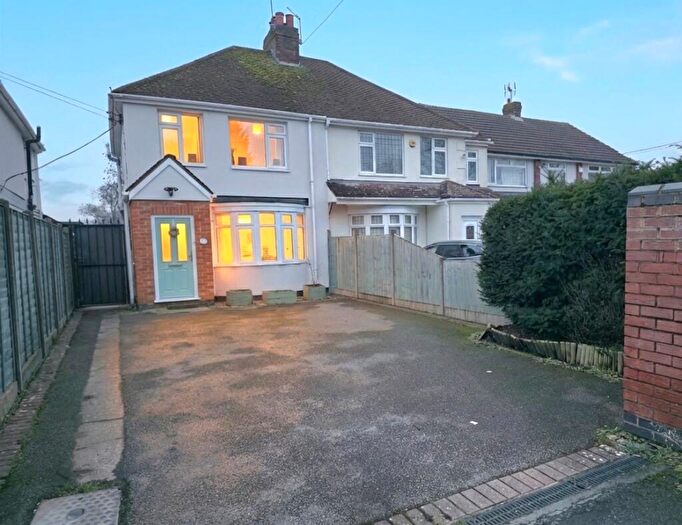
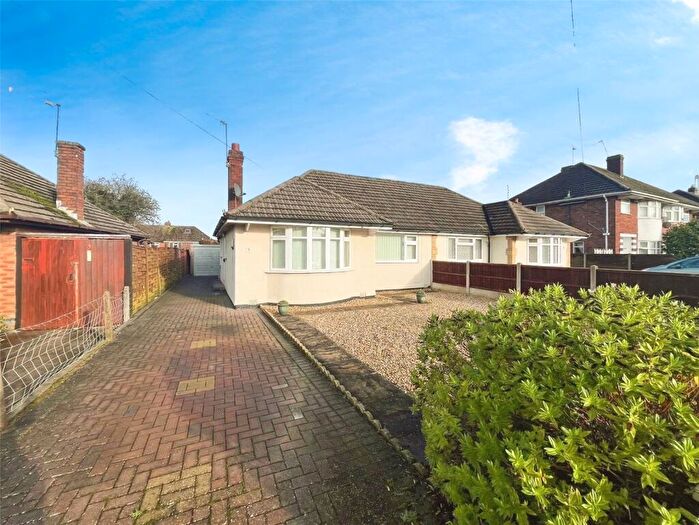
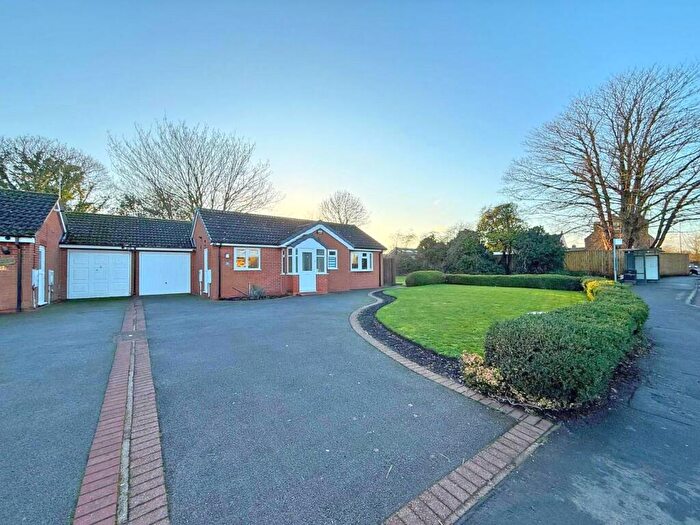
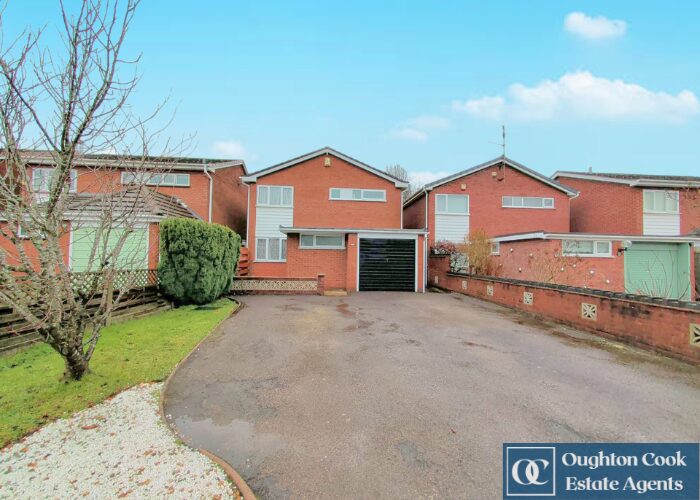
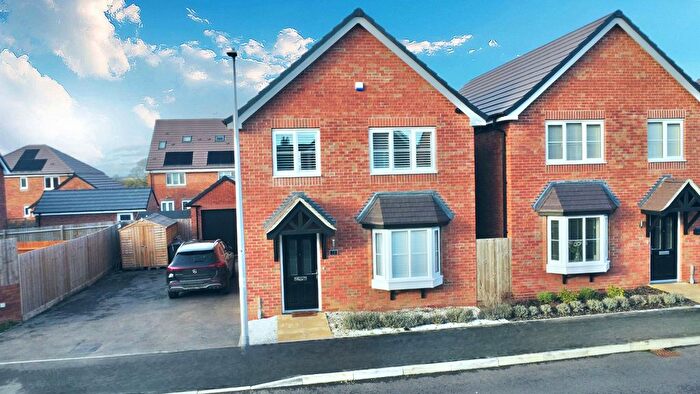
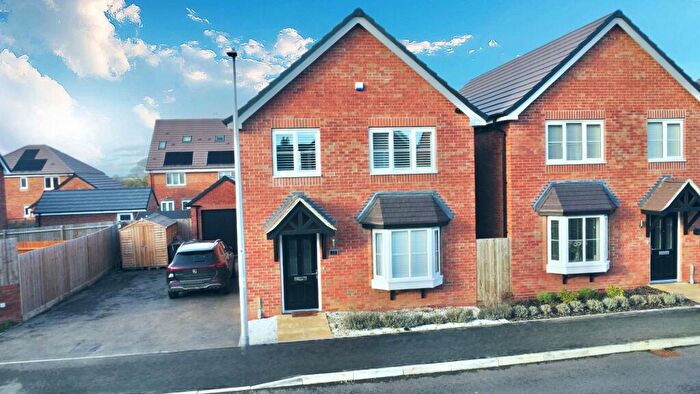
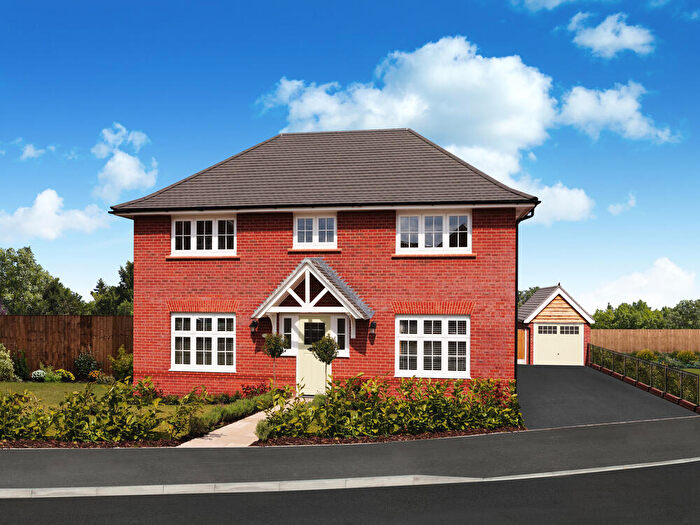
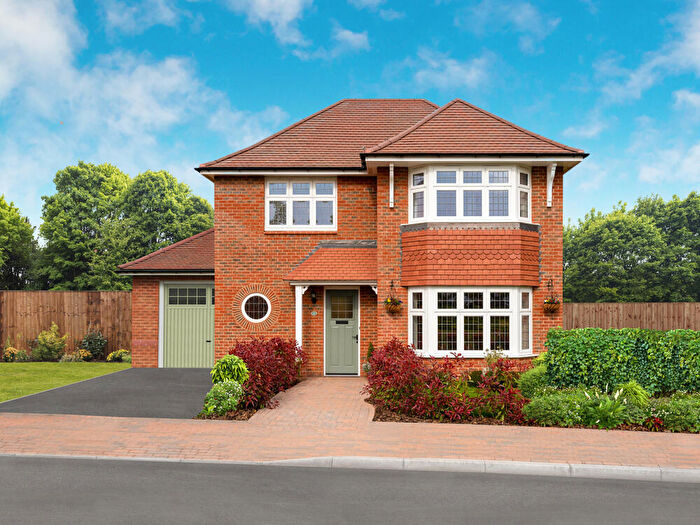
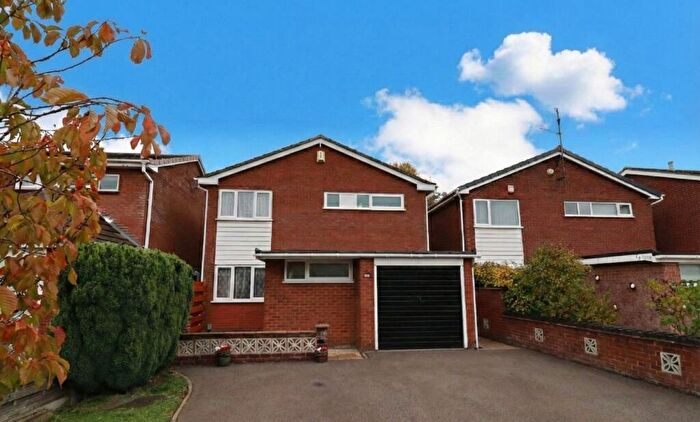
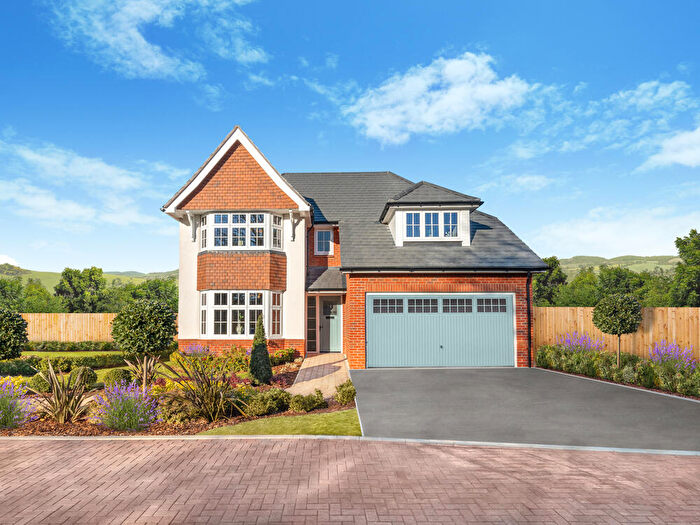
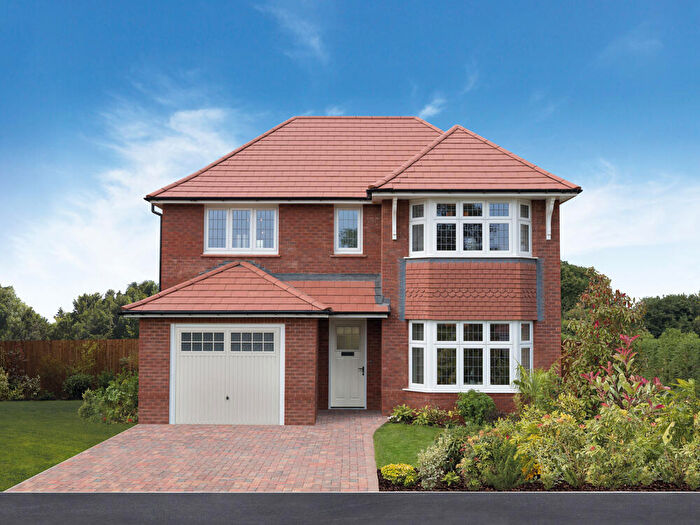
Houses for sale & to rent in Bulkington, Bedworth
House Prices in Bulkington
Properties in Bulkington have an average house price of £284,075.00 and had 197 Property Transactions within the last 3 years¹.
Bulkington is an area in Bedworth, Warwickshire with 2,766 households², where the most expensive property was sold for £750,000.00.
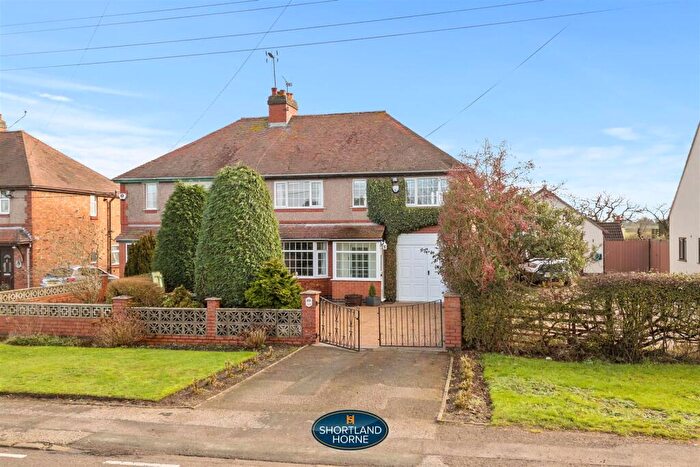
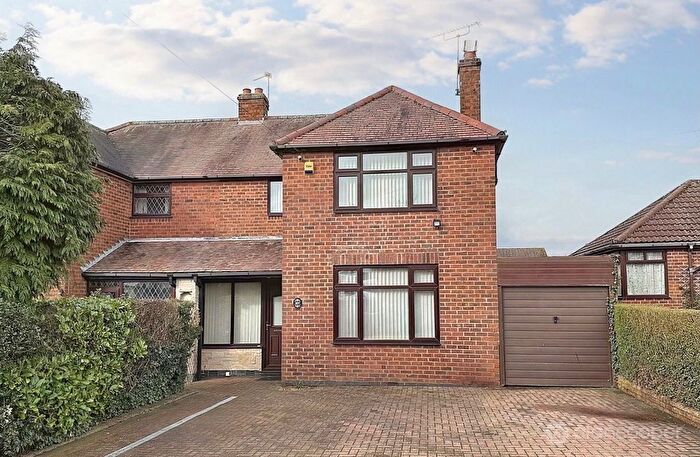
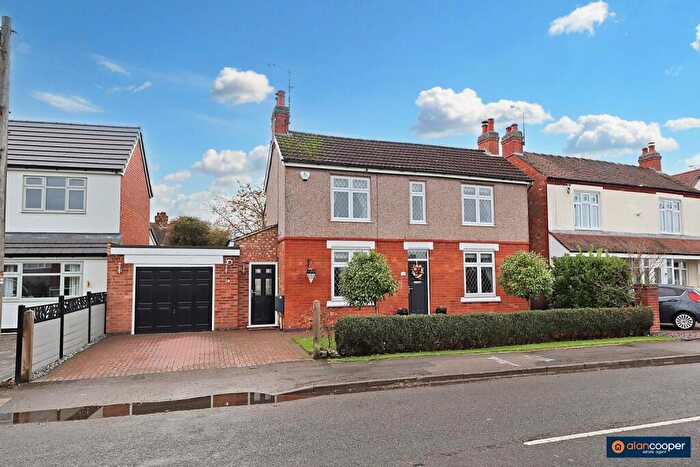
Properties for sale in Bulkington
Roads and Postcodes in Bulkington
Navigate through our locations to find the location of your next house in Bulkington, Bedworth for sale or to rent.
| Streets | Postcodes |
|---|---|
| Admirals Way | CV11 6QX |
| Amberley Avenue | CV12 9QY CV12 9QZ |
| Amelia Close | CV12 9QJ |
| Arden Road | CV12 9JJ |
| Arundel Road | CV12 9QS |
| Avon Close | CV12 9SA |
| Barbridge Close | CV12 9PY |
| Barbridge Road | CV12 9PD CV12 9PF |
| Barnacle Lane | CV12 9RJ CV12 9RQ |
| Bedworth Close | CV12 9LX |
| Bedworth Road | CV12 9JA CV12 9LH CV12 9LJ CV12 9LL CV12 9LQ CV12 9LS CV12 9LT CV12 9LG CV12 9NR CV12 9PZ |
| Benn Road | CV12 9LN |
| Bramcote Close | CV12 9LA |
| Brampton Way | CV12 9PR |
| Brewer Road | CV12 9RF |
| Calder Close | CV12 9PN |
| Campling Close | CV12 9LR |
| Carlton Close | CV12 9PT |
| Caroline Place | CV12 9NN |
| Chequer Street | CV12 9NA CV12 9NH |
| Church Street | CV12 9NL |
| Claremont Close | CV12 9RP |
| Cleveland Road | CV12 9PA CV12 9PH CV12 9PJ |
| Clyde Road | CV12 9QE |
| Coalpit Fields Road | CV12 9HJ |
| Coniston Close | CV12 9PP |
| Coventry Road | CV12 9LY CV12 9LZ CV12 9NB CV12 9ND CV12 9NJ |
| Dingley Road | CV12 9LP |
| Elm Tree Road | CV12 9RE CV12 9RL |
| Eustace Road | CV12 9RG |
| Farndon Close | CV12 9QH |
| Findon Close | CV12 9QT |
| Firleigh Drive | CV12 9SP |
| Forders Lane | CV12 9SG |
| Glendon Gardens | CV12 9PQ |
| Hemsworth Drive | CV12 9PE |
| Kingsley Crescent | CV12 9PL CV12 9PS |
| Lancing Road | CV12 9QU |
| Larkin Close | CV12 9PB |
| Leicester Street | CV12 9NG CV12 9NP CV12 9NQ |
| Leyland Road | CV12 9LW CV12 9SL |
| Long Street | CV12 9JZ |
| Lutterworth Road | CV11 6RW |
| Marston Hall Industrial Estate | CV12 9SN |
| Marston Lane | CV12 9SD CV12 9AZ |
| Mersey Road | CV12 9QB |
| Mill Farm Park | CV12 9SE CV12 9SF |
| Mill Lane | CV12 9RU |
| Millpond Way | CV12 9BD |
| Milner Close | CV12 9LB |
| Morland Close | CV12 9JY |
| Neale Close | CV12 9RH |
| New Street | CV12 9RB |
| Nuneaton Road | CV12 9QL CV12 9QN CV12 9QP CV12 9QW CV12 9RR CV12 9RZ CV12 9SB CV12 9QR CV12 9RY |
| Oakham Crescent | CV12 9JS |
| Quincy Close | CV11 6AY |
| Ribble Close | CV12 9PX |
| Rugby Road | CV12 9JE CV12 9JF CV12 9JG CV12 9JQ |
| Ryton Gardens | CV12 9LD |
| School Road | CV12 9JB CV12 9JD CV12 9JH |
| Severn Road | CV12 9QG CV12 9QQ |
| Shilton Lane | CV12 9JL CV12 9JP |
| Silver Trees Drive | CV12 9NX |
| Sowe Close | CV12 9BB |
| St James Gardens | CV12 9NT |
| Stafford Close | CV12 9QX |
| Staples Close | CV12 9PG |
| Tamar Road | CV12 9PU |
| Thames Close | CV12 9QF |
| The Birches | CV12 9PW |
| The Croft | CV12 9LU |
| The Paddocks | CV12 9SR |
| Trent Road | CV12 9QD |
| Villa Close | CV12 9NE |
| Villa Crescent | CV12 9NF |
| Warwick Green | CV12 9RA |
| Weavers Close | CV12 9NS |
| Wem Drive | CV12 9BA |
| Weston Lane | CV12 9RS CV12 9RT CV12 9RX |
| William Beesley Crescent | CV11 6QY |
| Winterton Road | CV12 9RD |
| Withybrook Road | CV12 9JN |
| Wolvey Road | CV12 9JR CV12 9JT CV12 9JU |
| Wye Close | CV12 9QA |
Transport near Bulkington
- FAQ
- Price Paid By Year
- Property Type Price
Frequently asked questions about Bulkington
What is the average price for a property for sale in Bulkington?
The average price for a property for sale in Bulkington is £284,075. This amount is 26% higher than the average price in Bedworth. There are 1,074 property listings for sale in Bulkington.
What streets have the most expensive properties for sale in Bulkington?
The streets with the most expensive properties for sale in Bulkington are The Paddocks at an average of £480,000, Shilton Lane at an average of £478,333 and Quincy Close at an average of £452,500.
What streets have the most affordable properties for sale in Bulkington?
The streets with the most affordable properties for sale in Bulkington are Leicester Street at an average of £104,166, Stafford Close at an average of £111,062 and Elm Tree Road at an average of £148,000.
Which train stations are available in or near Bulkington?
Some of the train stations available in or near Bulkington are Bedworth, Bermuda Park and Nuneaton.
Property Price Paid in Bulkington by Year
The average sold property price by year was:
| Year | Average Sold Price | Price Change |
Sold Properties
|
|---|---|---|---|
| 2025 | £281,031 | -3% |
55 Properties |
| 2024 | £288,533 | 3% |
81 Properties |
| 2023 | £280,900 | 1% |
61 Properties |
| 2022 | £277,174 | -1% |
109 Properties |
| 2021 | £281,018 | 11% |
116 Properties |
| 2020 | £251,034 | 9% |
83 Properties |
| 2019 | £229,294 | -0,2% |
92 Properties |
| 2018 | £229,662 | -3% |
120 Properties |
| 2017 | £237,468 | 6% |
107 Properties |
| 2016 | £222,206 | 15% |
109 Properties |
| 2015 | £189,904 | 6% |
93 Properties |
| 2014 | £179,307 | 9% |
79 Properties |
| 2013 | £162,471 | -3% |
58 Properties |
| 2012 | £167,133 | -7% |
48 Properties |
| 2011 | £179,449 | 5% |
54 Properties |
| 2010 | £170,997 | 10% |
68 Properties |
| 2009 | £154,519 | -3% |
63 Properties |
| 2008 | £159,431 | -11% |
40 Properties |
| 2007 | £176,596 | 3% |
101 Properties |
| 2006 | £172,026 | 6% |
118 Properties |
| 2005 | £161,260 | 4% |
60 Properties |
| 2004 | £155,185 | 12% |
99 Properties |
| 2003 | £136,914 | 12% |
99 Properties |
| 2002 | £119,979 | 16% |
113 Properties |
| 2001 | £100,574 | 8% |
104 Properties |
| 2000 | £92,433 | 15% |
85 Properties |
| 1999 | £79,001 | 7% |
102 Properties |
| 1998 | £73,624 | 9% |
83 Properties |
| 1997 | £67,249 | 13% |
91 Properties |
| 1996 | £58,440 | -3% |
72 Properties |
| 1995 | £60,089 | - |
79 Properties |
Property Price per Property Type in Bulkington
Here you can find historic sold price data in order to help with your property search.
The average Property Paid Price for specific property types in the last three years are:
| Property Type | Average Sold Price | Sold Properties |
|---|---|---|
| Semi Detached House | £260,175.00 | 118 Semi Detached Houses |
| Detached House | £396,402.00 | 52 Detached Houses |
| Terraced House | £214,647.00 | 17 Terraced Houses |
| Flat | £100,025.00 | 10 Flats |

